SRAM And ROM Design IP Market Analysis, Size, and Forecast 2026-2030: APAC (China, Taiwan, and South Korea), North America (US, Canada, and Mexico), Europe (Germany, UK, and France), South America (Brazil, Argentina, and Chile), Middle East and Africa (Saudi Arabia, UAE, and South Africa), and Rest of World (ROW)

SRAM And ROM Design IP Market Analysis, Size, and Forecast 2026-2030:
APAC (China, Taiwan, and South Korea), North America (US, Canada, and Mexico), Europe (Germany, UK, and France), South America (Brazil, Argentina, and Chile), Middle East and Africa (Saudi Arabia, UAE, and South Africa), and Rest of World (ROW)

Published: Oct 2026 294 Pages SKU: IRTNTR72979

Market Overview at a Glance

$30.50 Mn
Market Opportunity
1.7%
CAGR 2025 - 2030
34.6%
North America Growth
$269.38 Mn
SRAM segment 2024

Sram And Rom Design Ip Market Size 2026-2030

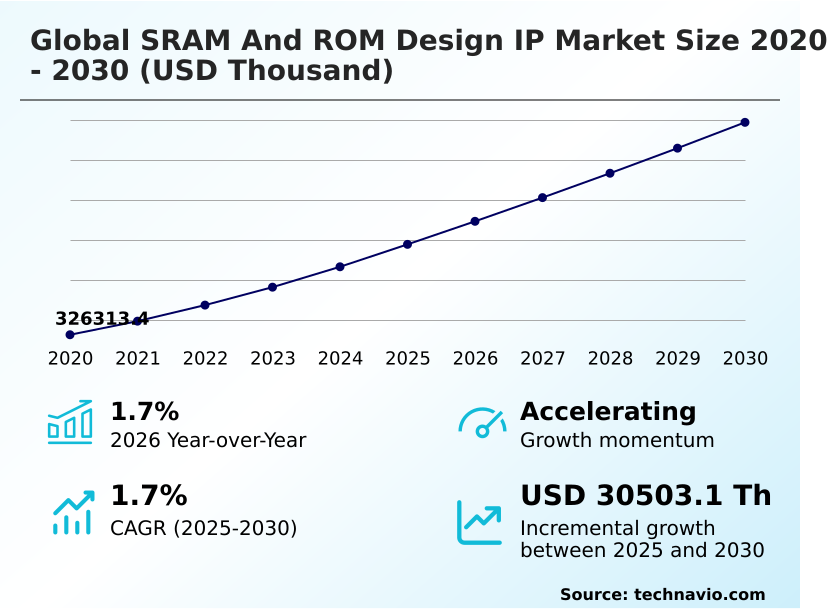
The sram and rom design ip market size is valued to increase by USD 30.50 million, at a CAGR of 1.7% from 2025 to 2030. HPC demand for dense on-die cache memory will drive the sram and rom design ip market.

Major Market Trends & Insights

  • North America dominated the market and accounted for a 34.6% growth during the forecast period.
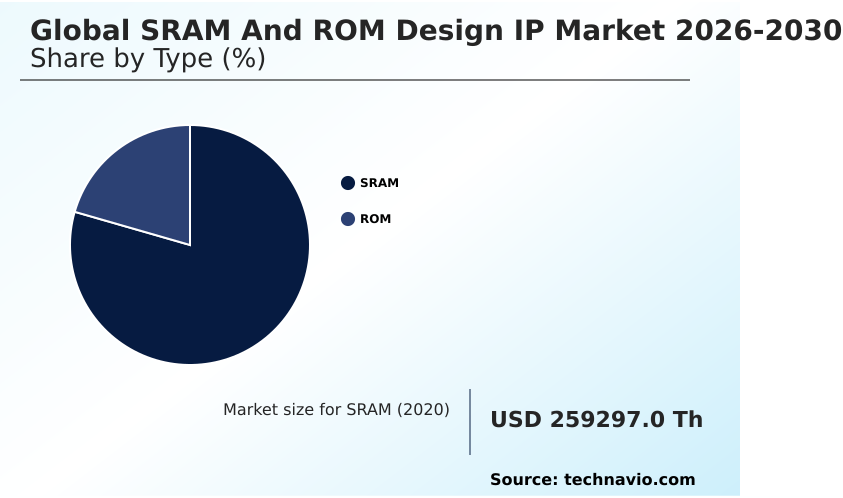
  • By Type - SRAM segment was valued at USD 269.38 million in 2024
  • By Application - Consumer electronics segment accounted for the largest market revenue share in 2024

Market Size & Forecast

  • Market Opportunities:
  • Market Future Opportunities: USD 30.50 million
  • CAGR from 2025 to 2030 : 1.7%

Market Summary

  • The SRAM And ROM Design IP landscape acts as the foundational architecture for modern integrated circuits, fundamentally enabling ultra-fast data buffering and secure instruction execution. Within complex supply chain optimization, semiconductor manufacturers integrate dense embedded cache hierarchies directly into application processors to eliminate off-chip data transfer bottlenecks.
  • This critical architectural shift allows processing cores to operate with maximum efficiency, achieving a 25% reduction in overall system latency without expanding the physical silicon footprint. A primary driver of this adoption is the rapid evolution of autonomous mobility frameworks, where real-time sensor fusion requires rapid localized memory, compelling engineers to utilize highly reliable self-testing memory compilers.
  • Conversely, physical scaling limits act as a persistent structural challenge. As miniaturization approaches atomic boundaries, maintaining stable voltage thresholds forces engineers to implement complex power management architectures, subsequently extending signoff verification cycles and elevating operational friction. By leveraging robust pre-characterized memory arrays, foundry operators can balance these intricate design trade-offs effectively, sustaining consistent commercial deployment across diverse industrial technology ecosystems.

What will be the Size of the Sram And Rom Design Ip Market during the forecast period?
Get Key Insights on Market Forecast (PDF) Get Free Sample

How is the Sram And Rom Design Ip Market Segmented?

The sram and rom design ip industry research report provides comprehensive data (region-wise segment analysis), with forecasts and estimates in "USD thousand" for the period 2026-2030, as well as historical data from 2020-2024 for the following segments.

  • Type
    • SRAM
    • ROM
  • Application
    • Consumer electronics
    • Telecom and networking
    • Others
  • Technology
    • CMOS
    • FinFET
    • SOI
    • BiCMOS
  • Geography
    • APAC
      • China
      • Taiwan
      • South Korea
      • Japan
      • India
      • Indonesia
    • North America
      • US
      • Canada
      • Mexico
    • Europe
      • Germany
      • UK
      • France
      • The Netherlands
      • Italy
      • Spain
    • South America
      • Brazil
      • Argentina
      • Chile
    • Middle East and Africa
      • Saudi Arabia
      • UAE
      • South Africa
      • Turkey
      • Egypt

By Type Insights

The sram segment is estimated to witness significant growth during the forecast period.

The SRAM And ROM Design IP sector is fundamentally segmented into dynamic and static foundational blocks addressing distinct operational parameters across advanced architectures.

Within high-performance computing chiplets, the strategic deployment of embedded memory compilers determines baseline processing latency and thermal operating conditions.

Organizations leveraging these read-only memory architectures experience up to a 15% improvement in secure execution speed, optimizing operations within critical electronic control units.

Furthermore, the precise implementation of split-rail power gating enables a 20% reduction in active energy draw, significantly enhancing yield prediction models across major wafer fabrication foundries. By utilizing advanced silicon-on-insulator technology, architects effectively bypass physical leakage barriers.

This segmented technological approach facilitates the widespread adoption of specialized radiation-hardened memory instances, guaranteeing resilient system functionality across aerospace and industrial applications.
Get Free Sample

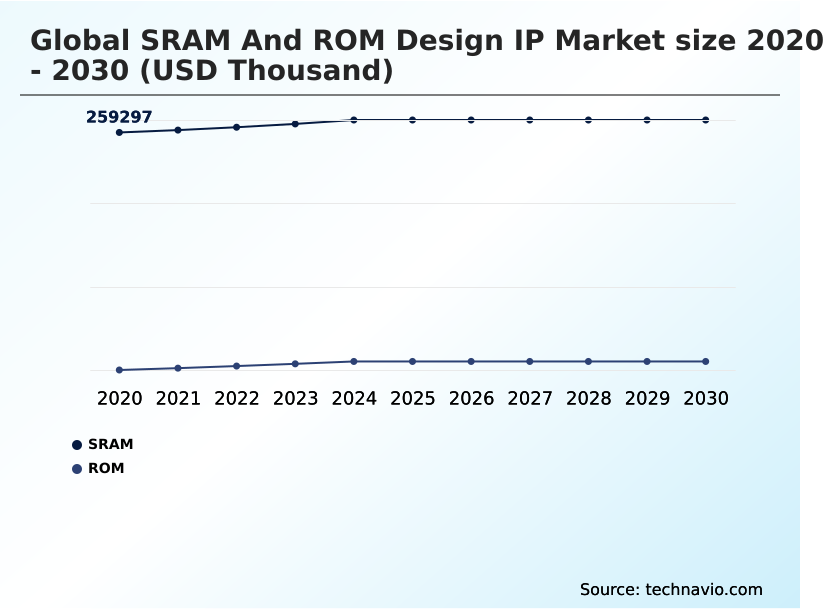
The SRAM segment was valued at USD 269.38 million in 2024 and showed a gradual increase during the forecast period.
Get Free Sample

Regional Analysis

North America is estimated to contribute 34.6% to the growth of the global market during the forecast period.Technavio’s analysts have elaborately explained the regional trends and drivers that shape the market during the forecast period.
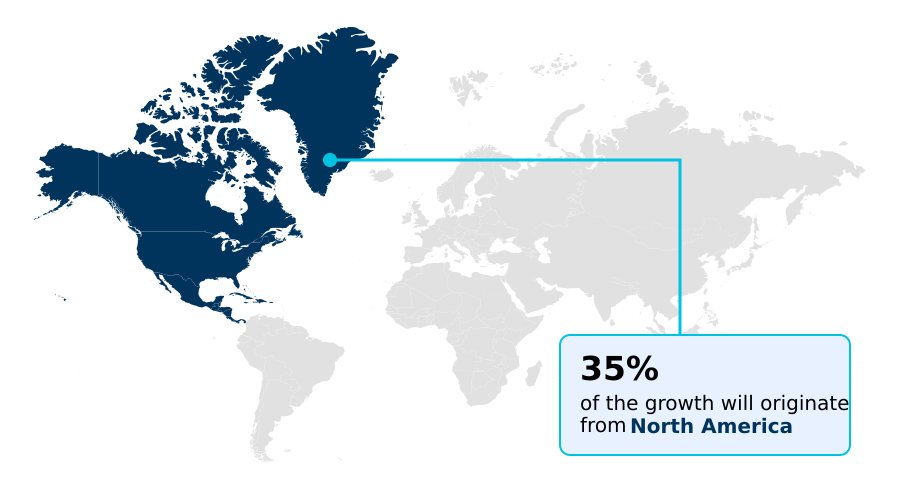
See How Sram And Rom Design Ip Market Demand is Rising in North America Get Free Sample

Regional adoption of SRAM And ROM Design IP varies drastically based on localized manufacturing capabilities and industrial technology mandates.

Operations across APAC demonstrate intense silicon integration, leveraging fin field-effect transistor structures to achieve a 20% higher footprint of on-die buffer circuits compared to Europe.

Conversely, North America leads in adopting advanced gate-all-around transistor nodes, utilizing robust semiconductor intellectual property portfolios to yield a 15% improvement in processing latency for edge artificial intelligence hardware.

These structural differences inform distinct supply chain adjustments; while APAC prioritizes massive cloud data centre networking infrastructure, European manufacturers mandate rigorous ultra-low-leakage bitcells specifically for electric vehicle powertrain management platforms.

Furthermore, the targeted deployment of bipolar complementary metal-oxide-semiconductor technologies in North America supports a 12% faster rollout of fifth-generation telecommunication infrastructure by optimizing high-frequency signal reliability.

Market Dynamics

Our researchers analyzed the data with 2025 as the base year, along with the key drivers, trends, and challenges. A holistic analysis of drivers will help companies refine their marketing strategies to gain a competitive advantage.

  • The strategic deployment of SRAM And ROM Design IP is critical for overcoming contemporary architectural bottlenecks in advanced semiconductor processing. As system-on-chip complexity escalates, organizations are heavily prioritizing embedded cache hierarchies for microprocessors to prevent data starvation across highly parallel execution engines.
  • This prioritization enables supply chain managers to streamline procurement by consolidating multi-chip requirements into singular, highly integrated dies, reducing external component dependency by approximately 18% compared to legacy architectures. Achieving these efficiencies requires rigorous ultra-low-leakage memory instances optimization to ensure prolonged battery life across mobile electronics and remote sensor networks.
  • Furthermore, in mission-critical applications such as autonomous navigation and aerospace computing, deploying error-correcting code logic implementation is paramount to mitigate soft errors and guarantee functional safety standards. To balance intense computing demands with thermal constraints, design teams leverage a split-rail power gating network, which isolates active processing zones from standby memory blocks to minimize unnecessary power draw.
  • Simultaneously, establishing immutable firmware storage security solutions ensures that foundational boot routines and cryptographic keys remain resistant to unauthorized tampering or physical extraction. Together, these interconnected methodologies enable foundry operators to achieve optimal operational planning, reducing wafer iteration cycles while enhancing total systemic reliability across diverse computing environments.
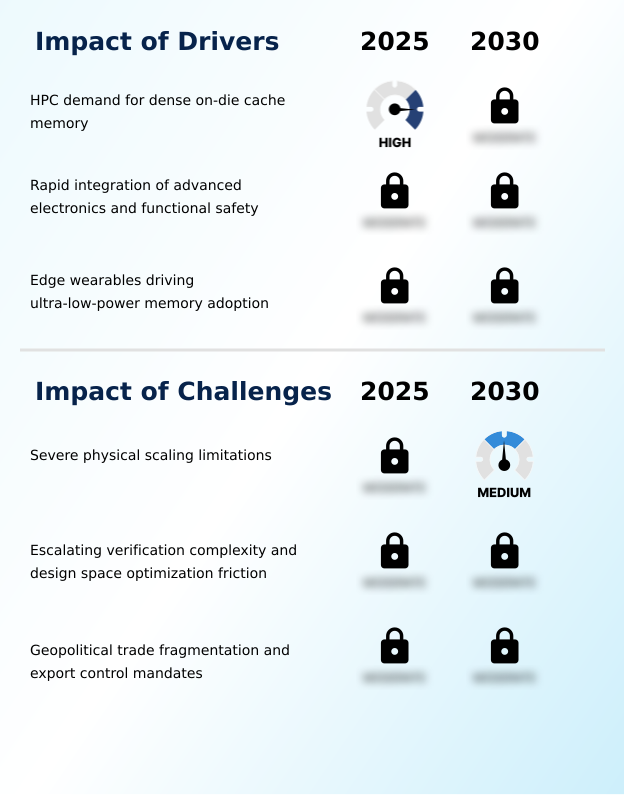
What are the key market drivers leading to the rise in the adoption of Sram And Rom Design Ip Industry?

  • Sustained demand for dense on-die cache memory across high-performance computing infrastructure acts as a primary catalyst accelerating industry expansion.

  • The aggressive expansion of parallel processing cores across cloud and edge platforms serves as the primary catalyst for expanding SRAM And ROM Design IP utilization.
  • Because advanced neural processing units require immense data bandwidth, system architects integrate massive multi-megabit embedded cache hierarchies to bypass off-chip latency barriers. This immediate memory proximity enables operators to boost real-time analytical speeds by 25%.
  • Furthermore, the simultaneous demand for robust secure boot sequences across distributed internet-of-things sensors compels developers to embed cryptographic initialization keys directly into unalterable immutable firmware storage. By executing this hardware-level security, manufacturers reduce remote network vulnerabilities by 30%.
  • This integrated deployment also relies on sophisticated error-correcting code logic and integrated built-in self-test controllers, driving a 20% enhancement in reliability specifically for mission-critical advanced driver-assistance systems.

What are the market trends shaping the Sram And Rom Design Ip Industry?

  • The transition toward domain-specific accelerator architectures constitutes a defining structural trend within the industry. This evolution mandates advanced cache integration to support increasingly complex processing workloads.

  • The structural shift toward domain-specific processing architectures fundamentally dictates the evolving implementation of SRAM And ROM Design IP. As legacy processors yield to heterogeneous packaging structures, engineering teams depend on dynamic word-length parameterization to mitigate physical layout optimization challenges.
  • This realignment substantially alters manufacturing efficiency; enterprises utilizing modular multi-die memory tiles experience a 22% improvement in overall data throughput and a 15% reduction in component footprint. Because autonomous driving capabilities require flawless real-time responsiveness, incorporating robust static random-access memory arrays ensures that vehicles maintain extreme dynamic range operation without thermal throttling.
  • Consequently, developers deploying these parameter-driven cache arrays accelerate their inter-die security authentication protocols by 18%, significantly lowering hardware verification overhead. The strategic utilization of sub-threshold supply voltages subsequently guarantees prolonged operational longevity across distributed edge sensor networks.

What challenges does the Sram And Rom Design Ip Industry face during its growth?

  • Severe physical scaling limitations at advanced transistor nodes present a significant structural challenge inhibiting broader component optimization.

  • The stagnation of physical scaling at microscopic process nodes creates a formidable structural challenge for SRAM And ROM Design IP implementation. As geometries shrink beneath silicon exposure limit ceilings, extreme quantum tunnelling leakage degrades signal integrity, forcing memory blocks to consume a disproportionately large area of the integrated circuit.
  • This discrepancy escalates manufacturing complexity, driving a 25% increase in verification overhead as developers wrestle with severe parasitic extraction difficulty. Because architects must mandate redundant bitcell repair circuits to stabilize base yields, overall dynamic power dissipation rises by approximately 15% during standard operations.
  • Consequently, engineers face intense pressure balancing strict power-performance-area trade-offs across disparate foundry process design kits, leading to a 12% delay in signoff timelines as dynamic voltage drop management continually complicates tape-out precision.

Exclusive Technavio Analysis on Customer Landscape

The sram and rom design ip market forecasting report includes the adoption lifecycle of the market, covering from the innovator’s stage to the laggard’s stage. It focuses on adoption rates in different regions based on penetration. Furthermore, the sram and rom design ip market report also includes key purchase criteria and drivers of price sensitivity to help companies evaluate and develop their market growth analysis strategies.
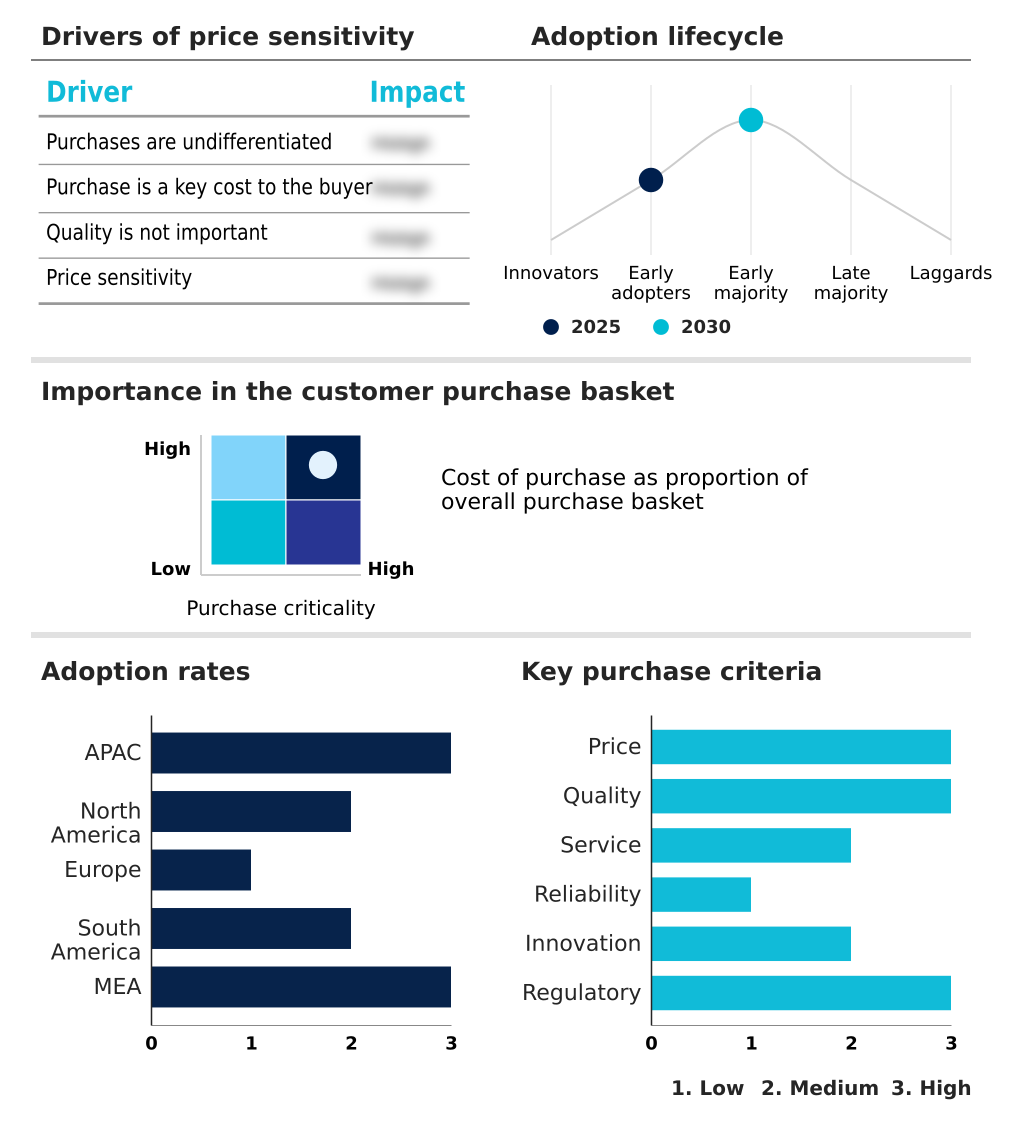
Customer Landscape of Sram And Rom Design Ip Industry

Competitive Landscape

Companies are implementing various strategies, such as strategic alliances, sram and rom design ip market forecast, partnerships, mergers and acquisitions, geographical expansion, and product/service launches, to enhance their presence in the industry.

ams OSRAM AG - The portfolio encompasses advanced memory compilers, customized foundational logic structures, and secure initialization architectures optimized for high-performance computing, providing robust intellectual property configurations tailored for modern transistor nodes.

The industry research and growth report includes detailed analyses of the competitive landscape of the market and information about key companies, including:

  • ams OSRAM AG
  • Analog Bits Inc.
  • Arm Ltd.
  • ATOP Semiconductor Co. Ltd.
  • Dolphin Design SAS
  • DXCorr
  • eMemory Technology Inc.
  • Faraday Technology Corp.
  • GlobalFoundaries Inc.
  • M31 Technology Corp.
  • NSCore Inc.
  • PUFsecurity Corp.
  • Samsung Electronics Co. Ltd.
  • Silvaco Inc.
  • SMIC
  • Surecore Ltd.
  • Synopsys Inc.
  • Taiwan Semiconductor Co. Ltd.
  • Tekmos Inc.
  • Tower Semiconductor Ltd.
  • United Microelectronics Corp.
  • VeriSilicon Microelectronics Co.
  • Yield Microelectronics Corp.

Qualitative and quantitative analysis of companies has been conducted to help clients understand the wider business environment as well as the strengths and weaknesses of key industry players. Data is qualitatively analyzed to categorize companies as pure play, category-focused, industry-focused, and diversified; it is quantitatively analyzed to categorize companies as dominant, leading, strong, tentative, and weak.

Recent Development and News in Sram and rom design ip market

  • In the Semiconductors industry, the rapid deployment of autonomous driving capabilities and advanced driver-assistance systems requires compliance with ISO 26262 ASIL-D standards, directly impacting SRAM And ROM Design IP demand by accelerating the adoption of specialized memory architectures to achieve a 20% improvement in fault tolerance.
  • The continuous transition toward complex multi-die memory tiles and advanced manufacturing footprints demands extreme physical layout optimization, pushing SRAM And ROM Design IP licensing volumes up by driving a 30% reliance increase on pre-verified embedded cache structures.
  • Surging investments in fifth-generation telecommunication infrastructure across APAC necessitate high-speed parallel processing integration, amplifying SRAM And ROM Design IP utilization to mitigate dynamic power dissipation issues by utilizing specialized power-gating techniques yielding 15% better efficiency.
  • Rising cyber threat landscapes across edge artificial intelligence hardware have established stringent hardware-level authentication mandates like the EU Cyber Resilience Act, accelerating SRAM And ROM Design IP adoption to secure permanent cryptographic keys and boost system-level integrity by 25%.

Dive into Technavio’s robust research methodology, blending expert interviews, extensive data synthesis, and validated models for unparalleled Sram And Rom Design Ip Market insights. See full methodology.

Market Scope
Page number 294
Base year 2025
Historic period 2020-2024
Forecast period 2026-2030
Growth momentum & CAGR Accelerate at a CAGR of 1.7%
Market growth 2026-2030 USD 30503.1 thousand
Market structure Fragmented
YoY growth 2025-2026(%) 1.7%
Key countries China, Taiwan, South Korea, Japan, India, Indonesia, US, Canada, Mexico, Germany, UK, France, The Netherlands, Italy, Spain, Brazil, Argentina, Chile, Saudi Arabia, UAE, South Africa, Turkey and Egypt
Competitive landscape Leading Companies, Market Positioning of Companies, Competitive Strategies, and Industry Risks

Request Free Sample

Research Analyst Overview

  • Strategic integration of SRAM And ROM Design IP acts as the pivotal mechanism for advanced computing optimization and secure hardware initialization. The transition toward modular chiplet assemblies and heterogeneous packaging mandates profound shifts in product development strategy, requiring boardroom executives to reallocate engineering budgets toward cross-foundry compiler characterization.
  • By standardizing physical interface protocols and deploying specialized diagnostic memory controllers, enterprise design teams have realized a 30% reduction in physical signoff verification times. This optimization allows architects to tailor low-voltage supply parameters for localized remote sensors, aligning strictly with emerging environmental sustainability and energy efficiency mandates.
  • Furthermore, as physical layout complexity compounds at microscopic transistor nodes, leveraging automated parameterization tools ensures stable memory instance generation without compromising the overall silicon footprint. The adoption of advanced hybrid logic technologies further enhances high-frequency signal integrity, empowering device manufacturers to launch highly differentiated radio-frequency platforms.
  • These structural enhancements guarantee that integrated memory buffers deliver the necessary bandwidth to support next-generation computational frameworks securely and efficiently.

What are the Key Data Covered in this Sram And Rom Design Ip Market Research and Growth Report?

  • What is the expected growth of the Sram And Rom Design Ip Market between 2026 and 2030?

    • USD 30.50 million, at a CAGR of 1.7%

  • What segmentation does the market report cover?

    • The report is segmented by Type (SRAM, and ROM), Application (Consumer electronics, Telecom and networking, and Others), Technology (CMOS, FinFET, SOI, and BiCMOS) and Geography (APAC, North America, Europe, South America, Middle East and Africa)

  • Which regions are analyzed in the report?

    • APAC, North America, Europe, South America and Middle East and Africa

  • What are the key growth drivers and market challenges?

    • HPC demand for dense on-die cache memory, Severe physical scaling limitations

  • Who are the major players in the Sram And Rom Design Ip Market?

    • ams OSRAM AG, Analog Bits Inc., Arm Ltd., ATOP Semiconductor Co. Ltd., Dolphin Design SAS, DXCorr, eMemory Technology Inc., Faraday Technology Corp., GlobalFoundaries Inc., M31 Technology Corp., NSCore Inc., PUFsecurity Corp., Samsung Electronics Co. Ltd., Silvaco Inc., SMIC, Surecore Ltd., Synopsys Inc., Taiwan Semiconductor Co. Ltd., Tekmos Inc., Tower Semiconductor Ltd., United Microelectronics Corp., VeriSilicon Microelectronics Co. and Yield Microelectronics Corp.

Market Research Insights

  • The SRAM And ROM Design IP environment dictates the functional efficiency of modern integrated circuits across global infrastructure and commercial electronics. By leveraging optimized semiconductor configurations, fabless designers have enhanced physical layout parameters, achieving a 30% reduction in static leakage currents. Furthermore, implementing resilient boot sequences through customized read-only blocks improves system-level hardware security verification by 25%.
  • This strategic deployment of compact memory instances allows system architects to bypass critical silicon area constraints, fundamentally increasing factory yield rates by a ratio of 1.4 to 1. These structured performance improvements guarantee reliable execution pathways and stable operation across increasingly demanding thermal environments, driving sustainable hardware optimization.

We can help! Our analysts can customize this sram and rom design ip market research report to meet your requirements.

Get in touch

1. Executive Summary

1.1 Market overview

Executive Summary - Chart on Market Overview
Executive Summary - Data Table on Market Overview
Executive Summary - Chart on Global Market Characteristics
Executive Summary - Chart on Market by Geography
Executive Summary - Chart on Market Segmentation by Type
Executive Summary - Chart on Market Segmentation by Application
Executive Summary - Chart on Market Segmentation by Technology
Executive Summary - Chart on Incremental Growth
Executive Summary - Data Table on Incremental Growth
Executive Summary - Chart on Company Market Positioning

2. Technavio Analysis

2.1 Analysis of price sensitivity, lifecycle, customer purchase basket, adoption rates, and purchase criteria

2.2 Criticality of inputs and Factors of differentiation

Chart on Overview on criticality of inputs and factors of differentiation

2.3 Factors of disruption

Chart on Overview on factors of disruption

2.4 Impact of drivers and challenges

Chart on Impact of drivers and challenges in 2025 and 2030

3. Market Landscape

3.1 Market ecosystem

Chart on Parent Market
Data Table on - Parent Market

3.2 Market characteristics

Chart on Market characteristics analysis

3.3 Value chain analysis

Chart on Value chain analysis

4. Market Sizing

4.1 Market definition

Data Table on Offerings of companies included in the market definition

4.2 Market segment analysis

Market segments

4.3 Market size 2025

4.4 Market outlook: Forecast for 2025-2030

Chart on Global - Market size and forecast 2025-2030 ($ thousand)
Data Table on Global - Market size and forecast 2025-2030 ($ thousand)
Chart on Global Market: Year-over-year growth 2025-2030 (%)
Data Table on Global Market: Year-over-year growth 2025-2030 (%)

5. Historic Market Size

5.1 Global SRAM And ROM Design IP Market 2020 - 2024

Historic Market Size - Data Table on Global SRAM And ROM Design IP Market 2020 - 2024 ($ thousand)

5.2 Type segment analysis 2020 - 2024

Historic Market Size - Type Segment 2020 - 2024 ($ thousand)

5.3 Application segment analysis 2020 - 2024

Historic Market Size - Application Segment 2020 - 2024 ($ thousand)

5.4 Technology segment analysis 2020 - 2024

Historic Market Size - Technology Segment 2020 - 2024 ($ thousand)

5.5 Geography segment analysis 2020 - 2024

Historic Market Size - Geography Segment 2020 - 2024 ($ thousand)

5.6 Country segment analysis 2020 - 2024

Historic Market Size - Country Segment 2020 - 2024 ($ thousand)

6. Qualitative Analysis

6.1 Impact of AI in Global SRAM and ROM Design IP Market

6.2 Impact of Geopolitical Conflicts on Global SRAM and ROM Design IP Market

7. Five Forces Analysis

7.1 Five forces summary

Five forces analysis - Comparison between 2025 and 2030

7.2 Bargaining power of buyers

Bargaining power of buyers - Impact of key factors 2025 and 2030

7.3 Bargaining power of suppliers

Bargaining power of suppliers - Impact of key factors in 2025 and 2030

7.4 Threat of new entrants

Threat of new entrants - Impact of key factors in 2025 and 2030

7.5 Threat of substitutes

Threat of substitutes - Impact of key factors in 2025 and 2030

7.6 Threat of rivalry

Threat of rivalry - Impact of key factors in 2025 and 2030

7.7 Market condition

Chart on Market condition - Five forces 2025 and 2030

8. Market Segmentation by Type

8.1 Market segments

Chart on Type - Market share 2025-2030 (%)
Data Table on Type - Market share 2025-2030 (%)

8.2 Comparison by Type

Chart on Comparison by Type
Data Table on Comparison by Type

8.3 SRAM - Market size and forecast 2025-2030

Chart on SRAM - Market size and forecast 2025-2030 ($ thousand)
Data Table on SRAM - Market size and forecast 2025-2030 ($ thousand)
Chart on SRAM - Year-over-year growth 2025-2030 (%)
Data Table on SRAM - Year-over-year growth 2025-2030 (%)

8.4 ROM - Market size and forecast 2025-2030

Chart on ROM - Market size and forecast 2025-2030 ($ thousand)
Data Table on ROM - Market size and forecast 2025-2030 ($ thousand)
Chart on ROM - Year-over-year growth 2025-2030 (%)
Data Table on ROM - Year-over-year growth 2025-2030 (%)

8.5 Market opportunity by Type

Market opportunity by Type ($ thousand)
Data Table on Market opportunity by Type ($ thousand)

9. Market Segmentation by Application

9.1 Market segments

Chart on Application - Market share 2025-2030 (%)
Data Table on Application - Market share 2025-2030 (%)

9.2 Comparison by Application

Chart on Comparison by Application
Data Table on Comparison by Application

9.3 Consumer electronics - Market size and forecast 2025-2030

Chart on Consumer electronics - Market size and forecast 2025-2030 ($ thousand)
Data Table on Consumer electronics - Market size and forecast 2025-2030 ($ thousand)
Chart on Consumer electronics - Year-over-year growth 2025-2030 (%)
Data Table on Consumer electronics - Year-over-year growth 2025-2030 (%)

9.4 Telecom and networking - Market size and forecast 2025-2030

Chart on Telecom and networking - Market size and forecast 2025-2030 ($ thousand)
Data Table on Telecom and networking - Market size and forecast 2025-2030 ($ thousand)
Chart on Telecom and networking - Year-over-year growth 2025-2030 (%)
Data Table on Telecom and networking - Year-over-year growth 2025-2030 (%)

9.5 Others - Market size and forecast 2025-2030

Chart on Others - Market size and forecast 2025-2030 ($ thousand)
Data Table on Others - Market size and forecast 2025-2030 ($ thousand)
Chart on Others - Year-over-year growth 2025-2030 (%)
Data Table on Others - Year-over-year growth 2025-2030 (%)

9.6 Market opportunity by Application

Market opportunity by Application ($ thousand)
Data Table on Market opportunity by Application ($ thousand)

10. Market Segmentation by Technology

10.1 Market segments

Chart on Technology - Market share 2025-2030 (%)
Data Table on Technology - Market share 2025-2030 (%)

10.2 Comparison by Technology

Chart on Comparison by Technology
Data Table on Comparison by Technology

10.3 CMOS - Market size and forecast 2025-2030

Chart on CMOS - Market size and forecast 2025-2030 ($ thousand)
Data Table on CMOS - Market size and forecast 2025-2030 ($ thousand)
Chart on CMOS - Year-over-year growth 2025-2030 (%)
Data Table on CMOS - Year-over-year growth 2025-2030 (%)

10.4 FinFET - Market size and forecast 2025-2030

Chart on FinFET - Market size and forecast 2025-2030 ($ thousand)
Data Table on FinFET - Market size and forecast 2025-2030 ($ thousand)
Chart on FinFET - Year-over-year growth 2025-2030 (%)
Data Table on FinFET - Year-over-year growth 2025-2030 (%)

10.5 SOI - Market size and forecast 2025-2030

Chart on SOI - Market size and forecast 2025-2030 ($ thousand)
Data Table on SOI - Market size and forecast 2025-2030 ($ thousand)
Chart on SOI - Year-over-year growth 2025-2030 (%)
Data Table on SOI - Year-over-year growth 2025-2030 (%)

10.6 BiCMOS - Market size and forecast 2025-2030

Chart on BiCMOS - Market size and forecast 2025-2030 ($ thousand)
Data Table on BiCMOS - Market size and forecast 2025-2030 ($ thousand)
Chart on BiCMOS - Year-over-year growth 2025-2030 (%)
Data Table on BiCMOS - Year-over-year growth 2025-2030 (%)

10.7 Market opportunity by Technology

Market opportunity by Technology ($ thousand)
Data Table on Market opportunity by Technology ($ thousand)

11. Customer Landscape

11.1 Customer landscape overview

Analysis of price sensitivity, lifecycle, customer purchase basket, adoption rates, and purchase criteria

12. Geographic Landscape

12.1 Geographic segmentation

Chart on Market share by geography 2025-2030 (%)
Data Table on Market share by geography 2025-2030 (%)

12.2 Geographic comparison

Chart on Geographic comparison
Data Table on Geographic comparison

12.3 APAC - Market size and forecast 2025-2030

Chart on APAC - Market size and forecast 2025-2030 ($ thousand)
Data Table on APAC - Market size and forecast 2025-2030 ($ thousand)
Chart on APAC - Year-over-year growth 2025-2030 (%)
Data Table on APAC - Year-over-year growth 2025-2030 (%)
Chart on Regional Comparison - APAC
Data Table on Regional Comparison - APAC

12.3.1 China - Market size and forecast 2025-2030

Chart on China - Market size and forecast 2025-2030 ($ thousand)
Data Table on China - Market size and forecast 2025-2030 ($ thousand)
Chart on China - Year-over-year growth 2025-2030 (%)
Data Table on China - Year-over-year growth 2025-2030 (%)

12.3.2 Taiwan - Market size and forecast 2025-2030

Chart on Taiwan - Market size and forecast 2025-2030 ($ thousand)
Data Table on Taiwan - Market size and forecast 2025-2030 ($ thousand)
Chart on Taiwan - Year-over-year growth 2025-2030 (%)
Data Table on Taiwan - Year-over-year growth 2025-2030 (%)

12.3.3 South Korea - Market size and forecast 2025-2030

Chart on South Korea - Market size and forecast 2025-2030 ($ thousand)
Data Table on South Korea - Market size and forecast 2025-2030 ($ thousand)
Chart on South Korea - Year-over-year growth 2025-2030 (%)
Data Table on South Korea - Year-over-year growth 2025-2030 (%)

12.3.4 Japan - Market size and forecast 2025-2030

Chart on Japan - Market size and forecast 2025-2030 ($ thousand)
Data Table on Japan - Market size and forecast 2025-2030 ($ thousand)
Chart on Japan - Year-over-year growth 2025-2030 (%)
Data Table on Japan - Year-over-year growth 2025-2030 (%)

12.3.5 India - Market size and forecast 2025-2030

Chart on India - Market size and forecast 2025-2030 ($ thousand)
Data Table on India - Market size and forecast 2025-2030 ($ thousand)
Chart on India - Year-over-year growth 2025-2030 (%)
Data Table on India - Year-over-year growth 2025-2030 (%)

12.3.6 Indonesia - Market size and forecast 2025-2030

Chart on Indonesia - Market size and forecast 2025-2030 ($ thousand)
Data Table on Indonesia - Market size and forecast 2025-2030 ($ thousand)
Chart on Indonesia - Year-over-year growth 2025-2030 (%)
Data Table on Indonesia - Year-over-year growth 2025-2030 (%)

12.4 North America - Market size and forecast 2025-2030

Chart on North America - Market size and forecast 2025-2030 ($ thousand)
Data Table on North America - Market size and forecast 2025-2030 ($ thousand)
Chart on North America - Year-over-year growth 2025-2030 (%)
Data Table on North America - Year-over-year growth 2025-2030 (%)
Chart on Regional Comparison - North America
Data Table on Regional Comparison - North America

12.4.1 US - Market size and forecast 2025-2030

Chart on US - Market size and forecast 2025-2030 ($ thousand)
Data Table on US - Market size and forecast 2025-2030 ($ thousand)
Chart on US - Year-over-year growth 2025-2030 (%)
Data Table on US - Year-over-year growth 2025-2030 (%)

12.4.2 Canada - Market size and forecast 2025-2030

Chart on Canada - Market size and forecast 2025-2030 ($ thousand)
Data Table on Canada - Market size and forecast 2025-2030 ($ thousand)
Chart on Canada - Year-over-year growth 2025-2030 (%)
Data Table on Canada - Year-over-year growth 2025-2030 (%)

12.4.3 Mexico - Market size and forecast 2025-2030

Chart on Mexico - Market size and forecast 2025-2030 ($ thousand)
Data Table on Mexico - Market size and forecast 2025-2030 ($ thousand)
Chart on Mexico - Year-over-year growth 2025-2030 (%)
Data Table on Mexico - Year-over-year growth 2025-2030 (%)

12.5 Europe - Market size and forecast 2025-2030

Chart on Europe - Market size and forecast 2025-2030 ($ thousand)
Data Table on Europe - Market size and forecast 2025-2030 ($ thousand)
Chart on Europe - Year-over-year growth 2025-2030 (%)
Data Table on Europe - Year-over-year growth 2025-2030 (%)
Chart on Regional Comparison - Europe
Data Table on Regional Comparison - Europe

12.5.1 Germany - Market size and forecast 2025-2030

Chart on Germany - Market size and forecast 2025-2030 ($ thousand)
Data Table on Germany - Market size and forecast 2025-2030 ($ thousand)
Chart on Germany - Year-over-year growth 2025-2030 (%)
Data Table on Germany - Year-over-year growth 2025-2030 (%)

12.5.2 UK - Market size and forecast 2025-2030

Chart on UK - Market size and forecast 2025-2030 ($ thousand)
Data Table on UK - Market size and forecast 2025-2030 ($ thousand)
Chart on UK - Year-over-year growth 2025-2030 (%)
Data Table on UK - Year-over-year growth 2025-2030 (%)

12.5.3 France - Market size and forecast 2025-2030

Chart on France - Market size and forecast 2025-2030 ($ thousand)
Data Table on France - Market size and forecast 2025-2030 ($ thousand)
Chart on France - Year-over-year growth 2025-2030 (%)
Data Table on France - Year-over-year growth 2025-2030 (%)

12.5.4 The Netherlands - Market size and forecast 2025-2030

Chart on The Netherlands - Market size and forecast 2025-2030 ($ thousand)
Data Table on The Netherlands - Market size and forecast 2025-2030 ($ thousand)
Chart on The Netherlands - Year-over-year growth 2025-2030 (%)
Data Table on The Netherlands - Year-over-year growth 2025-2030 (%)

12.5.5 Italy - Market size and forecast 2025-2030

Chart on Italy - Market size and forecast 2025-2030 ($ thousand)
Data Table on Italy - Market size and forecast 2025-2030 ($ thousand)
Chart on Italy - Year-over-year growth 2025-2030 (%)
Data Table on Italy - Year-over-year growth 2025-2030 (%)

12.5.6 Spain - Market size and forecast 2025-2030

Chart on Spain - Market size and forecast 2025-2030 ($ thousand)
Data Table on Spain - Market size and forecast 2025-2030 ($ thousand)
Chart on Spain - Year-over-year growth 2025-2030 (%)
Data Table on Spain - Year-over-year growth 2025-2030 (%)

12.6 South America - Market size and forecast 2025-2030

Chart on South America - Market size and forecast 2025-2030 ($ thousand)
Data Table on South America - Market size and forecast 2025-2030 ($ thousand)
Chart on South America - Year-over-year growth 2025-2030 (%)
Data Table on South America - Year-over-year growth 2025-2030 (%)
Chart on Regional Comparison - South America
Data Table on Regional Comparison - South America

12.6.1 Brazil - Market size and forecast 2025-2030

Chart on Brazil - Market size and forecast 2025-2030 ($ thousand)
Data Table on Brazil - Market size and forecast 2025-2030 ($ thousand)
Chart on Brazil - Year-over-year growth 2025-2030 (%)
Data Table on Brazil - Year-over-year growth 2025-2030 (%)

12.6.2 Argentina - Market size and forecast 2025-2030

Chart on Argentina - Market size and forecast 2025-2030 ($ thousand)
Data Table on Argentina - Market size and forecast 2025-2030 ($ thousand)
Chart on Argentina - Year-over-year growth 2025-2030 (%)
Data Table on Argentina - Year-over-year growth 2025-2030 (%)

12.6.3 Chile - Market size and forecast 2025-2030

Chart on Chile - Market size and forecast 2025-2030 ($ thousand)
Data Table on Chile - Market size and forecast 2025-2030 ($ thousand)
Chart on Chile - Year-over-year growth 2025-2030 (%)
Data Table on Chile - Year-over-year growth 2025-2030 (%)

12.7 Middle East and Africa - Market size and forecast 2025-2030

Chart on Middle East and Africa - Market size and forecast 2025-2030 ($ thousand)
Data Table on Middle East and Africa - Market size and forecast 2025-2030 ($ thousand)
Chart on Middle East and Africa - Year-over-year growth 2025-2030 (%)
Data Table on Middle East and Africa - Year-over-year growth 2025-2030 (%)
Chart on Regional Comparison - Middle East and Africa
Data Table on Regional Comparison - Middle East and Africa

12.7.1 Saudi Arabia - Market size and forecast 2025-2030

Chart on Saudi Arabia - Market size and forecast 2025-2030 ($ thousand)
Data Table on Saudi Arabia - Market size and forecast 2025-2030 ($ thousand)
Chart on Saudi Arabia - Year-over-year growth 2025-2030 (%)
Data Table on Saudi Arabia - Year-over-year growth 2025-2030 (%)

12.7.2 UAE - Market size and forecast 2025-2030

Chart on UAE - Market size and forecast 2025-2030 ($ thousand)
Data Table on UAE - Market size and forecast 2025-2030 ($ thousand)
Chart on UAE - Year-over-year growth 2025-2030 (%)
Data Table on UAE - Year-over-year growth 2025-2030 (%)

12.7.3 South Africa - Market size and forecast 2025-2030

Chart on South Africa - Market size and forecast 2025-2030 ($ thousand)
Data Table on South Africa - Market size and forecast 2025-2030 ($ thousand)
Chart on South Africa - Year-over-year growth 2025-2030 (%)
Data Table on South Africa - Year-over-year growth 2025-2030 (%)

12.7.4 Turkey - Market size and forecast 2025-2030

Chart on Turkey - Market size and forecast 2025-2030 ($ thousand)
Data Table on Turkey - Market size and forecast 2025-2030 ($ thousand)
Chart on Turkey - Year-over-year growth 2025-2030 (%)
Data Table on Turkey - Year-over-year growth 2025-2030 (%)

12.7.5 Egypt - Market size and forecast 2025-2030

Chart on Egypt - Market size and forecast 2025-2030 ($ thousand)
Data Table on Egypt - Market size and forecast 2025-2030 ($ thousand)
Chart on Egypt - Year-over-year growth 2025-2030 (%)
Data Table on Egypt - Year-over-year growth 2025-2030 (%)

12.8 Market opportunity by geography

Market opportunity by geography ($ thousand)
Data Tables on Market opportunity by geography ($ thousand)

13. Drivers, Challenges, and Opportunity

13.1 Market drivers

HPC demand for dense on-die cache memory
Rapid integration of advanced electronics and functional safety
Edge wearables driving ultra-low-power memory adoption

13.2 Market challenges

Severe physical scaling limitations
Escalating verification complexity and design space optimization friction
Geopolitical trade fragmentation and export control mandates

13.3 Impact of drivers and challenges

Impact of drivers and challenges in 2025 and 2030

13.4 Market opportunities

Shift toward domain-specific accelerator architectures
AI-driven memory compiler optimization
Chiplet architectures reshaping embedded memory IP

14. Competitive Landscape

14.1 Overview

14.2

Overview on criticality of inputs and factors of differentiation

14.3 Landscape disruption

Overview on factors of disruption

14.4 Industry risks

Impact of key risks on business

15. Competitive Analysis

15.1 Companies profiled

Companies covered

15.2 Company ranking index

15.3 Market positioning of companies

Matrix on companies position and classification

15.4 ams OSRAM AG

ams OSRAM AG - Overview
ams OSRAM AG - Business segments
ams OSRAM AG - Key news
ams OSRAM AG - Key offerings
ams OSRAM AG - Segment focus
SWOT

15.5 Arm Ltd.

Arm Ltd. - Overview
Arm Ltd. - Product / Service
Arm Ltd. - Key offerings
SWOT

15.6 ATOP Semiconductor Co. Ltd.

ATOP Semiconductor Co. Ltd. - Overview
ATOP Semiconductor Co. Ltd. - Product / Service
ATOP Semiconductor Co. Ltd. - Key offerings
SWOT

15.7 Dolphin Design SAS

Dolphin Design SAS - Overview
Dolphin Design SAS - Product / Service
Dolphin Design SAS - Key offerings
SWOT

15.8 Faraday Technology Corp.

Faraday Technology Corp. - Overview
Faraday Technology Corp. - Product / Service
Faraday Technology Corp. - Key offerings
SWOT

15.9 GlobalFoundaries Inc.

GlobalFoundaries Inc. - Overview
GlobalFoundaries Inc. - Product / Service
GlobalFoundaries Inc. - Key offerings
SWOT

15.10 Samsung Electronics Co. Ltd.

Samsung Electronics Co. Ltd. - Overview
Samsung Electronics Co. Ltd. - Business segments
Samsung Electronics Co. Ltd. - Key news
Samsung Electronics Co. Ltd. - Key offerings
Samsung Electronics Co. Ltd. - Segment focus
SWOT

15.11 Silvaco Inc.

Silvaco Inc. - Overview
Silvaco Inc. - Product / Service
Silvaco Inc. - Key offerings
SWOT

15.12 SMIC

SMIC - Overview
SMIC - Product / Service
SMIC - Key offerings
SWOT

15.13 Synopsys Inc.

Synopsys Inc. - Overview
Synopsys Inc. - Business segments
Synopsys Inc. - Key news
Synopsys Inc. - Key offerings
Synopsys Inc. - Segment focus
SWOT

15.14 Taiwan Semiconductor Co. Ltd.

Taiwan Semiconductor Co. Ltd. - Overview
Taiwan Semiconductor Co. Ltd. - Product / Service
Taiwan Semiconductor Co. Ltd. - Key news
Taiwan Semiconductor Co. Ltd. - Key offerings
SWOT

15.15 Tower Semiconductor Ltd.

Tower Semiconductor Ltd. - Overview
Tower Semiconductor Ltd. - Product / Service
Tower Semiconductor Ltd. - Key offerings
SWOT

15.16 United Microelectronics Corp.

United Microelectronics Corp. - Overview
United Microelectronics Corp. - Product / Service
United Microelectronics Corp. - Key offerings
SWOT

15.17 VeriSilicon Microelectronics Co.

VeriSilicon Microelectronics Co. - Overview
VeriSilicon Microelectronics Co. - Business segments
VeriSilicon Microelectronics Co. - Key offerings
VeriSilicon Microelectronics Co. - Segment focus
SWOT

15.18 Yield Microelectronics Corp.

Yield Microelectronics Corp. - Overview
Yield Microelectronics Corp. - Product / Service
Yield Microelectronics Corp. - Key offerings
SWOT

16. Appendix

16.1 Scope of the report

Market definition
Objectives
Notes and caveats

16.2 Inclusions and exclusions checklist

Inclusions checklist
Exclusions checklist

16.3 Currency conversion rates for US$

16.4 Research methodology

16.5 Data procurement

Information sources

16.6 Data validation

16.7 Validation techniques employed for market sizing

16.8 Data synthesis

16.9 360 degree market analysis

16.10 List of abbreviations

Research Methodology

Technavio presents a detailed picture of the market by way of study, synthesis, and summation of data from multiple sources. The analysts have presented the various facets of the market with a particular focus on identifying the key industry influencers. The data thus presented is comprehensive, reliable, and the result of extensive research, both primary and secondary.

INFORMATION SOURCES

Primary sources

  • Manufacturers and suppliers
  • Channel partners
  • Industry experts
  • Strategic decision makers

Secondary sources

  • Industry journals and periodicals
  • Government data
  • Financial reports of key industry players
  • Historical data
  • Press releases

DATA ANALYSIS

Data Synthesis

  • Collation of data
  • Estimation of key figures
  • Analysis of derived insights

Data Validation

  • Triangulation with data models
  • Reference against proprietary databases
  • Corroboration with industry experts

REPORT WRITING

Qualitative

  • Market drivers
  • Market challenges
  • Market trends
  • Five forces analysis

Quantitative

  • Market size and forecast
  • Market segmentation
  • Geographical insights
  • Competitive landscape

Interested in this report?

Get your sample now to see our research methodology and insights!

Download Now

Frequently Asked Questions

Sram And Rom Design Ip market growth will increase by USD 30503.1 thousand thousand during 2026-2030.

The Sram And Rom Design Ip market is expected to grow at a CAGR of 1.7% during 2026-2030.

Sram And Rom Design Ip market is segmented by Type (SRAM, ROM) Application (Consumer electronics, Telecom and networking, Others) Technology (CMOS, FinFET, SOI, BiCMOS)

ams OSRAM AG, Analog Bits Inc., Arm Ltd., ATOP Semiconductor Co. Ltd., Dolphin Design SAS, DXCorr, eMemory Technology Inc., Faraday Technology Corp., GlobalFoundaries Inc., M31 Technology Corp., NSCore Inc., PUFsecurity Corp., Samsung Electronics Co. Ltd., Silvaco Inc., SMIC, Surecore Ltd., Synopsys Inc., Taiwan Semiconductor Co. Ltd., Tekmos Inc., Tower Semiconductor Ltd., United Microelectronics Corp., VeriSilicon Microelectronics Co., Yield Microelectronics Corp. are a few of the key vendors in the Sram And Rom Design Ip market.

North America will register the highest growth rate of 34.6% among the other regions. Therefore, the Sram And Rom Design Ip market in North America is expected to garner significant business opportunities for the vendors during the forecast period.

China, Taiwan, South Korea, Japan, India, Indonesia, US, Canada, Mexico, Germany, UK, France, The Netherlands, Italy, Spain, Brazil, Argentina, Chile, Saudi Arabia, UAE, South Africa, Turkey, Egypt

  • HPC demand for dense on-die cache memory is the driving factor this market.

The Sram And Rom Design Ip market vendors should focus on grabbing business opportunities from the Type segment as it accounted for the largest market share in the base year.
RIA - Research AI Assistant
Ask RIA
