
Stainless Steel Market Analysis, Size, and Forecast 2026-2030: APAC (China, India, and Japan), Europe (Germany, Italy, and France), North America (US, Mexico, and Canada), Middle East and Africa (Saudi Arabia, UAE, and South Africa), South America (Brazil, Argentina, and Chile), and Rest of World (ROW)

Stainless Steel Market Analysis, Size, and Forecast 2026-2030:
APAC (China, India, and Japan), Europe (Germany, Italy, and France), North America (US, Mexico, and Canada), Middle East and Africa (Saudi Arabia, UAE, and South Africa), South America (Brazil, Argentina, and Chile), and Rest of World (ROW)

Published: Oct 2026 318 Pages SKU: IRTNTR71876

Market Overview at a Glance

$50.27 B
Market Opportunity
5.4%
CAGR 2025 - 2030
77.2%
APAC Growth
$119.09 B
Flat segment 2024

Stainless Steel Market Size 2026-2030

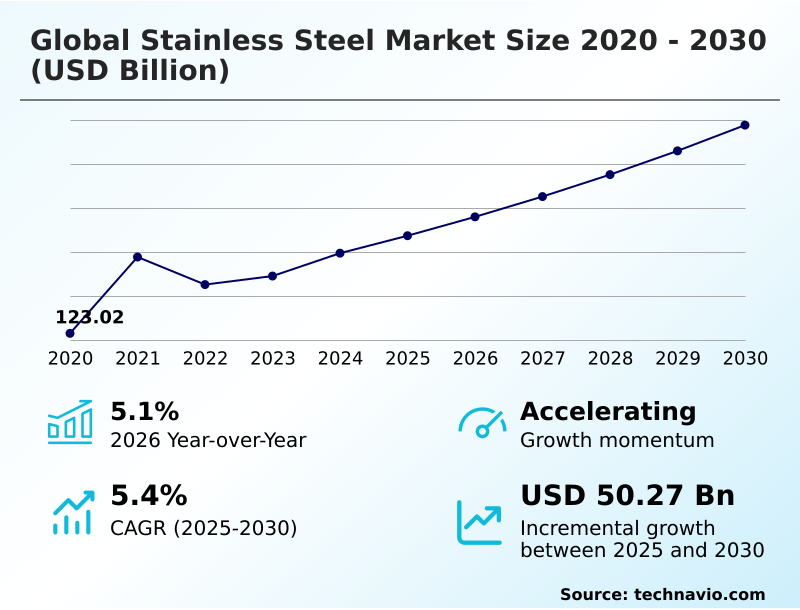
The stainless steel market size is valued to increase by USD 50.27 billion, at a CAGR of 5.4% from 2025 to 2030. Accelerated urbanization and infrastructure development will drive the stainless steel market.

Major Market Trends & Insights

  • APAC dominated the market and accounted for a 77.2% growth during the forecast period.
  • By Product - Flat segment was valued at USD 119.09 billion in 2024
  • By End-user - Metal products segment accounted for the largest market revenue share in 2024

Market Size & Forecast

  • Market Opportunities: USD 94.65 billion
  • Market Future Opportunities: USD 50.27 billion
  • CAGR from 2025 to 2030 : 5.4%

Market Summary

  • The Stainless Steel Market demonstrates robust expansion driven by extensive industrialization and the need for resilient infrastructure. Accelerated urbanization serves as a primary driver, compelling construction firms to utilize high tensile strength reinforcement for longevity in structural designs. Conversely, extreme volatility in geopolitical raw material volatility presents a formidable challenge that disrupts production forecasting and elevates operational costs.
  • To mitigate these risks, manufacturers increasingly integrate predictive maintenance algorithms within electric arc furnace melting operations, ensuring consistent output and resource efficiency. The transition toward circular economy principles has led to advanced scrap metal utilization, lowering overall energy consumption during alloy synthesis. Facilities adopting these sustainable manufacturing practices report a 20% improvement in energy efficiency compared to traditional smelting operations.
  • Furthermore, the rising demand for green hydrogen storage infrastructure necessitates alloys with exceptional hydrogen embrittlement resistance. The continuous optimization of austenitic grade metallurgy ensures that structural integrity optimization requirements are met across the automotive, medical, and aerospace sectors.

What will be the Size of the Stainless Steel Market during the forecast period?
Get Key Insights on Market Forecast (PDF) Get Free Sample

How is the Stainless Steel Market Segmented?

The stainless steel industry research report provides comprehensive data (region-wise segment analysis), with forecasts and estimates in "USD million" for the period 2026-2030, as well as historical data from 2020-2024 for the following segments.

  • Product
    • Flat
    • Long
  • End-user
    • Metal products
    • Mechanical engineering
    • Infrastructure and construction
    • Automobile and transportation
    • Electrical engineering
  • Grade type
    • Austenitic
    • Ferritic
    • Duplex
    • Martensitic
    • Others
  • Geography
    • APAC
      • China
      • India
      • Japan
      • South Korea
      • Taiwan
      • Indonesia
    • Europe
      • Germany
      • Italy
      • France
      • Spain
      • UK
      • The Netherlands
    • North America
      • US
      • Mexico
      • Canada
    • Middle East and Africa
      • Saudi Arabia
      • UAE
      • South Africa
      • Egypt
      • Turkey
    • South America
      • Brazil
      • Argentina
      • Chile

By Product Insights

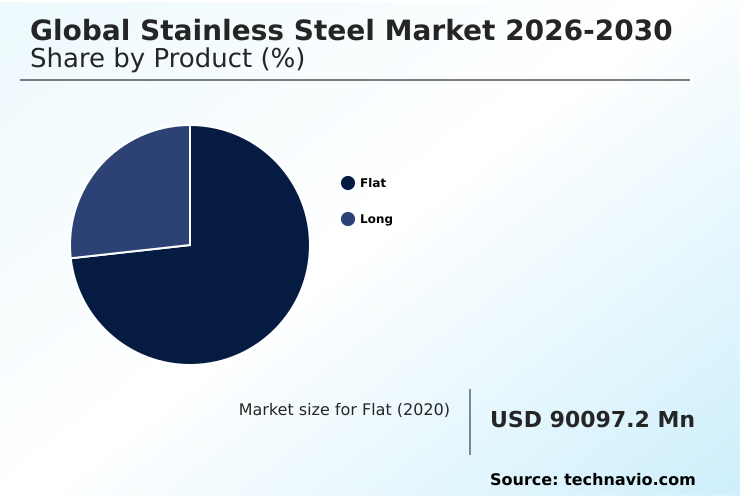
The flat segment is estimated to witness significant growth during the forecast period.

The flat product division dictates manufacturing workflows, providing essential components for automotive, appliance, and architectural applications. Austenitic grade metallurgy and cold rolled flat strips offer superior formability and aesthetic finish, meeting rigorous structural integrity optimization requirements.

Manufacturers utilizing argon oxygen decarburization processes achieve precise chemical compositions that enhance stress corrosion cracking resistance. Incorporating these advanced materials leads to a 15% reduction in lifecycle maintenance costs for civil infrastructure projects.

As industries adopt circular economy principles, the high recyclability of these materials supports decarbonization transition goals.

Businesses leverage predictive maintenance algorithms during the rolling process to minimize defects, ensuring consistent quality for high pressure piping systems and robust aerospace precision engineering applications.
Get Free Sample

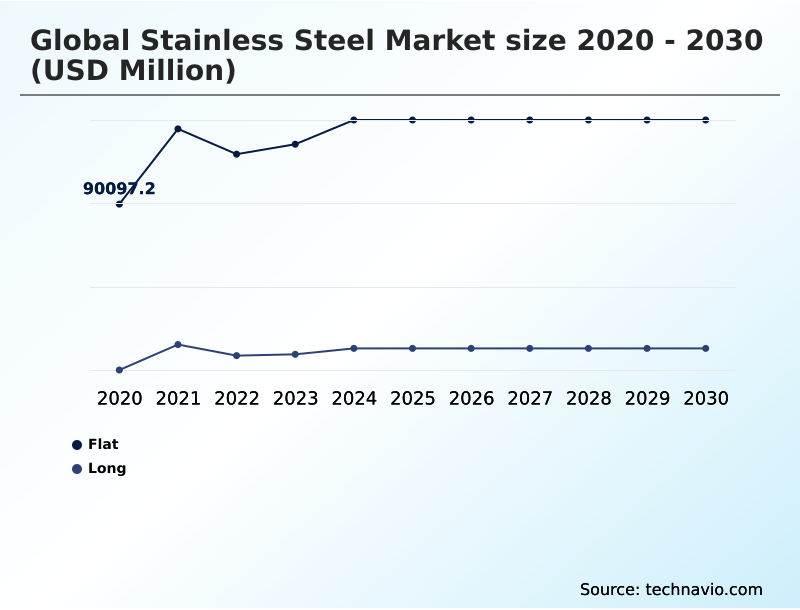
The Flat segment was valued at USD 119.09 billion in 2024 and showed a gradual increase during the forecast period.
Get Free Sample

Regional Analysis

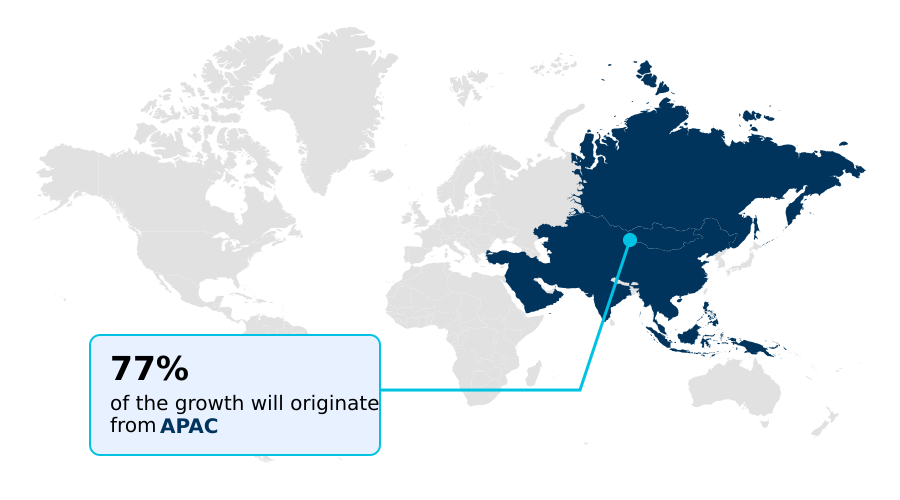
APAC is estimated to contribute 77.2% to the growth of the global market during the forecast period.Technavio’s analysts have elaborately explained the regional trends and drivers that shape the market during the forecast period.
See How Stainless Steel Market Demand is Rising in APAC Get Free Sample

The Stainless Steel Market exhibits distinct regional variations driven by industrial maturation and infrastructure modernization. APAC dominates consumption, fueled by extensive sustainable urban infrastructure projects, while Europe leads in strict decarbonization transition mandates.

Facilities in APAC demonstrate a 25% higher adoption rate of heavy duty industrial pumps for chemical processing compared to their European counterparts, capitalizing on localized manufacturing hubs.

Conversely, European producers achieve a 30% reduction in carbon emissions by prioritizing circular economy principles and advanced scrap metal utilization over primary ore extraction. This regulatory alignment improves supply chain transparency and lowers compliance costs by 15% across European borders.

In North America, the focus shifts toward aerospace precision engineering, demanding specialized alloys with superior thermal fatigue resistance. Regional adaptations highlight how businesses optimize their electric arc furnace melting operations to meet localized regulatory and industrial performance standards.

Market Dynamics

Our researchers analyzed the data with 2025 as the base year, along with the key drivers, trends, and challenges. A holistic analysis of drivers will help companies refine their marketing strategies to gain a competitive advantage.

  • The continuous evolution of the Stainless Steel Market reflects an increasing reliance on specialized metallurgy across diverse industrial applications. Manufacturers consistently deploy high strength duplex sheet applications to satisfy the rigorous structural requirements of offshore transport installations and chemical processing plants.
  • As urban architecture prioritizes both durability and aesthetics, the integration of corrosion resistant architectural facade panels has become a standard practice, reducing long-term exterior maintenance expenditures. In the transportation sector, automotive engineers address strict emission and performance standards by mitigating ferritic exhaust system thermal fatigue, ensuring prolonged component lifecycles under extreme operational conditions.
  • Similarly, the aerospace and medical device industries heavily utilize austenitic grade cold rolled strips for their superior formability and biocompatibility. Industrial tool fabricators rely on precise martensitic alloy edge retention processing to produce high-performance cutting instruments that maintain sharpness over extended periods.
  • Companies that shift from traditional carbon steel to these advanced alloys typically observe a 40% enhancement in lifecycle durability, directly optimizing long-term procurement budgets. By aligning production strategies with specific end-user demands, metallurgical facilities enhance their operational planning and compliance frameworks.
  • The strategic focus on tailored alloy formulations ensures that critical infrastructure, automotive designs, and precision engineering sectors receive materials uniquely suited for severe environments.
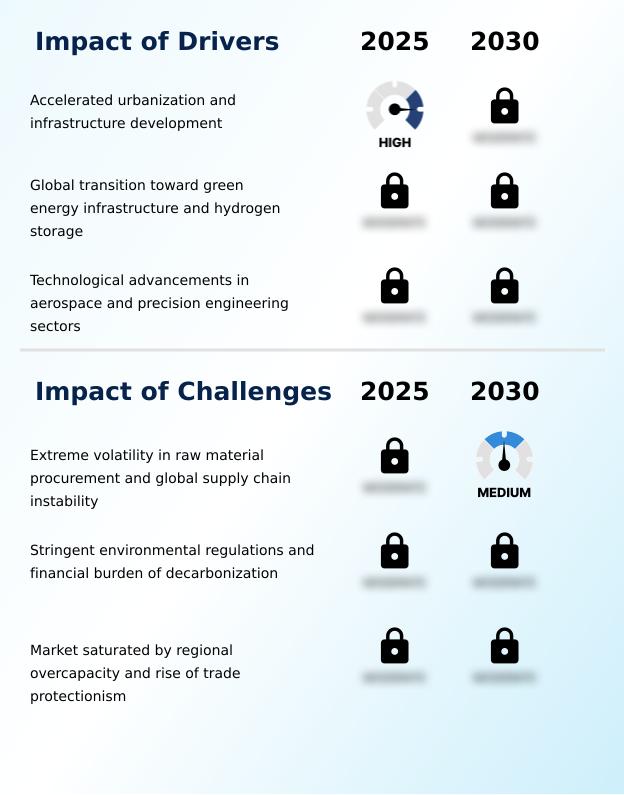
What are the key market drivers leading to the rise in the adoption of Stainless Steel Industry?

  • Accelerated urbanization and infrastructure development serve as the primary drivers propelling market expansion.

  • The transition toward clean energy distribution serves as a primary catalyst accelerating demand within the Stainless Steel Market.
  • Energy companies rapidly deploy green hydrogen storage systems, which require materials exhibiting exceptional hydrogen embrittlement resistance to maintain operational safety under high pressure. Upgrading infrastructure with these specialized alloys lowers system leakage risks and improves energy retention efficiency by 18%.
  • Additionally, the proliferation of electric vehicle battery enclosures drives automotive manufacturers to source lightweight materials, reducing vehicle curb weight by 12% and extending battery range.
  • The necessity for robust flue gas desulfurization units in power plants further compels the use of advanced corrosion resistant properties. These shifting industrial behaviors prioritize long-term asset reliability and environmental compliance over initial material procurement costs.

What are the market trends shaping the Stainless Steel Industry?

  • The integration of circular economy principles through enhanced scrap metal utilization represents an upcoming market trend. This strategic shift promotes sustainable production methodologies while mitigating the volatility of raw material procurement.

  • The rapid adoption of additive manufacturing processes is fundamentally transforming how complex components are fabricated across the Stainless Steel Market. Industrial designers increasingly utilize face centered cubic structure alloys to print intricate parts for aerospace and medical applications, bypassing traditional machining limitations. This innovation improves material yield and reduces prototyping downtime by 35%, significantly accelerating product development cycles.
  • Furthermore, the integration of predictive maintenance algorithms into rolling mill operations minimizes equipment failure, enhancing overall production efficiency by 22%. The shift toward manufacturing components with high electromagnetic shielding enclosures directly supports the expansion of telecommunications infrastructure. By leveraging robotic surgical instrumentation crafted from specialized grades, healthcare facilities achieve greater procedural precision.
  • These technological advancements ensure that sophisticated engineering demands are met with optimized material performance.

What challenges does the Stainless Steel Industry face during its growth?

  • Extreme volatility in raw material procurement and global supply chain instability remain key challenges impeding industry growth.

  • Geopolitical raw material volatility fundamentally disrupts supply chain stability across the Stainless Steel Market. The unpredictable availability of nickel and chromium forces manufacturers to maintain excessive inventories, which inflates holding costs by up to 25% annually. Additionally, strict carbon border adjustments impose heavy financial burdens on producers relying on traditional smelting, increasing cross-border compliance expenses by 15%.
  • Managing micro structural brittleness during the fabrication of complex industrial furnace linings requires precise thermal controls, further elevating production complexity and energy consumption. The reliance on imported minerals for body centered cubic structure alloys exposes domestic manufacturers to sudden price spikes and logistical bottlenecks.
  • These structural limitations compel metallurgical facilities to heavily invest in localized scrap metal utilization to maintain competitive pricing and operational continuity.

Exclusive Technavio Analysis on Customer Landscape

The stainless steel market forecasting report includes the adoption lifecycle of the market, covering from the innovator’s stage to the laggard’s stage. It focuses on adoption rates in different regions based on penetration. Furthermore, the stainless steel market report also includes key purchase criteria and drivers of price sensitivity to help companies evaluate and develop their market growth analysis strategies.
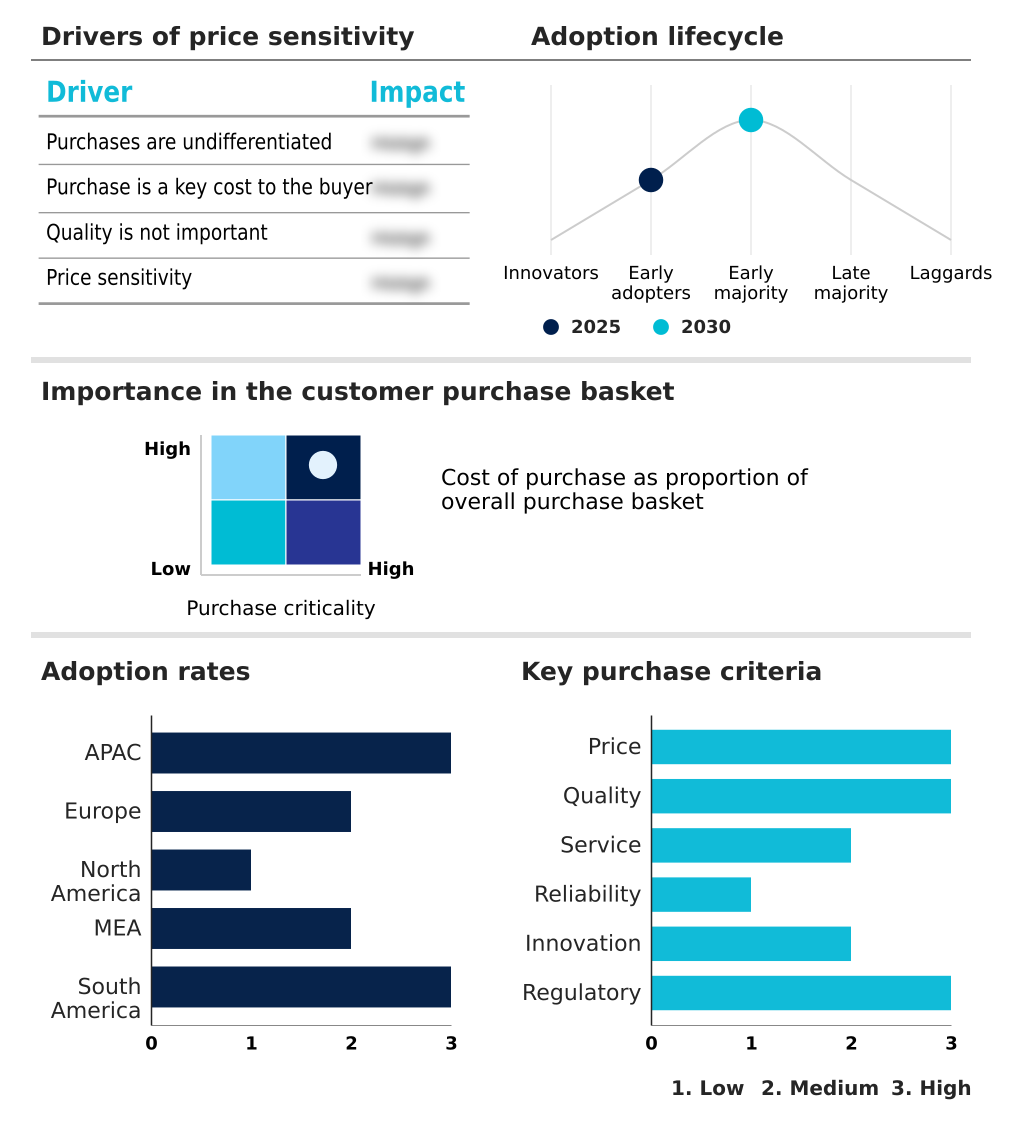
Customer Landscape of Stainless Steel Industry

Competitive Landscape

Companies are implementing various strategies, such as strategic alliances, stainless steel market forecast, partnerships, mergers and acquisitions, geographical expansion, and product/service launches, to enhance their presence in the industry.

Acerinox SA - The vendor provides diverse austenitic and ferritic grade variations, optimizing structural integrity optimization and corrosion resistant properties for demanding industrial, automotive, and construction infrastructure applications globally.

The industry research and growth report includes detailed analyses of the competitive landscape of the market and information about key companies, including:

  • Acerinox SA
  • Aichi Steel Corp.
  • Allegheny Technologies Inc.
  • Alleima AB
  • Ambica Steels Ltd.
  • Aperam SA
  • ArcelorMittal S.A.
  • Carpenter Technology Corp.
  • Cleveland Cliffs Inc.
  • Cogne Acciai S.P.A.
  • Daido Steel Co. Ltd.
  • HBIS Group Co. Ltd.
  • JFE Holdings Inc.
  • Jiangsu Shagang Group
  • Jindal Stainless Ltd.
  • Nippon Steel Corp.
  • Outokumpu Oyj
  • POSCO Co. Ltd.
  • Tubacex SA
  • voestalpine AG

Qualitative and quantitative analysis of companies has been conducted to help clients understand the wider business environment as well as the strengths and weaknesses of key industry players. Data is qualitatively analyzed to categorize companies as pure play, category-focused, industry-focused, and diversified; it is quantitatively analyzed to categorize companies as dominant, leading, strong, tentative, and weak.

Recent Development and News in Stainless steel market

  • In the Steel industry, the implementation of carbon border adjustments enforced strict emission thresholds, directly impacting Stainless Steel demand by accelerating the adoption of scrap metal utilization techniques that reduced baseline production carbon footprints by 25%.
  • The transition toward hydrometallurgical recycling of electric vehicle battery enclosures reshaped raw material availability, increasing secondary nickel recovery rates by 18% and stabilizing geopolitical raw material volatility for downstream alloy producers.
  • The deployment of digital twin simulation across large-scale electric arc furnace melting facilities optimized energy consumption, reducing operational downtime by 12% and enhancing the supply chain transparency of high-grade architectural materials.
  • The expansion of green hydrogen storage infrastructure mandated the use of advanced pipeline networks, pulling demand for specialized alloys with proven hydrogen embrittlement resistance and increasing order volumes for seamless tubular components by 22%.

Dive into Technavio’s robust research methodology, blending expert interviews, extensive data synthesis, and validated models for unparalleled Stainless Steel Market insights. See full methodology.

Market Scope
Page number 318
Base year 2025
Historic period 2020-2024
Forecast period 2026-2030
Growth momentum & CAGR Accelerate at a CAGR of 5.4%
Market growth 2026-2030 USD 50269.5 million
Market structure Fragmented
YoY growth 2025-2026(%) 5.1%
Key countries China, India, Japan, South Korea, Taiwan, Indonesia, Germany, Italy, France, Spain, UK, The Netherlands, US, Mexico, Canada, Saudi Arabia, UAE, South Africa, Egypt, Turkey, Brazil, Argentina and Chile
Competitive landscape Leading Companies, Market Positioning of Companies, Competitive Strategies, and Industry Risks

Request Free Sample

Research Analyst Overview

  • The Stainless Steel Market requires continuous adaptation as structural integrity optimization and environmental compliance reshape industrial procurement strategies. Executive boards increasingly prioritize the integration of super duplex alloy materials into their supply chains to mitigate risks associated with chloride induced pitting in harsh environments.
  • This strategic pivot ensures that critical infrastructure, such as desalination plant hardware, maintains operational continuity under severe saline environmental exposure. By transitioning to high nitrogen alloy formulations, manufacturing facilities have realized a 20% improvement in lifecycle asset durability compared to conventional materials.
  • Decision-makers also heavily leverage argon oxygen decarburization processes to refine chemical compositions, directly supporting stringent quality control mandates in aerospace and medical device production. The emphasis on ferritic crystalline structure optimization enables companies to balance cost-efficiency with essential corrosion resistant properties. Furthermore, adopting precipitation hardening metallurgy facilitates the development of components capable of withstanding extreme mechanical loads.
  • These boardroom-level material selections fundamentally enhance operational resilience, ensuring that engineering projects meet both technical performance specifications and long-term sustainability objectives.

What are the Key Data Covered in this Stainless Steel Market Research and Growth Report?

  • What is the expected growth of the Stainless Steel Market between 2026 and 2030?

    • USD 50.27 billion, at a CAGR of 5.4%

  • What segmentation does the market report cover?

    • The report is segmented by Product (Flat, and Long), End-user (Metal products, Mechanical engineering, Infrastructure and construction, Automobile and transportation, and Electrical engineering), Grade Type (Austenitic, Ferritic, Duplex, Martensitic, and Others) and Geography (APAC, Europe, North America, Middle East and Africa, South America)

  • Which regions are analyzed in the report?

    • APAC, Europe, North America, Middle East and Africa and South America

  • What are the key growth drivers and market challenges?

    • Accelerated urbanization and infrastructure development, Extreme volatility in raw material procurement and global supply chain instability

  • Who are the major players in the Stainless Steel Market?

    • Acerinox SA, Aichi Steel Corp., Allegheny Technologies Inc., Alleima AB, Ambica Steels Ltd., Aperam SA, ArcelorMittal S.A., Carpenter Technology Corp., Cleveland Cliffs Inc., Cogne Acciai S.P.A., Daido Steel Co. Ltd., HBIS Group Co. Ltd., JFE Holdings Inc., Jiangsu Shagang Group, Jindal Stainless Ltd., Nippon Steel Corp., Outokumpu Oyj, POSCO Co. Ltd., Tubacex SA and voestalpine AG

Market Research Insights

  • The Stainless Steel Market continues to evolve as industries prioritize extreme thermal stress management and sustainable urban infrastructure. Adopting digital twin simulation in smelting operations reduces material waste by 18%, directly improving manufacturing ROI. Organizations focusing on decarbonization transition strategies have achieved a 25% decrease in compliance-related penalties through enhanced supply chain transparency.
  • Furthermore, utilizing specialized alloys for saline environmental exposure in offshore installations extends asset lifecycles by 30%, significantly lowering long-term maintenance expenditures. This strategic alignment with circular economy principles ensures that robust materials remain fundamental to modern engineering, aerospace precision engineering, and clean energy distribution networks.

We can help! Our analysts can customize this stainless steel market research report to meet your requirements.

Get in touch

1. Executive Summary

1.1 Market overview

Executive Summary - Chart on Market Overview
Executive Summary - Data Table on Market Overview
Executive Summary - Chart on Global Market Characteristics
Executive Summary - Chart on Market by Geography
Executive Summary - Chart on Market Segmentation by Product
Executive Summary - Chart on Market Segmentation by End-user
Executive Summary - Chart on Market Segmentation by Grade Type
Executive Summary - Chart on Incremental Growth
Executive Summary - Data Table on Incremental Growth
Executive Summary - Chart on Company Market Positioning

2. Technavio Analysis

2.1 Analysis of price sensitivity, lifecycle, customer purchase basket, adoption rates, and purchase criteria

2.2 Criticality of inputs and Factors of differentiation

Chart on Overview on criticality of inputs and factors of differentiation

2.3 Factors of disruption

Chart on Overview on factors of disruption

2.4 Impact of drivers and challenges

Chart on Impact of drivers and challenges in 2025 and 2030

3. Market Landscape

3.1 Market ecosystem

Chart on Parent Market
Data Table on - Parent Market

3.2 Market characteristics

Chart on Market characteristics analysis

3.3 Value chain analysis

Chart on Value chain analysis

4. Market Sizing

4.1 Market definition

Data Table on Offerings of companies included in the market definition

4.2 Market segment analysis

Market segments

4.3 Market size 2025

4.4 Market outlook: Forecast for 2025-2030

Chart on Global - Market size and forecast 2025-2030 ($ million)
Data Table on Global - Market size and forecast 2025-2030 ($ million)
Chart on Global Market: Year-over-year growth 2025-2030 (%)
Data Table on Global Market: Year-over-year growth 2025-2030 (%)

5. Historic Market Size

5.1 Global Stainless Steel Market 2020 - 2024

Historic Market Size - Data Table on Global Stainless Steel Market 2020 - 2024 ($ million)

5.2 Product segment analysis 2020 - 2024

Historic Market Size - Product Segment 2020 - 2024 ($ million)

5.3 End-user segment analysis 2020 - 2024

Historic Market Size - End-user Segment 2020 - 2024 ($ million)

5.4 Grade Type segment analysis 2020 - 2024

Historic Market Size - Grade Type Segment 2020 - 2024 ($ million)

5.5 Geography segment analysis 2020 - 2024

Historic Market Size - Geography Segment 2020 - 2024 ($ million)

5.6 Country segment analysis 2020 - 2024

Historic Market Size - Country Segment 2020 - 2024 ($ million)

6. Qualitative Analysis

6.1 Impact of AI on Global Stainless Steel Market

6.2 Impact of geopolitical conflicts on Global Stainless Steel Market

7. Five Forces Analysis

7.1 Five forces summary

Five forces analysis - Comparison between 2025 and 2030

7.2 Bargaining power of buyers

Bargaining power of buyers - Impact of key factors 2025 and 2030

7.3 Bargaining power of suppliers

Bargaining power of suppliers - Impact of key factors in 2025 and 2030

7.4 Threat of new entrants

Threat of new entrants - Impact of key factors in 2025 and 2030

7.5 Threat of substitutes

Threat of substitutes - Impact of key factors in 2025 and 2030

7.6 Threat of rivalry

Threat of rivalry - Impact of key factors in 2025 and 2030

7.7 Market condition

Chart on Market condition - Five forces 2025 and 2030

8. Market Segmentation by Product

8.1 Market segments

Chart on Product - Market share 2025-2030 (%)
Data Table on Product - Market share 2025-2030 (%)

8.2 Comparison by Product

Chart on Comparison by Product
Data Table on Comparison by Product

8.3 Flat - Market size and forecast 2025-2030

Chart on Flat - Market size and forecast 2025-2030 ($ million)
Data Table on Flat - Market size and forecast 2025-2030 ($ million)
Chart on Flat - Year-over-year growth 2025-2030 (%)
Data Table on Flat - Year-over-year growth 2025-2030 (%)

8.4 Long - Market size and forecast 2025-2030

Chart on Long - Market size and forecast 2025-2030 ($ million)
Data Table on Long - Market size and forecast 2025-2030 ($ million)
Chart on Long - Year-over-year growth 2025-2030 (%)
Data Table on Long - Year-over-year growth 2025-2030 (%)

8.5 Market opportunity by Product

Market opportunity by Product ($ million)
Data Table on Market opportunity by Product ($ million)

9. Market Segmentation by End-user

9.1 Market segments

Chart on End-user - Market share 2025-2030 (%)
Data Table on End-user - Market share 2025-2030 (%)

9.2 Comparison by End-user

Chart on Comparison by End-user
Data Table on Comparison by End-user

9.3 Metal products - Market size and forecast 2025-2030

Chart on Metal products - Market size and forecast 2025-2030 ($ million)
Data Table on Metal products - Market size and forecast 2025-2030 ($ million)
Chart on Metal products - Year-over-year growth 2025-2030 (%)
Data Table on Metal products - Year-over-year growth 2025-2030 (%)

9.4 Mechanical engineering - Market size and forecast 2025-2030

Chart on Mechanical engineering - Market size and forecast 2025-2030 ($ million)
Data Table on Mechanical engineering - Market size and forecast 2025-2030 ($ million)
Chart on Mechanical engineering - Year-over-year growth 2025-2030 (%)
Data Table on Mechanical engineering - Year-over-year growth 2025-2030 (%)

9.5 Infrastructure and construction - Market size and forecast 2025-2030

Chart on Infrastructure and construction - Market size and forecast 2025-2030 ($ million)
Data Table on Infrastructure and construction - Market size and forecast 2025-2030 ($ million)
Chart on Infrastructure and construction - Year-over-year growth 2025-2030 (%)
Data Table on Infrastructure and construction - Year-over-year growth 2025-2030 (%)

9.6 Automobile and transportation - Market size and forecast 2025-2030

Chart on Automobile and transportation - Market size and forecast 2025-2030 ($ million)
Data Table on Automobile and transportation - Market size and forecast 2025-2030 ($ million)
Chart on Automobile and transportation - Year-over-year growth 2025-2030 (%)
Data Table on Automobile and transportation - Year-over-year growth 2025-2030 (%)

9.7 Electrical engineering - Market size and forecast 2025-2030

Chart on Electrical engineering - Market size and forecast 2025-2030 ($ million)
Data Table on Electrical engineering - Market size and forecast 2025-2030 ($ million)
Chart on Electrical engineering - Year-over-year growth 2025-2030 (%)
Data Table on Electrical engineering - Year-over-year growth 2025-2030 (%)

9.8 Market opportunity by End-user

Market opportunity by End-user ($ million)
Data Table on Market opportunity by End-user ($ million)

10. Market Segmentation by Grade Type

10.1 Market segments

Chart on Grade Type - Market share 2025-2030 (%)
Data Table on Grade Type - Market share 2025-2030 (%)

10.2 Comparison by Grade Type

Chart on Comparison by Grade Type
Data Table on Comparison by Grade Type

10.3 Austenitic - Market size and forecast 2025-2030

Chart on Austenitic - Market size and forecast 2025-2030 ($ million)
Data Table on Austenitic - Market size and forecast 2025-2030 ($ million)
Chart on Austenitic - Year-over-year growth 2025-2030 (%)
Data Table on Austenitic - Year-over-year growth 2025-2030 (%)

10.4 Ferritic - Market size and forecast 2025-2030

Chart on Ferritic - Market size and forecast 2025-2030 ($ million)
Data Table on Ferritic - Market size and forecast 2025-2030 ($ million)
Chart on Ferritic - Year-over-year growth 2025-2030 (%)
Data Table on Ferritic - Year-over-year growth 2025-2030 (%)

10.5 Duplex - Market size and forecast 2025-2030

Chart on Duplex - Market size and forecast 2025-2030 ($ million)
Data Table on Duplex - Market size and forecast 2025-2030 ($ million)
Chart on Duplex - Year-over-year growth 2025-2030 (%)
Data Table on Duplex - Year-over-year growth 2025-2030 (%)

10.6 Martensitic - Market size and forecast 2025-2030

Chart on Martensitic - Market size and forecast 2025-2030 ($ million)
Data Table on Martensitic - Market size and forecast 2025-2030 ($ million)
Chart on Martensitic - Year-over-year growth 2025-2030 (%)
Data Table on Martensitic - Year-over-year growth 2025-2030 (%)

10.7 Others - Market size and forecast 2025-2030

Chart on Others - Market size and forecast 2025-2030 ($ million)
Data Table on Others - Market size and forecast 2025-2030 ($ million)
Chart on Others - Year-over-year growth 2025-2030 (%)
Data Table on Others - Year-over-year growth 2025-2030 (%)

10.8 Market opportunity by Grade Type

Market opportunity by Grade Type ($ million)
Data Table on Market opportunity by Grade Type ($ million)

11. Customer Landscape

11.1 Customer landscape overview

Analysis of price sensitivity, lifecycle, customer purchase basket, adoption rates, and purchase criteria

12. Geographic Landscape

12.1 Geographic segmentation

Chart on Market share by geography 2025-2030 (%)
Data Table on Market share by geography 2025-2030 (%)

12.2 Geographic comparison

Chart on Geographic comparison
Data Table on Geographic comparison

12.3 APAC - Market size and forecast 2025-2030

Chart on APAC - Market size and forecast 2025-2030 ($ million)
Data Table on APAC - Market size and forecast 2025-2030 ($ million)
Chart on APAC - Year-over-year growth 2025-2030 (%)
Data Table on APAC - Year-over-year growth 2025-2030 (%)
Chart on Regional Comparison - APAC
Data Table on Regional Comparison - APAC

12.3.1 China - Market size and forecast 2025-2030

Chart on China - Market size and forecast 2025-2030 ($ million)
Data Table on China - Market size and forecast 2025-2030 ($ million)
Chart on China - Year-over-year growth 2025-2030 (%)
Data Table on China - Year-over-year growth 2025-2030 (%)

12.3.2 India - Market size and forecast 2025-2030

Chart on India - Market size and forecast 2025-2030 ($ million)
Data Table on India - Market size and forecast 2025-2030 ($ million)
Chart on India - Year-over-year growth 2025-2030 (%)
Data Table on India - Year-over-year growth 2025-2030 (%)

12.3.3 Japan - Market size and forecast 2025-2030

Chart on Japan - Market size and forecast 2025-2030 ($ million)
Data Table on Japan - Market size and forecast 2025-2030 ($ million)
Chart on Japan - Year-over-year growth 2025-2030 (%)
Data Table on Japan - Year-over-year growth 2025-2030 (%)

12.3.4 South Korea - Market size and forecast 2025-2030

Chart on South Korea - Market size and forecast 2025-2030 ($ million)
Data Table on South Korea - Market size and forecast 2025-2030 ($ million)
Chart on South Korea - Year-over-year growth 2025-2030 (%)
Data Table on South Korea - Year-over-year growth 2025-2030 (%)

12.3.5 Taiwan - Market size and forecast 2025-2030

Chart on Taiwan - Market size and forecast 2025-2030 ($ million)
Data Table on Taiwan - Market size and forecast 2025-2030 ($ million)
Chart on Taiwan - Year-over-year growth 2025-2030 (%)
Data Table on Taiwan - Year-over-year growth 2025-2030 (%)

12.3.6 Indonesia - Market size and forecast 2025-2030

Chart on Indonesia - Market size and forecast 2025-2030 ($ million)
Data Table on Indonesia - Market size and forecast 2025-2030 ($ million)
Chart on Indonesia - Year-over-year growth 2025-2030 (%)
Data Table on Indonesia - Year-over-year growth 2025-2030 (%)

12.4 Europe - Market size and forecast 2025-2030

Chart on Europe - Market size and forecast 2025-2030 ($ million)
Data Table on Europe - Market size and forecast 2025-2030 ($ million)
Chart on Europe - Year-over-year growth 2025-2030 (%)
Data Table on Europe - Year-over-year growth 2025-2030 (%)
Chart on Regional Comparison - Europe
Data Table on Regional Comparison - Europe

12.4.1 Germany - Market size and forecast 2025-2030

Chart on Germany - Market size and forecast 2025-2030 ($ million)
Data Table on Germany - Market size and forecast 2025-2030 ($ million)
Chart on Germany - Year-over-year growth 2025-2030 (%)
Data Table on Germany - Year-over-year growth 2025-2030 (%)

12.4.2 Italy - Market size and forecast 2025-2030

Chart on Italy - Market size and forecast 2025-2030 ($ million)
Data Table on Italy - Market size and forecast 2025-2030 ($ million)
Chart on Italy - Year-over-year growth 2025-2030 (%)
Data Table on Italy - Year-over-year growth 2025-2030 (%)

12.4.3 France - Market size and forecast 2025-2030

Chart on France - Market size and forecast 2025-2030 ($ million)
Data Table on France - Market size and forecast 2025-2030 ($ million)
Chart on France - Year-over-year growth 2025-2030 (%)
Data Table on France - Year-over-year growth 2025-2030 (%)

12.4.4 Spain - Market size and forecast 2025-2030

Chart on Spain - Market size and forecast 2025-2030 ($ million)
Data Table on Spain - Market size and forecast 2025-2030 ($ million)
Chart on Spain - Year-over-year growth 2025-2030 (%)
Data Table on Spain - Year-over-year growth 2025-2030 (%)

12.4.5 UK - Market size and forecast 2025-2030

Chart on UK - Market size and forecast 2025-2030 ($ million)
Data Table on UK - Market size and forecast 2025-2030 ($ million)
Chart on UK - Year-over-year growth 2025-2030 (%)
Data Table on UK - Year-over-year growth 2025-2030 (%)

12.4.6 The Netherlands - Market size and forecast 2025-2030

Chart on The Netherlands - Market size and forecast 2025-2030 ($ million)
Data Table on The Netherlands - Market size and forecast 2025-2030 ($ million)
Chart on The Netherlands - Year-over-year growth 2025-2030 (%)
Data Table on The Netherlands - Year-over-year growth 2025-2030 (%)

12.5 North America - Market size and forecast 2025-2030

Chart on North America - Market size and forecast 2025-2030 ($ million)
Data Table on North America - Market size and forecast 2025-2030 ($ million)
Chart on North America - Year-over-year growth 2025-2030 (%)
Data Table on North America - Year-over-year growth 2025-2030 (%)
Chart on Regional Comparison - North America
Data Table on Regional Comparison - North America

12.5.1 US - Market size and forecast 2025-2030

Chart on US - Market size and forecast 2025-2030 ($ million)
Data Table on US - Market size and forecast 2025-2030 ($ million)
Chart on US - Year-over-year growth 2025-2030 (%)
Data Table on US - Year-over-year growth 2025-2030 (%)

12.5.2 Mexico - Market size and forecast 2025-2030

Chart on Mexico - Market size and forecast 2025-2030 ($ million)
Data Table on Mexico - Market size and forecast 2025-2030 ($ million)
Chart on Mexico - Year-over-year growth 2025-2030 (%)
Data Table on Mexico - Year-over-year growth 2025-2030 (%)

12.5.3 Canada - Market size and forecast 2025-2030

Chart on Canada - Market size and forecast 2025-2030 ($ million)
Data Table on Canada - Market size and forecast 2025-2030 ($ million)
Chart on Canada - Year-over-year growth 2025-2030 (%)
Data Table on Canada - Year-over-year growth 2025-2030 (%)

12.6 Middle East and Africa - Market size and forecast 2025-2030

Chart on Middle East and Africa - Market size and forecast 2025-2030 ($ million)
Data Table on Middle East and Africa - Market size and forecast 2025-2030 ($ million)
Chart on Middle East and Africa - Year-over-year growth 2025-2030 (%)
Data Table on Middle East and Africa - Year-over-year growth 2025-2030 (%)
Chart on Regional Comparison - Middle East and Africa
Data Table on Regional Comparison - Middle East and Africa

12.6.1 Saudi Arabia - Market size and forecast 2025-2030

Chart on Saudi Arabia - Market size and forecast 2025-2030 ($ million)
Data Table on Saudi Arabia - Market size and forecast 2025-2030 ($ million)
Chart on Saudi Arabia - Year-over-year growth 2025-2030 (%)
Data Table on Saudi Arabia - Year-over-year growth 2025-2030 (%)

12.6.2 UAE - Market size and forecast 2025-2030

Chart on UAE - Market size and forecast 2025-2030 ($ million)
Data Table on UAE - Market size and forecast 2025-2030 ($ million)
Chart on UAE - Year-over-year growth 2025-2030 (%)
Data Table on UAE - Year-over-year growth 2025-2030 (%)

12.6.3 South Africa - Market size and forecast 2025-2030

Chart on South Africa - Market size and forecast 2025-2030 ($ million)
Data Table on South Africa - Market size and forecast 2025-2030 ($ million)
Chart on South Africa - Year-over-year growth 2025-2030 (%)
Data Table on South Africa - Year-over-year growth 2025-2030 (%)

12.6.4 Egypt - Market size and forecast 2025-2030

Chart on Egypt - Market size and forecast 2025-2030 ($ million)
Data Table on Egypt - Market size and forecast 2025-2030 ($ million)
Chart on Egypt - Year-over-year growth 2025-2030 (%)
Data Table on Egypt - Year-over-year growth 2025-2030 (%)

12.6.5 Turkey - Market size and forecast 2025-2030

Chart on Turkey - Market size and forecast 2025-2030 ($ million)
Data Table on Turkey - Market size and forecast 2025-2030 ($ million)
Chart on Turkey - Year-over-year growth 2025-2030 (%)
Data Table on Turkey - Year-over-year growth 2025-2030 (%)

12.7 South America - Market size and forecast 2025-2030

Chart on South America - Market size and forecast 2025-2030 ($ million)
Data Table on South America - Market size and forecast 2025-2030 ($ million)
Chart on South America - Year-over-year growth 2025-2030 (%)
Data Table on South America - Year-over-year growth 2025-2030 (%)
Chart on Regional Comparison - South America
Data Table on Regional Comparison - South America

12.7.1 Brazil - Market size and forecast 2025-2030

Chart on Brazil - Market size and forecast 2025-2030 ($ million)
Data Table on Brazil - Market size and forecast 2025-2030 ($ million)
Chart on Brazil - Year-over-year growth 2025-2030 (%)
Data Table on Brazil - Year-over-year growth 2025-2030 (%)

12.7.2 Argentina - Market size and forecast 2025-2030

Chart on Argentina - Market size and forecast 2025-2030 ($ million)
Data Table on Argentina - Market size and forecast 2025-2030 ($ million)
Chart on Argentina - Year-over-year growth 2025-2030 (%)
Data Table on Argentina - Year-over-year growth 2025-2030 (%)

12.7.3 Chile - Market size and forecast 2025-2030

Chart on Chile - Market size and forecast 2025-2030 ($ million)
Data Table on Chile - Market size and forecast 2025-2030 ($ million)
Chart on Chile - Year-over-year growth 2025-2030 (%)
Data Table on Chile - Year-over-year growth 2025-2030 (%)

12.8 Market opportunity by geography

Market opportunity by geography ($ million)
Data Tables on Market opportunity by geography ($ million)

13. Drivers, Challenges, and Opportunity

13.1 Market drivers

Accelerated urbanization and infrastructure development
Global transition toward green energy infrastructure and hydrogen storage
Technological advancements in aerospace and precision engineering sectors

13.2 Market challenges

Extreme volatility in raw material procurement and global supply chain instability
Stringent environmental regulations and financial burden of decarbonization
Market saturated by regional overcapacity and rise of trade protectionism

13.3 Impact of drivers and challenges

Impact of drivers and challenges in 2025 and 2030

13.4 Market opportunities

Integration of circular economy principles through enhanced scrap metal utilization
Adoption of AI and real-time data analytics in steel fabrication
Growth of specialized super-austenitic and duplex grades for niche industrial applications

14. Competitive Landscape

14.1 Overview

14.2

Overview on criticality of inputs and factors of differentiation

14.3 Landscape disruption

Overview on factors of disruption

14.4 Industry risks

Impact of key risks on business

15. Competitive Analysis

15.1 Companies profiled

Companies covered

15.2 Company ranking index

15.3 Market positioning of companies

Matrix on companies position and classification

15.4 Acerinox SA

Acerinox SA - Overview
Acerinox SA - Business segments
Acerinox SA - Key offerings
Acerinox SA - Segment focus
SWOT

15.5 Aichi Steel Corp.

Aichi Steel Corp. - Overview
Aichi Steel Corp. - Business segments
Aichi Steel Corp. - Key offerings
Aichi Steel Corp. - Segment focus
SWOT

15.6 Allegheny Technologies Inc.

Allegheny Technologies Inc. - Overview
Allegheny Technologies Inc. - Business segments
Allegheny Technologies Inc. - Key offerings
Allegheny Technologies Inc. - Segment focus
SWOT

15.7 Alleima AB

Alleima AB - Overview
Alleima AB - Business segments
Alleima AB - Key offerings
Alleima AB - Segment focus
SWOT

15.8 Ambica Steels Ltd.

Ambica Steels Ltd. - Overview
Ambica Steels Ltd. - Product / Service
Ambica Steels Ltd. - Key offerings
SWOT

15.9 Aperam SA

Aperam SA - Overview
Aperam SA - Business segments
Aperam SA - Key offerings
Aperam SA - Segment focus
SWOT

15.10 ArcelorMittal S.A.

ArcelorMittal S.A. - Overview
ArcelorMittal S.A. - Business segments
ArcelorMittal S.A. - Key offerings
ArcelorMittal S.A. - Segment focus
SWOT

15.11 Carpenter Technology Corp.

Carpenter Technology Corp. - Overview
Carpenter Technology Corp. - Business segments
Carpenter Technology Corp. - Key offerings
Carpenter Technology Corp. - Segment focus
SWOT

15.12 Daido Steel Co. Ltd.

Daido Steel Co. Ltd. - Overview
Daido Steel Co. Ltd. - Business segments
Daido Steel Co. Ltd. - Key offerings
Daido Steel Co. Ltd. - Segment focus
SWOT

15.13 HBIS Group Co. Ltd.

HBIS Group Co. Ltd. - Overview
HBIS Group Co. Ltd. - Product / Service
HBIS Group Co. Ltd. - Key offerings
SWOT

15.14 JFE Holdings Inc.

JFE Holdings Inc. - Overview
JFE Holdings Inc. - Business segments
JFE Holdings Inc. - Key offerings
JFE Holdings Inc. - Segment focus
SWOT

15.15 Jindal Stainless Ltd.

Jindal Stainless Ltd. - Overview
Jindal Stainless Ltd. - Product / Service
Jindal Stainless Ltd. - Key offerings
SWOT

15.16 Nippon Steel Corp.

Nippon Steel Corp. - Overview
Nippon Steel Corp. - Business segments
Nippon Steel Corp. - Key offerings
Nippon Steel Corp. - Segment focus
SWOT

15.17 Outokumpu Oyj

Outokumpu Oyj - Overview
Outokumpu Oyj - Business segments
Outokumpu Oyj - Key offerings
Outokumpu Oyj - Segment focus
SWOT

15.18 POSCO Co. Ltd.

POSCO Co. Ltd. - Overview
POSCO Co. Ltd. - Business segments
POSCO Co. Ltd. - Key offerings
POSCO Co. Ltd. - Segment focus
SWOT

16. Appendix

16.1 Scope of the report

Market definition
Objectives
Notes and caveats

16.2 Inclusions and exclusions checklist

Inclusions checklist
Exclusions checklist

16.3 Currency conversion rates for US$

16.4 Research methodology

16.5 Data procurement

Information sources

16.6 Data validation

16.7 Validation techniques employed for market sizing

16.8 Data synthesis

16.9 360 degree market analysis

16.10 List of abbreviations

Research Methodology

Technavio presents a detailed picture of the market by way of study, synthesis, and summation of data from multiple sources. The analysts have presented the various facets of the market with a particular focus on identifying the key industry influencers. The data thus presented is comprehensive, reliable, and the result of extensive research, both primary and secondary.

INFORMATION SOURCES

Primary sources

  • Manufacturers and suppliers
  • Channel partners
  • Industry experts
  • Strategic decision makers

Secondary sources

  • Industry journals and periodicals
  • Government data
  • Financial reports of key industry players
  • Historical data
  • Press releases

DATA ANALYSIS

Data Synthesis

  • Collation of data
  • Estimation of key figures
  • Analysis of derived insights

Data Validation

  • Triangulation with data models
  • Reference against proprietary databases
  • Corroboration with industry experts

REPORT WRITING

Qualitative

  • Market drivers
  • Market challenges
  • Market trends
  • Five forces analysis

Quantitative

  • Market size and forecast
  • Market segmentation
  • Geographical insights
  • Competitive landscape

Interested in this report?

Get your sample now to see our research methodology and insights!

Download Now

Frequently Asked Questions

Stainless Steel market growth will increase by USD 50269.5 million during 2026-2030.

The Stainless Steel market is expected to grow at a CAGR of 5.4% during 2026-2030.

Stainless Steel market is segmented by Product (Flat, Long) End-user (Metal products, Mechanical engineering, Infrastructure and construction, Automobile and transportation, Electrical engineering) Grade type (Austenitic, Ferritic, Duplex, Martensitic, Others)

Acerinox SA, Aichi Steel Corp., Allegheny Technologies Inc., Alleima AB, Ambica Steels Ltd., Aperam SA, ArcelorMittal S.A., Carpenter Technology Corp., Cleveland Cliffs Inc., Cogne Acciai S.P.A., Daido Steel Co. Ltd., HBIS Group Co. Ltd., JFE Holdings Inc., Jiangsu Shagang Group, Jindal Stainless Ltd., Nippon Steel Corp., Outokumpu Oyj, POSCO Co. Ltd., Tubacex SA, voestalpine AG are a few of the key vendors in the Stainless Steel market.

APAC will register the highest growth rate of 77.2% among the other regions. Therefore, the Stainless Steel market in APAC is expected to garner significant business opportunities for the vendors during the forecast period.

China, India, Japan, South Korea, Taiwan, Indonesia, Germany, Italy, France, Spain, UK, The Netherlands, US, Mexico, Canada, Saudi Arabia, UAE, South Africa, Egypt, Turkey, Brazil, Argentina, Chile

  • Accelerated urbanization and infrastructure development is the driving factor this market.

The Stainless Steel market vendors should focus on grabbing business opportunities from the Product segment as it accounted for the largest market share in the base year.
RIA - Research AI Assistant
Ask RIA
