Storage And Warehouse Leasing Market Analysis, Size, and Forecast 2026-2030: North America (US, Canada, and Mexico), APAC (China, Japan, and India), Europe (Germany, UK, and France), South America (Brazil, Argentina, and Colombia), Middle East and Africa (Saudi Arabia, UAE, and South Africa), and Rest of World (ROW)

Storage And Warehouse Leasing Market Analysis, Size, and Forecast 2026-2030:
North America (US, Canada, and Mexico), APAC (China, Japan, and India), Europe (Germany, UK, and France), South America (Brazil, Argentina, and Colombia), Middle East and Africa (Saudi Arabia, UAE, and South Africa), and Rest of World (ROW)

Published: Oct 2026 298 Pages SKU: IRTNTR73127

Market Overview at a Glance

$122.73 B
Market Opportunity
7.8%
CAGR 2025 - 2030
39.1%
North America Growth
$204.79 B
Non-climate controlled segment 2024

Storage And Warehouse Leasing Market Size 2026-2030

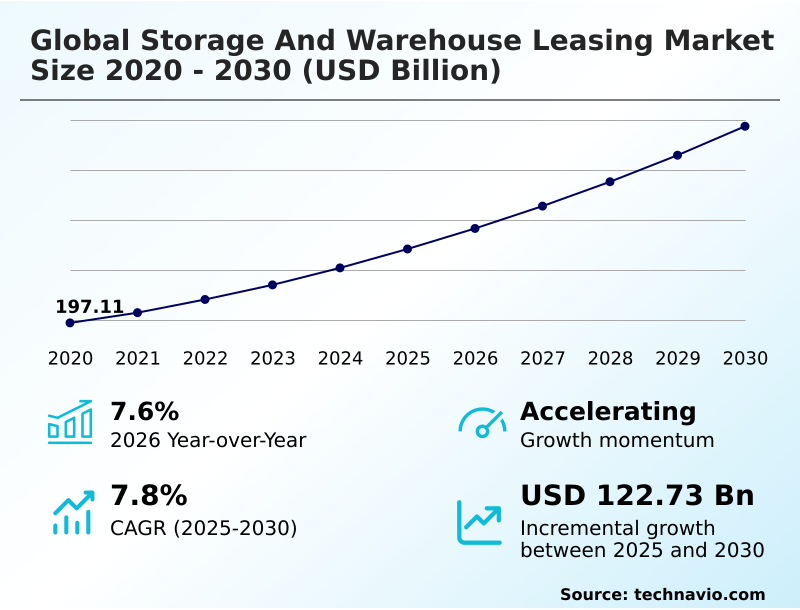
The storage and warehouse leasing market size is valued to increase by USD 122.73 billion, at a CAGR of 7.8% from 2025 to 2030. Proliferation of e-commerce and omnichannel retail will drive the storage and warehouse leasing market.

Major Market Trends & Insights

  • North America dominated the market and accounted for a 39.1% growth during the forecast period.
  • By Type - Non-climate controlled segment was valued at USD 204.79 billion in 2024
  • By End-user - Manufacturing segment accounted for the largest market revenue share in 2024

Market Size & Forecast

  • Market Opportunities: USD 196.62 billion
  • Market Future Opportunities: USD 122.73 billion
  • CAGR from 2025 to 2030 : 7.8%

Market Summary

  • The Storage And Warehouse Leasing Market functions as the critical physical backbone of modern supply chain networks enabling the efficient storage management and distribution of goods across diverse industries.
  • The structural shift toward electronic commerce acts as a paramount driver for this sector compelling retailers to expand their logistics footprints to support complex omnichannel fulfillment strategies and rapid last-mile delivery expectations. In a typical retail supply chain scenario transitioning from traditional pallet shipping to individual order sortation necessitates significantly more floor space driving companies to secure modern technology-enabled facilities.
  • This strategic shift has enabled businesses to achieve a 40% improvement in outbound processing speeds compared to legacy operations. However this expansion is constrained by the persistent scarcity of suitable industrial land in prime metropolitan corridors.
  • The lack of developable parcels significantly inflates acquisition and construction expenses presenting a major challenge that forces tenants to absorb higher occupancy costs or compromise on secondary logistics locations. Consequently the market remains highly dynamic balancing the urgent need for operational capacity against mounting structural and financial barriers.

What will be the Size of the Storage And Warehouse Leasing Market during the forecast period?
Get Key Insights on Market Forecast (PDF) Get Free Sample

How is the Storage And Warehouse Leasing Market Segmented?

The storage and warehouse leasing industry research report provides comprehensive data (region-wise segment analysis), with forecasts and estimates in "USD million" for the period 2026-2030, as well as historical data from 2020-2024 for the following segments.

  • Type
    • Non-climate controlled
    • Climate controlled
  • End-user
    • Manufacturing
    • Retail
    • Consumer goods
    • Food and beverages
    • Others
  • Ownership
    • Large and medium enterprises
    • Small enterprises
  • Geography
    • North America
      • US
      • Canada
      • Mexico
    • APAC
      • China
      • Japan
      • India
      • Australia
      • South Korea
      • Singapore
    • Europe
      • Germany
      • UK
      • France
      • The Netherlands
      • Italy
      • Spain
    • South America
      • Brazil
      • Argentina
      • Colombia
    • Middle East and Africa
      • Saudi Arabia
      • UAE
      • South Africa
      • Turkey
      • Egypt

By Type Insights

The non-climate controlled segment is estimated to witness significant growth during the forecast period.

The non-climate controlled segment of the Storage And Warehouse Leasing Market serves as the foundational infrastructure for global supply chain optimization.

These facilities accommodate a vast array of goods ranging from durable consumer products to industrial materials requiring expansive footprints rather than temperature regulation.

As electronic commerce continues to expand, demand for omnichannel fulfillment center locations and high bay warehouse structures has intensified allowing businesses to maximize vertical storage and improve inventory turnover.

Modern non-climate controlled facilities are increasingly integrating advanced infrastructure to support automation which directly impacts tenant occupancy cost and operational efficiency. By leveraging these optimized logistics nodes companies have achieved a 22% improvement in inventory processing speeds.

This structural modernization enables faster last mile logistics execution and supports just in case inventory models without the elevated energy expenditures associated with regulated environments.
Get Free Sample

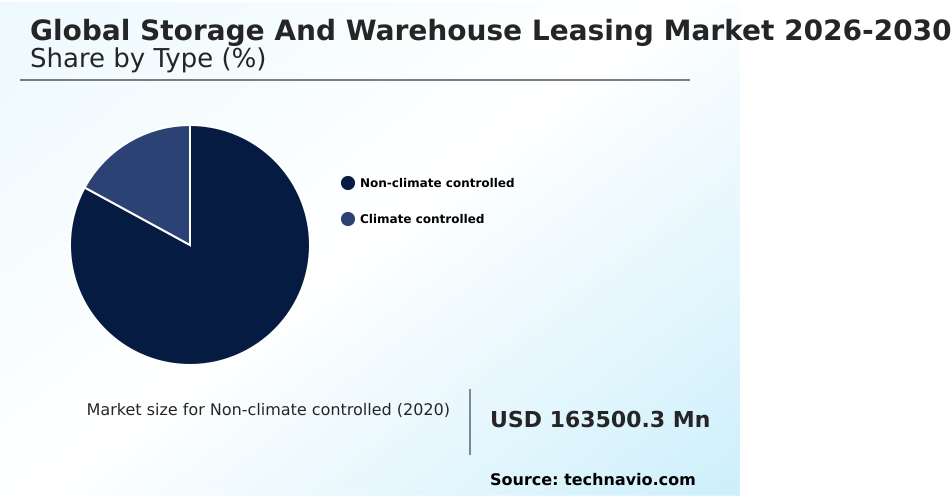
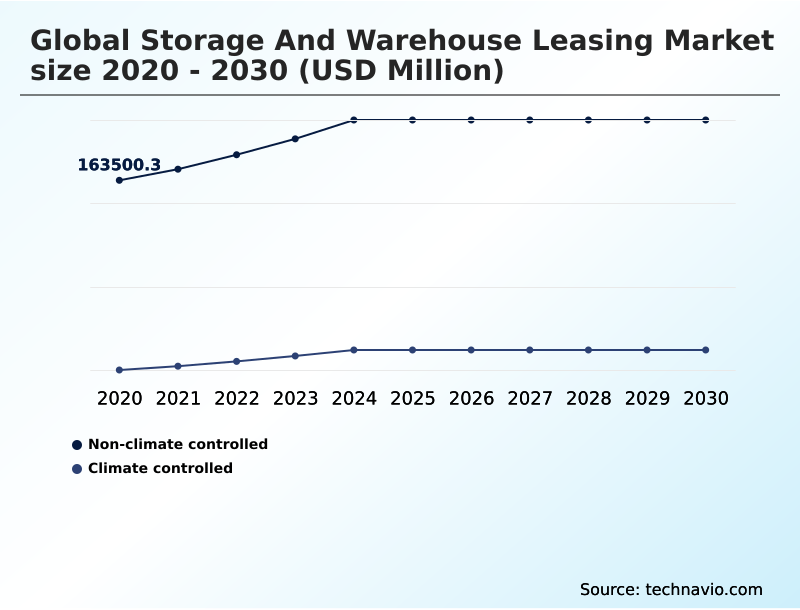
The Non-climate controlled segment was valued at USD 204.79 billion in 2024 and showed a gradual increase during the forecast period.
Get Free Sample

Regional Analysis

North America is estimated to contribute 39.1% to the growth of the global market during the forecast period.Technavio’s analysts have elaborately explained the regional trends and drivers that shape the market during the forecast period.
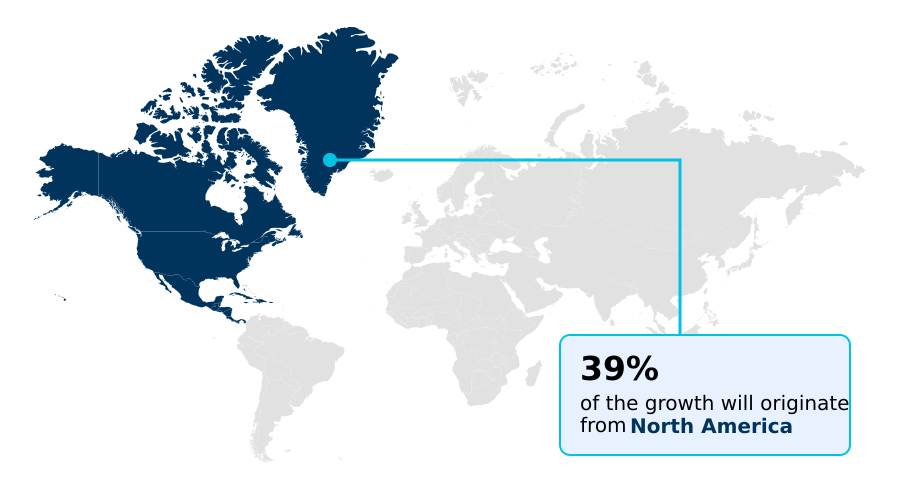
See How Storage And Warehouse Leasing Market Demand is Rising in North America Get Free Sample

The geographic landscape of the Storage And Warehouse Leasing Market reveals distinct evolutionary trajectories driven by regional economic policies and consumer behavior.

In North America the rapid modernization of industrial real estate is defined by massive build to suit project developments where operators integrate robotic picking technology to achieve a 35% reduction in fulfillment delays.

Conversely the market in APAC is heavily focused on expanding third party logistics infrastructure and advanced cold chain infrastructure to support burgeoning middle-class consumption.

This strategic pivot in APAC has enhanced supply chain visibility resulting in a 20% improvement in inventory accuracy compared to legacy fragmented networks.

While North American enterprises prioritize consolidating operations into hyper-efficient mega-centers to offset elevated labor costs APAC markets demand scalable multi-tier distribution hubs.

Both regions demonstrate that targeted facility modernization can yield up to a 25% increase in overall operational throughput reflecting deep structural adaptations to regional supply constraints.

Market Dynamics

Our researchers analyzed the data with 2025 as the base year, along with the key drivers, trends, and challenges. A holistic analysis of drivers will help companies refine their marketing strategies to gain a competitive advantage.

  • The strategic evolution of the Storage And Warehouse Leasing Market is fundamentally reshaping how enterprises manage their physical distribution networks. As consumer expectations for rapid fulfillment intensify organizations are prioritizing last mile delivery station proximity to minimize transit durations and optimize fleet routing.
  • In densely populated metropolitan zones where land scarcity is acute businesses are increasingly investing in multi story urban warehouse development. This architectural innovation allows companies to maximize vertical capacity effectively supporting complex logistics operations within constrained footprints.
  • Furthermore the handling of sensitive perishables and pharmaceuticals has accelerated the adoption of automated temperature controlled storage solutions ensuring strict regulatory compliance and significantly reducing spoilage rates. To accommodate fluctuating seasonal demand without carrying excess overhead small and mid-sized enterprises are heavily leveraging flexible co warehousing space leasing which provides scalable infrastructure on adaptable terms.
  • Concurrently broader geopolitical and economic disruptions have compelled major corporations to prioritize supply chain resilience inventory buffering moving away from vulnerable just-in-time models. This shift toward holding strategic reserve stock requires substantial additional square footage.
  • By adapting to these advanced facility models logistics operators have recorded a 30% improvement in inventory turnaround efficiency compared to traditional storage methods highlighting the critical role of specialized real estate in modern supply chain management.
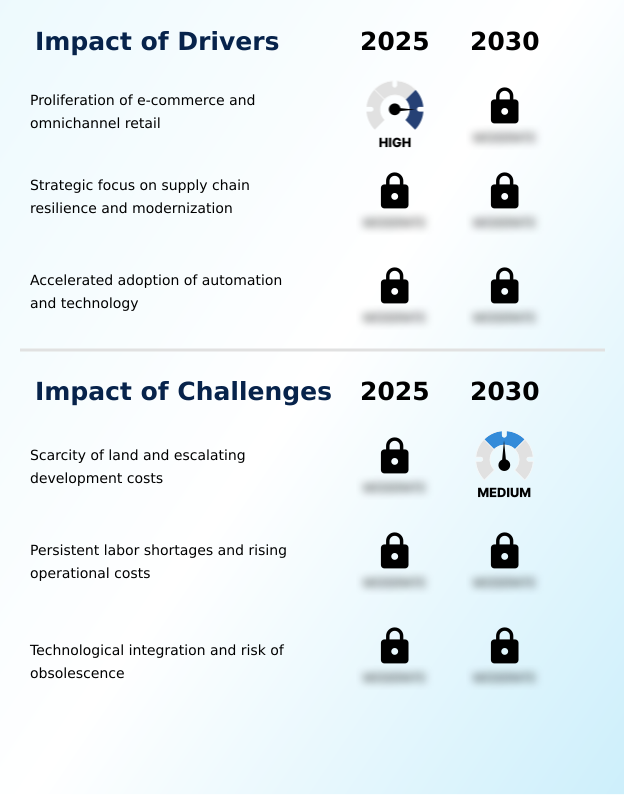
What are the key market drivers leading to the rise in the adoption of Storage And Warehouse Leasing Industry?

  • The structural proliferation of electronic commerce and omnichannel retail strategies serves as a primary driver propelling continuous demand for advanced logistics infrastructure.

  • The widespread adoption of complex omnichannel retail models serves as a primary driver propelling demand within the Storage And Warehouse Leasing Market.
  • As digital purchasing volumes escalate enterprises are forced to fundamentally restructure their inventory distribution strategy to support high-velocity ecommerce order sortation.
  • To manage seasonal demand surges without incurring prohibitive long-term overhead companies are increasingly utilizing on demand warehousing and flexible co warehousing space.
  • The deployment of advanced warehouse management software within these leased properties facilitates precise smart warehouse management enabling a 30% improvement in order fulfillment accuracy. Furthermore optimized inventory allocation across these decentralized networks has reduced aggregate transportation costs by 18%.
  • This strategic reliance on flexible technology-enabled real estate directly empowers retailers to maintain supply chain agility and satisfy rigorous consumer delivery expectations.

What are the market trends shaping the Storage And Warehouse Leasing Industry?

  • The rise of multi-story warehousing in urban centers has emerged as a defining market trend. This architectural shift addresses the scarcity of industrial land while facilitating rapid last-mile delivery operations.

  • A defining trend reshaping the Storage And Warehouse Leasing Market is the aggressive integration of environmental social and governance standards into facility architecture. Escalating regulatory pressures and corporate sustainability mandates are compelling operators to prioritize commercial property leasing agreements that include robust green building certification.
  • Consequently developers are retrofitting existing assets with energy efficient lighting and transforming rooftops into solar powered distribution hubs. This transition toward operating a fully carbon neutral facility directly lowers utility expenditures and ensures compliance with stringent regional emissions targets.
  • By embracing these sustainable design principles tenants have achieved a 25% reduction in overall energy consumption and a 15% decrease in facility maintenance costs compared to conventional industrial buildings. This architectural evolution ensures that modern logistics portfolios remain resilient cost-effective and aligned with contemporary corporate governance expectations.

What challenges does the Storage And Warehouse Leasing Industry face during its growth?

  • The pronounced scarcity of suitable industrial land coupled with escalating development costs presents a formidable challenge to affordable infrastructure expansion.

  • A formidable structural challenge within the Storage And Warehouse Leasing Market is the intense industrial land scarcity across primary metropolitan logistics corridors. This geographic constraint drastically inflates development budgets making it exceptionally difficult to construct a modern class a industrial building equipped with the necessary clear ceiling height and optimal dock door allocation required for advanced automation.
  • As a direct consequence of soaring land valuations facility operators are forced to absorb elevated leasing premiums which have increased operational baseline costs by 22% in prime urban zones. Furthermore securing adequate square footage to establish an efficient reverse logistics facility or a specialized temperature controlled facility remains highly competitive leading to a 15% bottleneck in returns processing.
  • These financial and spatial limitations force supply chain executives to continually balance ideal geographic positioning against escalating real estate expenditures.

Exclusive Technavio Analysis on Customer Landscape

The storage and warehouse leasing market forecasting report includes the adoption lifecycle of the market, covering from the innovator’s stage to the laggard’s stage. It focuses on adoption rates in different regions based on penetration. Furthermore, the storage and warehouse leasing market report also includes key purchase criteria and drivers of price sensitivity to help companies evaluate and develop their market growth analysis strategies.
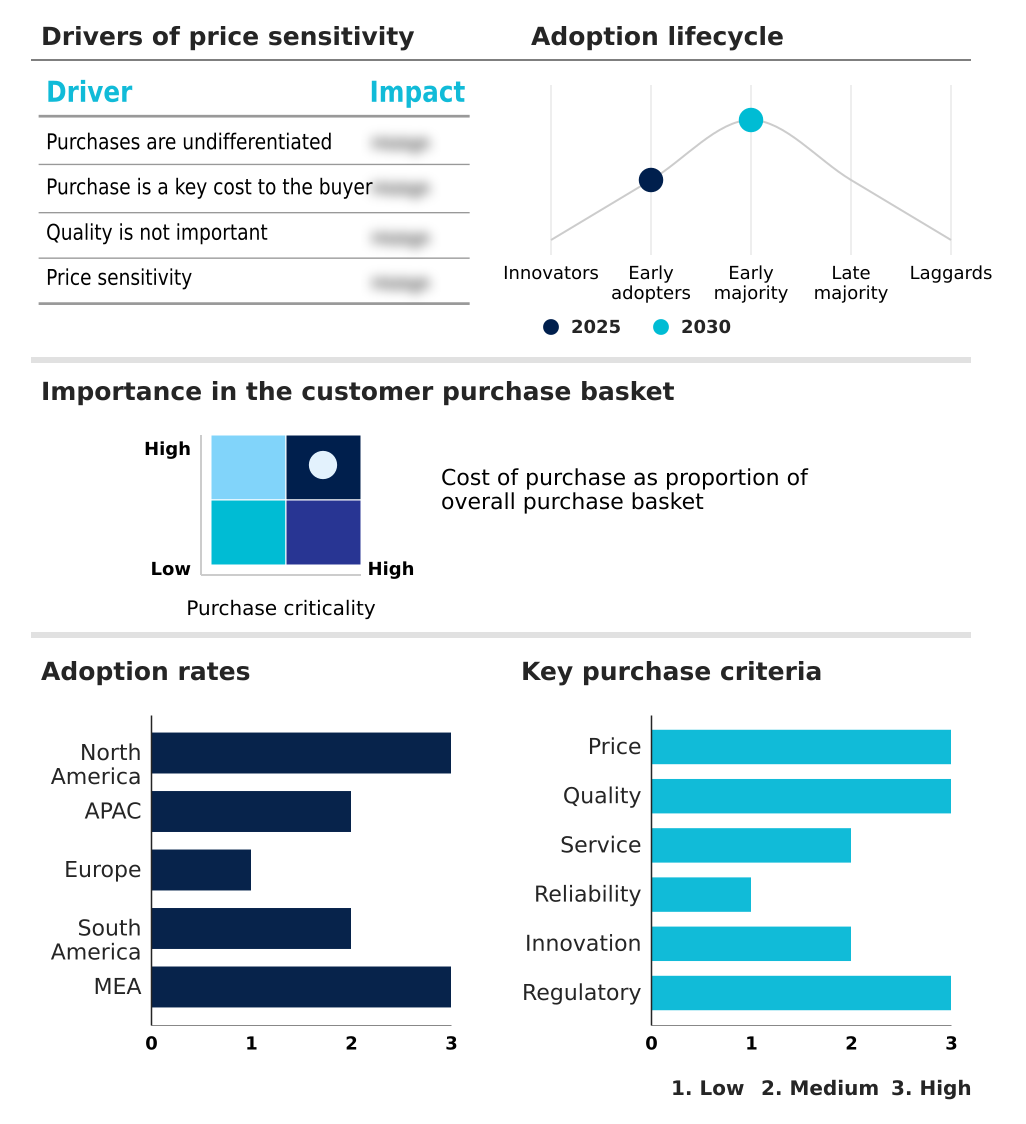
Customer Landscape of Storage And Warehouse Leasing Industry

Competitive Landscape

Companies are implementing various strategies, such as strategic alliances, storage and warehouse leasing market forecast, partnerships, mergers and acquisitions, geographical expansion, and product/service launches, to enhance their presence in the industry.

Adwise Realty LLP - Provides industrial property leasing solutions encompassing advanced distribution centers and modern logistics facilities designed to support flexible and long-term commercial inventory management requirements.

The industry research and growth report includes detailed analyses of the competitive landscape of the market and information about key companies, including:

  • Adwise Realty LLP
  • Agility Global PLC
  • American Warehouses
  • Avison Young Inc.
  • CBRE Group Inc.
  • Central Storage and Warehouse Co.
  • Colliers International Group
  • EastGroup Properties Inc.
  • First Industrial Realty Trust
  • GLP Pte Ltd.
  • Lee and Associates Licensing
  • Prologis Inc.
  • Radius Commercial Real Estate
  • Rexford Industrial Realty Inc.
  • Royal Commercial Real Estate LLC
  • Saltbox
  • Segro Plc
  • STAG Industrial Inc.
  • Transwestern Commercial Services
  • Warehouses Plus

Qualitative and quantitative analysis of companies has been conducted to help clients understand the wider business environment as well as the strengths and weaknesses of key industry players. Data is qualitatively analyzed to categorize companies as pure play, category-focused, industry-focused, and diversified; it is quantitatively analyzed to categorize companies as dominant, leading, strong, tentative, and weak.

Recent Development and News in Storage and warehouse leasing market

  • In the Diversified Support Services industry, the shift toward sustainable supply network reconfiguration has driven a 35% increase in demand for certified carbon-neutral facilities, directly impacting Storage And Warehouse Leasing demand by accelerating the modernization of aging industrial portfolios.
  • The rapid deployment of automated material handling within outsourced logistics contracts requires upgraded structural specifications such as reinforced floors and higher power capacities, compelling developers to retrofit existing warehouse space utilization capabilities.
  • Tightening environmental regulations surrounding urban logistics footprint expansion have limited new greenfield construction permits in metropolitan zones, thereby increasing the value and rental rates of existing Class A industrial assets by up to 18%.
  • Widespread logistics automation integration among third-party supply chain operators necessitates the leasing of larger specialized infill distribution hubs to accommodate robotic picking systems and achieve a 25% reduction in manual order processing times.

Dive into Technavio’s robust research methodology, blending expert interviews, extensive data synthesis, and validated models for unparalleled Storage And Warehouse Leasing Market insights. See full methodology.

Market Scope
Page number 298
Base year 2025
Historic period 2020-2024
Forecast period 2026-2030
Growth momentum & CAGR Accelerate at a CAGR of 7.8%
Market growth 2026-2030 USD 122728.2 million
Market structure Fragmented
YoY growth 2025-2026(%) 7.6%
Key countries US, Canada, Mexico, China, Japan, India, Australia, South Korea, Singapore, Germany, UK, France, The Netherlands, Italy, Spain, Brazil, Argentina, Colombia, Saudi Arabia, UAE, South Africa, Turkey and Egypt
Competitive landscape Leading Companies, Market Positioning of Companies, Competitive Strategies, and Industry Risks

Request Free Sample

Research Analyst Overview

  • The Storage And Warehouse Leasing Market is experiencing profound structural modernization as operational mandates shift toward highly engineered distribution environments. Boardroom-level decisions regarding capital expenditure are increasingly focused on retrofitting facilities to support the deployment of an automated storage retrieval system and autonomous mobile robots.
  • This technological integration is critical for maximizing vertical space through an advanced pallet racking system while mitigating the impacts of structural labor shortages. Strategically the establishment of a robust cross docking station within a broader freight forwarding network allows enterprises to bypass long-term storage achieving a 35% reduction in inbound-to-outbound processing time.
  • Furthermore to combat persistent supply disruptions procurement executives are authorizing significant facility expansions to accommodate increased inventory buffer stock. The implementation of internet of things sensors across these leased properties ensures real-time environmental monitoring and strict regulatory alignment for sensitive goods.
  • By transitioning to these highly responsive data-enabled properties supply chain operators directly enhance their logistical agility and secure distinct competitive advantages in a fiercely contested distribution landscape.

What are the Key Data Covered in this Storage And Warehouse Leasing Market Research and Growth Report?

  • What is the expected growth of the Storage And Warehouse Leasing Market between 2026 and 2030?

    • USD 122.73 billion, at a CAGR of 7.8%

  • What segmentation does the market report cover?

    • The report is segmented by Type (Non-climate controlled, and Climate controlled), End-user (Manufacturing, Retail, Consumer goods, Food and beverages, and Others), Ownership (Large and medium enterprises, and Small enterprises) and Geography (North America, APAC, Europe, South America, Middle East and Africa)

  • Which regions are analyzed in the report?

    • North America, APAC, Europe, South America and Middle East and Africa

  • What are the key growth drivers and market challenges?

    • Proliferation of e-commerce and omnichannel retail, Scarcity of land and escalating development costs

  • Who are the major players in the Storage And Warehouse Leasing Market?

    • Adwise Realty LLP, Agility Global PLC, American Warehouses, Avison Young Inc., CBRE Group Inc., Central Storage and Warehouse Co., Colliers International Group, EastGroup Properties Inc., First Industrial Realty Trust, GLP Pte Ltd., Lee and Associates Licensing, Prologis Inc., Radius Commercial Real Estate, Rexford Industrial Realty Inc., Royal Commercial Real Estate LLC, Saltbox, Segro Plc, STAG Industrial Inc., Transwestern Commercial Services and Warehouses Plus

Market Research Insights

  • The Storage And Warehouse Leasing Market is undergoing rapid transformation as enterprises strategically enhance their distribution network density to meet accelerating delivery expectations. Businesses are prioritizing logistics hub proximity resulting in a 28% reduction in last-mile transit times compared to decentralized models.
  • To optimize inventory management operators are increasingly leveraging flexible storage term agreements which have improved facility throughput capacity by 15% through superior seasonal adaptability. Furthermore the integration of advanced sorting infrastructure has generated a 22% improvement in overall operational accuracy.
  • These strategic real estate investments empower organizations to build resilient highly responsive supply chains while mitigating the financial risks associated with rigid long-term capital commitments.

We can help! Our analysts can customize this storage and warehouse leasing market research report to meet your requirements.

Get in touch

1. Executive Summary

1.1 Market overview

Executive Summary - Chart on Market Overview
Executive Summary - Data Table on Market Overview
Executive Summary - Chart on Global Market Characteristics
Executive Summary - Chart on Market by Geography
Executive Summary - Chart on Market Segmentation by Type
Executive Summary - Chart on Market Segmentation by End-user
Executive Summary - Chart on Market Segmentation by Ownership
Executive Summary - Chart on Incremental Growth
Executive Summary - Data Table on Incremental Growth
Executive Summary - Chart on Company Market Positioning

2. Technavio Analysis

2.1 Analysis of price sensitivity, lifecycle, customer purchase basket, adoption rates, and purchase criteria

2.2 Criticality of inputs and Factors of differentiation

Chart on Overview on criticality of inputs and factors of differentiation

2.3 Factors of disruption

Chart on Overview on factors of disruption

2.4 Impact of drivers and challenges

Chart on Impact of drivers and challenges in 2025 and 2030

3. Market Landscape

3.1 Market ecosystem

Chart on Parent Market
Data Table on - Parent Market

3.2 Market characteristics

Chart on Market characteristics analysis

3.3 Value chain analysis

Chart on Value chain analysis

4. Market Sizing

4.1 Market definition

Data Table on Offerings of companies included in the market definition

4.2 Market segment analysis

Market segments

4.3 Market size 2025

4.4 Market outlook: Forecast for 2025-2030

Chart on Global - Market size and forecast 2025-2030 ($ million)
Data Table on Global - Market size and forecast 2025-2030 ($ million)
Chart on Global Market: Year-over-year growth 2025-2030 (%)
Data Table on Global Market: Year-over-year growth 2025-2030 (%)

5. Historic Market Size

5.1 Global Storage And Warehouse Leasing Market 2020 - 2024

Historic Market Size - Data Table on Global Storage And Warehouse Leasing Market 2020 - 2024 ($ million)

5.2 Type segment analysis 2020 - 2024

Historic Market Size - Type Segment 2020 - 2024 ($ million)

5.3 End-user segment analysis 2020 - 2024

Historic Market Size - End-user Segment 2020 - 2024 ($ million)

5.4 Ownership segment analysis 2020 - 2024

Historic Market Size - Ownership Segment 2020 - 2024 ($ million)

5.5 Geography segment analysis 2020 - 2024

Historic Market Size - Geography Segment 2020 - 2024 ($ million)

5.6 Country segment analysis 2020 - 2024

Historic Market Size - Country Segment 2020 - 2024 ($ million)

6. Qualitative Analysis

6.1 Impact of AI on Global Storage and Warehouse Leasing Market

6.2 Impact of Geopolitical Conflicts on Global Storage and Warehouse Leasing Market

7. Five Forces Analysis

7.1 Five forces summary

Five forces analysis - Comparison between 2025 and 2030

7.2 Bargaining power of buyers

Bargaining power of buyers - Impact of key factors 2025 and 2030

7.3 Bargaining power of suppliers

Bargaining power of suppliers - Impact of key factors in 2025 and 2030

7.4 Threat of new entrants

Threat of new entrants - Impact of key factors in 2025 and 2030

7.5 Threat of substitutes

Threat of substitutes - Impact of key factors in 2025 and 2030

7.6 Threat of rivalry

Threat of rivalry - Impact of key factors in 2025 and 2030

7.7 Market condition

Chart on Market condition - Five forces 2025 and 2030

8. Market Segmentation by Type

8.1 Market segments

Chart on Type - Market share 2025-2030 (%)
Data Table on Type - Market share 2025-2030 (%)

8.2 Comparison by Type

Chart on Comparison by Type
Data Table on Comparison by Type

8.3 Non-climate controlled - Market size and forecast 2025-2030

Chart on Non-climate controlled - Market size and forecast 2025-2030 ($ million)
Data Table on Non-climate controlled - Market size and forecast 2025-2030 ($ million)
Chart on Non-climate controlled - Year-over-year growth 2025-2030 (%)
Data Table on Non-climate controlled - Year-over-year growth 2025-2030 (%)

8.4 Climate controlled - Market size and forecast 2025-2030

Chart on Climate controlled - Market size and forecast 2025-2030 ($ million)
Data Table on Climate controlled - Market size and forecast 2025-2030 ($ million)
Chart on Climate controlled - Year-over-year growth 2025-2030 (%)
Data Table on Climate controlled - Year-over-year growth 2025-2030 (%)

8.5 Market opportunity by Type

Market opportunity by Type ($ million)
Data Table on Market opportunity by Type ($ million)

9. Market Segmentation by End-user

9.1 Market segments

Chart on End-user - Market share 2025-2030 (%)
Data Table on End-user - Market share 2025-2030 (%)

9.2 Comparison by End-user

Chart on Comparison by End-user
Data Table on Comparison by End-user

9.3 Manufacturing - Market size and forecast 2025-2030

Chart on Manufacturing - Market size and forecast 2025-2030 ($ million)
Data Table on Manufacturing - Market size and forecast 2025-2030 ($ million)
Chart on Manufacturing - Year-over-year growth 2025-2030 (%)
Data Table on Manufacturing - Year-over-year growth 2025-2030 (%)

9.4 Retail - Market size and forecast 2025-2030

Chart on Retail - Market size and forecast 2025-2030 ($ million)
Data Table on Retail - Market size and forecast 2025-2030 ($ million)
Chart on Retail - Year-over-year growth 2025-2030 (%)
Data Table on Retail - Year-over-year growth 2025-2030 (%)

9.5 Consumer goods - Market size and forecast 2025-2030

Chart on Consumer goods - Market size and forecast 2025-2030 ($ million)
Data Table on Consumer goods - Market size and forecast 2025-2030 ($ million)
Chart on Consumer goods - Year-over-year growth 2025-2030 (%)
Data Table on Consumer goods - Year-over-year growth 2025-2030 (%)

9.6 Food and beverages - Market size and forecast 2025-2030

Chart on Food and beverages - Market size and forecast 2025-2030 ($ million)
Data Table on Food and beverages - Market size and forecast 2025-2030 ($ million)
Chart on Food and beverages - Year-over-year growth 2025-2030 (%)
Data Table on Food and beverages - Year-over-year growth 2025-2030 (%)

9.7 Others - Market size and forecast 2025-2030

Chart on Others - Market size and forecast 2025-2030 ($ million)
Data Table on Others - Market size and forecast 2025-2030 ($ million)
Chart on Others - Year-over-year growth 2025-2030 (%)
Data Table on Others - Year-over-year growth 2025-2030 (%)

9.8 Market opportunity by End-user

Market opportunity by End-user ($ million)
Data Table on Market opportunity by End-user ($ million)

10. Market Segmentation by Ownership

10.1 Market segments

Chart on Ownership - Market share 2025-2030 (%)
Data Table on Ownership - Market share 2025-2030 (%)

10.2 Comparison by Ownership

Chart on Comparison by Ownership
Data Table on Comparison by Ownership

10.3 Large and medium enterprises - Market size and forecast 2025-2030

Chart on Large and medium enterprises - Market size and forecast 2025-2030 ($ million)
Data Table on Large and medium enterprises - Market size and forecast 2025-2030 ($ million)
Chart on Large and medium enterprises - Year-over-year growth 2025-2030 (%)
Data Table on Large and medium enterprises - Year-over-year growth 2025-2030 (%)

10.4 Small enterprises - Market size and forecast 2025-2030

Chart on Small enterprises - Market size and forecast 2025-2030 ($ million)
Data Table on Small enterprises - Market size and forecast 2025-2030 ($ million)
Chart on Small enterprises - Year-over-year growth 2025-2030 (%)
Data Table on Small enterprises - Year-over-year growth 2025-2030 (%)

10.5 Market opportunity by Ownership

Market opportunity by Ownership ($ million)
Data Table on Market opportunity by Ownership ($ million)

11. Customer Landscape

11.1 Customer landscape overview

Analysis of price sensitivity, lifecycle, customer purchase basket, adoption rates, and purchase criteria

12. Geographic Landscape

12.1 Geographic segmentation

Chart on Market share by geography 2025-2030 (%)
Data Table on Market share by geography 2025-2030 (%)

12.2 Geographic comparison

Chart on Geographic comparison
Data Table on Geographic comparison

12.3 North America - Market size and forecast 2025-2030

Chart on North America - Market size and forecast 2025-2030 ($ million)
Data Table on North America - Market size and forecast 2025-2030 ($ million)
Chart on North America - Year-over-year growth 2025-2030 (%)
Data Table on North America - Year-over-year growth 2025-2030 (%)
Chart on Regional Comparison - North America
Data Table on Regional Comparison - North America

12.3.1 US - Market size and forecast 2025-2030

Chart on US - Market size and forecast 2025-2030 ($ million)
Data Table on US - Market size and forecast 2025-2030 ($ million)
Chart on US - Year-over-year growth 2025-2030 (%)
Data Table on US - Year-over-year growth 2025-2030 (%)

12.3.2 Canada - Market size and forecast 2025-2030

Chart on Canada - Market size and forecast 2025-2030 ($ million)
Data Table on Canada - Market size and forecast 2025-2030 ($ million)
Chart on Canada - Year-over-year growth 2025-2030 (%)
Data Table on Canada - Year-over-year growth 2025-2030 (%)

12.3.3 Mexico - Market size and forecast 2025-2030

Chart on Mexico - Market size and forecast 2025-2030 ($ million)
Data Table on Mexico - Market size and forecast 2025-2030 ($ million)
Chart on Mexico - Year-over-year growth 2025-2030 (%)
Data Table on Mexico - Year-over-year growth 2025-2030 (%)

12.4 APAC - Market size and forecast 2025-2030

Chart on APAC - Market size and forecast 2025-2030 ($ million)
Data Table on APAC - Market size and forecast 2025-2030 ($ million)
Chart on APAC - Year-over-year growth 2025-2030 (%)
Data Table on APAC - Year-over-year growth 2025-2030 (%)
Chart on Regional Comparison - APAC
Data Table on Regional Comparison - APAC

12.4.1 China - Market size and forecast 2025-2030

Chart on China - Market size and forecast 2025-2030 ($ million)
Data Table on China - Market size and forecast 2025-2030 ($ million)
Chart on China - Year-over-year growth 2025-2030 (%)
Data Table on China - Year-over-year growth 2025-2030 (%)

12.4.2 Japan - Market size and forecast 2025-2030

Chart on Japan - Market size and forecast 2025-2030 ($ million)
Data Table on Japan - Market size and forecast 2025-2030 ($ million)
Chart on Japan - Year-over-year growth 2025-2030 (%)
Data Table on Japan - Year-over-year growth 2025-2030 (%)

12.4.3 India - Market size and forecast 2025-2030

Chart on India - Market size and forecast 2025-2030 ($ million)
Data Table on India - Market size and forecast 2025-2030 ($ million)
Chart on India - Year-over-year growth 2025-2030 (%)
Data Table on India - Year-over-year growth 2025-2030 (%)

12.4.4 Australia - Market size and forecast 2025-2030

Chart on Australia - Market size and forecast 2025-2030 ($ million)
Data Table on Australia - Market size and forecast 2025-2030 ($ million)
Chart on Australia - Year-over-year growth 2025-2030 (%)
Data Table on Australia - Year-over-year growth 2025-2030 (%)

12.4.5 South Korea - Market size and forecast 2025-2030

Chart on South Korea - Market size and forecast 2025-2030 ($ million)
Data Table on South Korea - Market size and forecast 2025-2030 ($ million)
Chart on South Korea - Year-over-year growth 2025-2030 (%)
Data Table on South Korea - Year-over-year growth 2025-2030 (%)

12.4.6 Singapore - Market size and forecast 2025-2030

Chart on Singapore - Market size and forecast 2025-2030 ($ million)
Data Table on Singapore - Market size and forecast 2025-2030 ($ million)
Chart on Singapore - Year-over-year growth 2025-2030 (%)
Data Table on Singapore - Year-over-year growth 2025-2030 (%)

12.5 Europe - Market size and forecast 2025-2030

Chart on Europe - Market size and forecast 2025-2030 ($ million)
Data Table on Europe - Market size and forecast 2025-2030 ($ million)
Chart on Europe - Year-over-year growth 2025-2030 (%)
Data Table on Europe - Year-over-year growth 2025-2030 (%)
Chart on Regional Comparison - Europe
Data Table on Regional Comparison - Europe

12.5.1 Germany - Market size and forecast 2025-2030

Chart on Germany - Market size and forecast 2025-2030 ($ million)
Data Table on Germany - Market size and forecast 2025-2030 ($ million)
Chart on Germany - Year-over-year growth 2025-2030 (%)
Data Table on Germany - Year-over-year growth 2025-2030 (%)

12.5.2 UK - Market size and forecast 2025-2030

Chart on UK - Market size and forecast 2025-2030 ($ million)
Data Table on UK - Market size and forecast 2025-2030 ($ million)
Chart on UK - Year-over-year growth 2025-2030 (%)
Data Table on UK - Year-over-year growth 2025-2030 (%)

12.5.3 France - Market size and forecast 2025-2030

Chart on France - Market size and forecast 2025-2030 ($ million)
Data Table on France - Market size and forecast 2025-2030 ($ million)
Chart on France - Year-over-year growth 2025-2030 (%)
Data Table on France - Year-over-year growth 2025-2030 (%)

12.5.4 The Netherlands - Market size and forecast 2025-2030

Chart on The Netherlands - Market size and forecast 2025-2030 ($ million)
Data Table on The Netherlands - Market size and forecast 2025-2030 ($ million)
Chart on The Netherlands - Year-over-year growth 2025-2030 (%)
Data Table on The Netherlands - Year-over-year growth 2025-2030 (%)

12.5.5 Italy - Market size and forecast 2025-2030

Chart on Italy - Market size and forecast 2025-2030 ($ million)
Data Table on Italy - Market size and forecast 2025-2030 ($ million)
Chart on Italy - Year-over-year growth 2025-2030 (%)
Data Table on Italy - Year-over-year growth 2025-2030 (%)

12.5.6 Spain - Market size and forecast 2025-2030

Chart on Spain - Market size and forecast 2025-2030 ($ million)
Data Table on Spain - Market size and forecast 2025-2030 ($ million)
Chart on Spain - Year-over-year growth 2025-2030 (%)
Data Table on Spain - Year-over-year growth 2025-2030 (%)

12.6 South America - Market size and forecast 2025-2030

Chart on South America - Market size and forecast 2025-2030 ($ million)
Data Table on South America - Market size and forecast 2025-2030 ($ million)
Chart on South America - Year-over-year growth 2025-2030 (%)
Data Table on South America - Year-over-year growth 2025-2030 (%)
Chart on Regional Comparison - South America
Data Table on Regional Comparison - South America

12.6.1 Brazil - Market size and forecast 2025-2030

Chart on Brazil - Market size and forecast 2025-2030 ($ million)
Data Table on Brazil - Market size and forecast 2025-2030 ($ million)
Chart on Brazil - Year-over-year growth 2025-2030 (%)
Data Table on Brazil - Year-over-year growth 2025-2030 (%)

12.6.2 Argentina - Market size and forecast 2025-2030

Chart on Argentina - Market size and forecast 2025-2030 ($ million)
Data Table on Argentina - Market size and forecast 2025-2030 ($ million)
Chart on Argentina - Year-over-year growth 2025-2030 (%)
Data Table on Argentina - Year-over-year growth 2025-2030 (%)

12.6.3 Colombia - Market size and forecast 2025-2030

Chart on Colombia - Market size and forecast 2025-2030 ($ million)
Data Table on Colombia - Market size and forecast 2025-2030 ($ million)
Chart on Colombia - Year-over-year growth 2025-2030 (%)
Data Table on Colombia - Year-over-year growth 2025-2030 (%)

12.7 Middle East and Africa - Market size and forecast 2025-2030

Chart on Middle East and Africa - Market size and forecast 2025-2030 ($ million)
Data Table on Middle East and Africa - Market size and forecast 2025-2030 ($ million)
Chart on Middle East and Africa - Year-over-year growth 2025-2030 (%)
Data Table on Middle East and Africa - Year-over-year growth 2025-2030 (%)
Chart on Regional Comparison - Middle East and Africa
Data Table on Regional Comparison - Middle East and Africa

12.7.1 Saudi Arabia - Market size and forecast 2025-2030

Chart on Saudi Arabia - Market size and forecast 2025-2030 ($ million)
Data Table on Saudi Arabia - Market size and forecast 2025-2030 ($ million)
Chart on Saudi Arabia - Year-over-year growth 2025-2030 (%)
Data Table on Saudi Arabia - Year-over-year growth 2025-2030 (%)

12.7.2 UAE - Market size and forecast 2025-2030

Chart on UAE - Market size and forecast 2025-2030 ($ million)
Data Table on UAE - Market size and forecast 2025-2030 ($ million)
Chart on UAE - Year-over-year growth 2025-2030 (%)
Data Table on UAE - Year-over-year growth 2025-2030 (%)

12.7.3 South Africa - Market size and forecast 2025-2030

Chart on South Africa - Market size and forecast 2025-2030 ($ million)
Data Table on South Africa - Market size and forecast 2025-2030 ($ million)
Chart on South Africa - Year-over-year growth 2025-2030 (%)
Data Table on South Africa - Year-over-year growth 2025-2030 (%)

12.7.4 Turkey - Market size and forecast 2025-2030

Chart on Turkey - Market size and forecast 2025-2030 ($ million)
Data Table on Turkey - Market size and forecast 2025-2030 ($ million)
Chart on Turkey - Year-over-year growth 2025-2030 (%)
Data Table on Turkey - Year-over-year growth 2025-2030 (%)

12.7.5 Egypt - Market size and forecast 2025-2030

Chart on Egypt - Market size and forecast 2025-2030 ($ million)
Data Table on Egypt - Market size and forecast 2025-2030 ($ million)
Chart on Egypt - Year-over-year growth 2025-2030 (%)
Data Table on Egypt - Year-over-year growth 2025-2030 (%)

12.8 Market opportunity by geography

Market opportunity by geography ($ million)
Data Tables on Market opportunity by geography ($ million)

13. Drivers, Challenges, and Opportunity

13.1 Market drivers

Proliferation of e-commerce and omnichannel retail
Strategic focus on supply chain resilience and modernization
Accelerated adoption of automation and technology

13.2 Market challenges

Scarcity of land and escalating development costs
Persistent labor shortages and rising operational costs
Technological integration and risk of obsolescence

13.3 Impact of drivers and challenges

Impact of drivers and challenges in 2025 and 2030

13.4 Market opportunities

Rise of multi-story warehousing in urban centers
Increasing emphasis on sustainability and ESG compliance
Emergence of flexible and on-demand warehousing models

14. Competitive Landscape

14.1 Overview

14.2

Overview on criticality of inputs and factors of differentiation

14.3 Landscape disruption

Overview on factors of disruption

14.4 Industry risks

Impact of key risks on business

15. Competitive Analysis

15.1 Companies profiled

Companies covered

15.2 Company ranking index

15.3 Market positioning of companies

Matrix on companies position and classification

15.4 Agility Global PLC

Agility Global PLC - Overview
Agility Global PLC - Business segments
Agility Global PLC - Key offerings
Agility Global PLC - Segment focus
SWOT

15.5 Avison Young Inc.

Avison Young Inc. - Overview
Avison Young Inc. - Product / Service
Avison Young Inc. - Key offerings
SWOT

15.6 CBRE Group Inc.

CBRE Group Inc. - Overview
CBRE Group Inc. - Business segments
CBRE Group Inc. - Key offerings
CBRE Group Inc. - Segment focus
SWOT

15.7 Central Storage and Warehouse Co.

Central Storage and Warehouse Co. - Overview
Central Storage and Warehouse Co. - Product / Service
Central Storage and Warehouse Co. - Key offerings
SWOT

15.8 Colliers International Group

Colliers International Group - Overview
Colliers International Group - Business segments
Colliers International Group - Key offerings
Colliers International Group - Segment focus
SWOT

15.9 EastGroup Properties Inc.

EastGroup Properties Inc. - Overview
EastGroup Properties Inc. - Product / Service
EastGroup Properties Inc. - Key offerings
SWOT

15.10 First Industrial Realty Trust

First Industrial Realty Trust - Overview
First Industrial Realty Trust - Product / Service
First Industrial Realty Trust - Key offerings
SWOT

15.11 GLP Pte Ltd.

GLP Pte Ltd. - Overview
GLP Pte Ltd. - Product / Service
GLP Pte Ltd. - Key offerings
SWOT

15.12 Lee and Associates Licensing

Lee and Associates Licensing - Overview
Lee and Associates Licensing - Product / Service
Lee and Associates Licensing - Key offerings
SWOT

15.13 Prologis Inc.

Prologis Inc. - Overview
Prologis Inc. - Business segments
Prologis Inc. - Key offerings
Prologis Inc. - Segment focus
SWOT

15.14 Rexford Industrial Realty Inc.

Rexford Industrial Realty Inc. - Overview
Rexford Industrial Realty Inc. - Product / Service
Rexford Industrial Realty Inc. - Key offerings
SWOT

15.15 Saltbox

Saltbox - Overview
Saltbox - Product / Service
Saltbox - Key offerings
SWOT

15.16 Segro Plc

Segro Plc - Overview
Segro Plc - Business segments
Segro Plc - Key offerings
Segro Plc - Segment focus
SWOT

15.17 STAG Industrial Inc.

STAG Industrial Inc. - Overview
STAG Industrial Inc. - Product / Service
STAG Industrial Inc. - Key offerings
SWOT

15.18 Transwestern Commercial Services

Transwestern Commercial Services - Overview
Transwestern Commercial Services - Product / Service
Transwestern Commercial Services - Key offerings
SWOT

16. Appendix

16.1 Scope of the report

Market definition
Objectives
Notes and caveats

16.2 Inclusions and exclusions checklist

Inclusions checklist
Exclusions checklist

16.3 Currency conversion rates for US$

16.4 Research methodology

16.5 Data procurement

Information sources

16.6 Data validation

16.7 Validation techniques employed for market sizing

16.8 Data synthesis

16.9 360 degree market analysis

16.10 List of abbreviations

Research Methodology

Technavio presents a detailed picture of the market by way of study, synthesis, and summation of data from multiple sources. The analysts have presented the various facets of the market with a particular focus on identifying the key industry influencers. The data thus presented is comprehensive, reliable, and the result of extensive research, both primary and secondary.

INFORMATION SOURCES

Primary sources

  • Manufacturers and suppliers
  • Channel partners
  • Industry experts
  • Strategic decision makers

Secondary sources

  • Industry journals and periodicals
  • Government data
  • Financial reports of key industry players
  • Historical data
  • Press releases

DATA ANALYSIS

Data Synthesis

  • Collation of data
  • Estimation of key figures
  • Analysis of derived insights

Data Validation

  • Triangulation with data models
  • Reference against proprietary databases
  • Corroboration with industry experts

REPORT WRITING

Qualitative

  • Market drivers
  • Market challenges
  • Market trends
  • Five forces analysis

Quantitative

  • Market size and forecast
  • Market segmentation
  • Geographical insights
  • Competitive landscape

Interested in this report?

Get your sample now to see our research methodology and insights!

Download Now

Frequently Asked Questions

Storage And Warehouse Leasing market growth will increase by USD 122728.2 million during 2026-2030.

The Storage And Warehouse Leasing market is expected to grow at a CAGR of 7.8% during 2026-2030.

Storage And Warehouse Leasing market is segmented by Type (Non-climate controlled, Climate controlled) End-user (Manufacturing, Retail, Consumer goods, Food and beverages, Others) Ownership (Large and medium enterprises, Small enterprises)

Adwise Realty LLP, Agility Global PLC, American Warehouses, Avison Young Inc., CBRE Group Inc., Central Storage and Warehouse Co., Colliers International Group, EastGroup Properties Inc., First Industrial Realty Trust, GLP Pte Ltd., Lee and Associates Licensing, Prologis Inc., Radius Commercial Real Estate, Rexford Industrial Realty Inc., Royal Commercial Real Estate LLC, Saltbox, Segro Plc, STAG Industrial Inc., Transwestern Commercial Services, Warehouses Plus are a few of the key vendors in the Storage And Warehouse Leasing market.

North America will register the highest growth rate of 39.1% among the other regions. Therefore, the Storage And Warehouse Leasing market in North America is expected to garner significant business opportunities for the vendors during the forecast period.

US, Canada, Mexico, China, Japan, India, Australia, South Korea, Singapore, Germany, UK, France, The Netherlands, Italy, Spain, Brazil, Argentina, Colombia, Saudi Arabia, UAE, South Africa, Turkey, Egypt

  • Proliferation of e-commerce and omnichannel retail is the driving factor this market.

The Storage And Warehouse Leasing market vendors should focus on grabbing business opportunities from the Type segment as it accounted for the largest market share in the base year.
RIA - Research AI Assistant
Ask RIA
