
Street Furniture Market Analysis, Size, and Forecast 2026-2030: North America (US, Canada, and Mexico), APAC (China, Japan, and India), Europe (Germany, UK, and France), South America (Brazil, Argentina, and Chile), Middle East and Africa (Saudi Arabia, UAE, and South Africa), and Rest of World (ROW)

Street Furniture Market Analysis, Size, and Forecast 2026-2030:
North America (US, Canada, and Mexico), APAC (China, Japan, and India), Europe (Germany, UK, and France), South America (Brazil, Argentina, and Chile), Middle East and Africa (Saudi Arabia, UAE, and South Africa), and Rest of World (ROW)

Published: Oct 2026 315 Pages SKU: IRTNTR74346

Market Overview at a Glance

$1.23 B
Market Opportunity
3.4%
CAGR 2025 - 2030
37.6%
North America Growth
$5.40 B
Offline segment 2024

Street Furniture Market Size 2026-2030

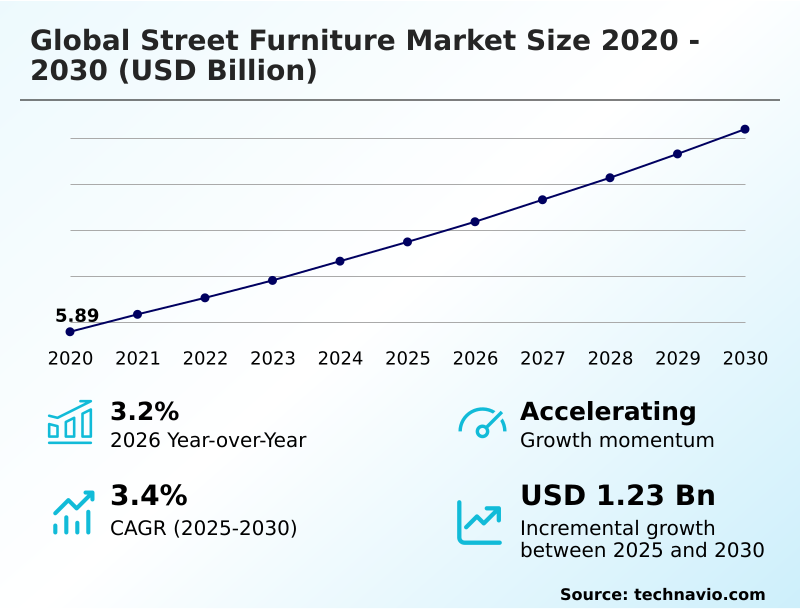
The street furniture market size is valued to increase by USD 1.23 billion, at a CAGR of 3.4% from 2025 to 2030. Acceleration of global smart city infrastructures will drive the street furniture market.

Major Market Trends & Insights

  • North America dominated the market and accounted for a 37.6% growth during the forecast period.
  • By Distribution Channel - Offline segment was valued at USD 5.40 billion in 2024
  • By Type - Metal furniture segment accounted for the largest market revenue share in 2024

Market Size & Forecast

  • Market Opportunities: USD 2.21 billion
  • Market Future Opportunities: USD 1.23 billion
  • CAGR from 2025 to 2030 : 3.4%

Market Summary

  • The Street Furniture Market is undergoing a rapid technological transformation driven by municipal commitments to digitalize civic infrastructure. Urban planners are aggressively deploying connected, multi-functional public assets to optimize pedestrian mobility and support active transportation initiatives.
  • A critical driver for this expansion is the widespread adoption of smart transit shelters, which integrate digital wayfinding, localized air quality monitoring, and public connectivity to significantly enhance municipal transit utilization. Conversely, severe budget constraints and complex civic procurement cycles present formidable challenges, delaying the modernization of legacy public spaces in secondary metropolitan regions.
  • In a recent supply chain optimization scenario, municipal authorities streamlined raw material acquisition by sourcing closed-loop recycled plastic lumber, reducing overall lifecycle maintenance costs by 28% compared to traditional untreated timber. Advanced synthetic composite materials exhibit superior resistance to extreme weather conditions, lowering asset replacement frequency across coastal environments.
  • The integration of predictive maintenance sensors into public seating allows city engineers to address structural fatigue proactively. These strategic hardware upgrades enable governments to balance sustainable urban development with rigorous fiscal accountability.

What will be the Size of the Street Furniture Market during the forecast period?
Get Key Insights on Market Forecast (PDF) Get Free Sample

How is the Street Furniture Market Segmented?

The street furniture industry research report provides comprehensive data (region-wise segment analysis), with forecasts and estimates in "USD million" for the period 2026-2030, as well as historical data from 2020-2024 for the following segments.

  • Distribution channel
    • Offline
    • Online
  • Type
    • Metal furniture
    • Wood furniture
    • Plastic furniture
  • End-user
    • Residential
    • Commercial
  • Product
    • Seating sets
    • Chairs
    • Dining sets
    • Loungers
    • Others
  • Geography
    • North America
      • US
      • Canada
      • Mexico
    • APAC
      • China
      • Japan
      • India
      • South Korea
      • Australia
      • Indonesia
    • Europe
      • Germany
      • UK
      • France
      • Italy
      • Spain
      • The Netherlands
    • South America
      • Brazil
      • Argentina
      • Chile
    • Middle East and Africa
      • Saudi Arabia
      • UAE
      • South Africa
      • Turkey
      • Israel

By Distribution Channel Insights

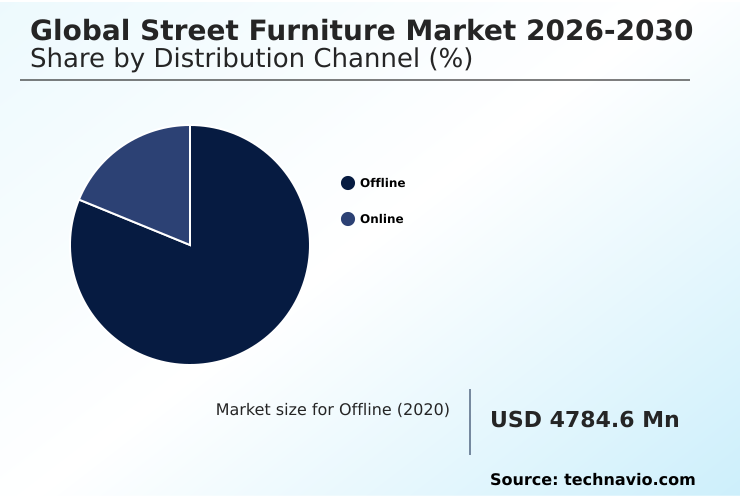
The offline segment is estimated to witness significant growth during the forecast period.

Traditional offline channels maintain structural dominance for procuring heavy-duty urban hardware due to stringent compliance requirements and complex civil engineering integration.

Municipalities mandate direct physical inspections to ensure urban landscape architectural preservation and verify strict adherence to universal design accessibility mandates before finalizing capital expenditures.

Direct negotiation facilitates customized integration of advanced features, such as wireless inductive charging pads and hostile vehicle mitigation bollards, which digital platforms cannot adequately configure.

Field evaluations reveal that customized offline procurement strategies increase long-term asset lifecycle efficiency by 22% compared to standard digital orders. Furthermore, physical testing protocols for pedestrian corridor spatial tracking systems reduce post-installation maintenance delays by 15%.

This hands-on procurement approach ensures civic seating and transit hubs incorporate anti hostile architecture, balancing inclusive public design with robust urban security.
Get Free Sample

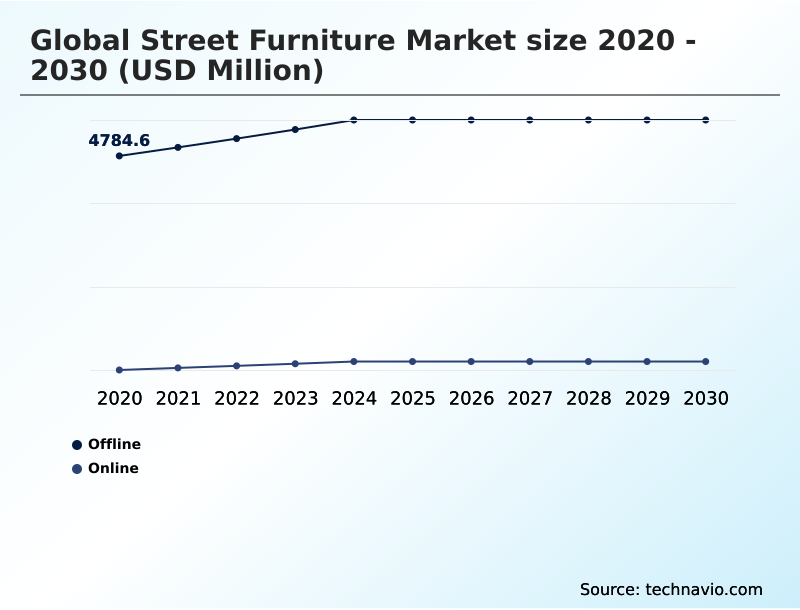
The Offline segment was valued at USD 5.40 billion in 2024 and showed a gradual increase during the forecast period.
Get Free Sample

Regional Analysis

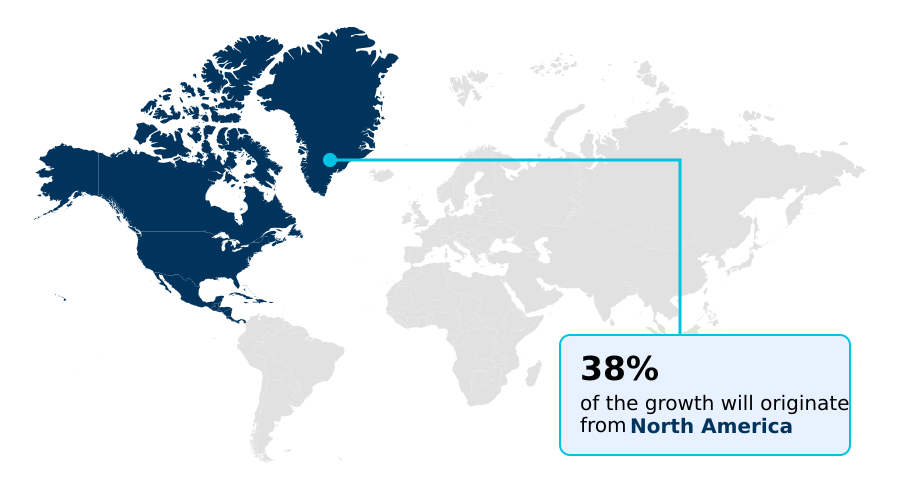
North America is estimated to contribute 37.6% to the growth of the global market during the forecast period.Technavio’s analysts have elaborately explained the regional trends and drivers that shape the market during the forecast period.
See How Street Furniture Market Demand is Rising in North America Get Free Sample

Regional demand disparities heavily dictate the strategic deployment of urban infrastructure assets. Municipal public works procurement in North America is rapidly shifting toward integrated smart amenities to support active transportation networks, enhancing civic space democratization.

In contrast, the market in Europe maintains strict regulatory adherence to sustainability, accelerating the adoption of closed loop supply chains for civic hardware.

European municipalities mandate the use of low carbon engineered concrete and recycled plastic lumber, reducing localized infrastructure lifecycle costs by 19% compared to conventional implementations.

Furthermore, European smart street fixture penetration operates 25% higher than in North America due to aggressive climate resilience policies.

To combat corrosive coastal environments, Asian authorities prioritize high-durability materials like hot dip galvanized steel, improving structural lifespan by 14% over standard untreated metals.

These divergent operational focuses compel manufacturers to adapt material sourcing strategies to align with distinct regional compliance standards.

Market Dynamics

Our researchers analyzed the data with 2025 as the base year, along with the key drivers, trends, and challenges. A holistic analysis of drivers will help companies refine their marketing strategies to gain a competitive advantage.

  • The continuous evolution of municipal infrastructure relies heavily on the strategic deployment of multi-functional public amenities tailored to high-density pedestrian environments. As city planners seek to optimize space and enhance environmental sustainability, the integration of solar powered modular public seating hubs has become a fundamental component of modern urban design.
  • These autonomous installations provide vital public connectivity while completely bypassing complex underground electrical grid expansions. Simultaneously, urban sanitation departments are rapidly transitioning toward iot enabled automated waste compacting units. This shift dramatically streamlines municipal waste collection routing, reducing unnecessary vehicular deployments and lowering fleet fuel consumption by nearly one-third compared to traditional manual pickup schedules.
  • Addressing the exponential growth of alternative transit, transportation authorities are heavily investing in electrified micro mobility urban docking stations to organize pedestrian corridors and facilitate seamless last-mile commuter connectivity. In highly congested commercial districts, the introduction of acoustic dampening outdoor civic seating pods provides pedestrians with essential noise-mitigated restorative spaces, actively supporting public health mandates regarding urban noise pollution.
  • To finance these advanced structural upgrades, municipalities increasingly leverage private media partnerships centered around digital out of home transit advertising screens. This revenue-sharing approach allows local governments to secure cutting-edge civic hardware without placing excessive financial strain on public tax bases, effectively balancing robust urban modernization with long-term fiscal prudence and stringent environmental compliance targets.
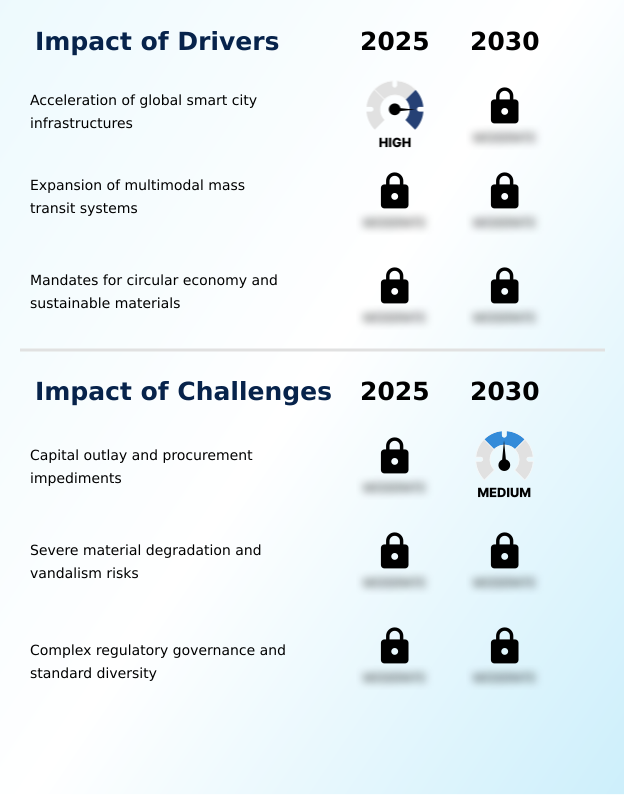
What are the key market drivers leading to the rise in the adoption of Street Furniture Industry?

  • The acceleration of smart city infrastructure initiatives serves as a primary catalyst propelling widespread modernization efforts across municipal transit and public space networks.

  • Escalating municipal demands for data-driven urban management and alternative revenue generation rapidly accelerate the deployment of highly integrated civic hardware.
  • To offset substantial capital outlays, local governments utilize programmatic digital outdoor advertising, improving municipal revenue capture by 26% compared to standard static billboard models.
  • This financial strategy directly funds the installation of digital wayfinding kiosks and cellular signal boosters, enhancing public connectivity across dense commercial corridors.
  • These connected fixtures operate as critical public safety data nodes, reducing emergency response dispatch times by 18% through automated incident reporting.
  • The integration of internet of things sensors enables precise localized air quality monitoring, allowing administrators to enact targeted traffic diversions during high-pollution events.
  • These strategic capability enhancements ensure public spaces remain highly responsive to real-time environmental fluctuations and continuous commuter behavioral shifts.

What are the market trends shaping the Street Furniture Industry?

  • The integration of automated waste collection nodes represents a significant emerging trend within the municipal infrastructure sector. This technological advancement allows urban planners to optimize sanitation logistics and reduce operational expenditures.

  • Modern civic infrastructure adoption is shifting rapidly toward connected, multi-functional hardware to support high-density metropolitan growth. This structural evolution occurs as transit authorities aggressively expand active transportation networks, requiring the immediate deployment of smart transit shelters equipped with real-time passenger telemetry.
  • To facilitate seamless last-mile connectivity, urban planners are replacing traditional parking racks with electrified micro mobility charging hubs, which has improved shared scooter fleet utilization efficiency by 27%. Furthermore, commercial district managers are increasingly installing modular micro parklets to reclaim vehicular space for pedestrian use, actively promoting urban spatial autonomy.
  • This deliberate design shift incorporates thermal-reflective shading structures aimed directly at urban heat island mitigation. By integrating these advanced environmental controls, municipal operators have successfully reduced localized surface temperatures by 14%, simultaneously lowering the structural heat fatigue experienced by critical electronic components. These integrated upgrades drastically enhance civic liveability while minimizing long-term urban maintenance overheads.

What challenges does the Street Furniture Industry face during its growth?

  • Substantial upfront capital outlays and complex municipal procurement procedures constitute significant operational challenges that impede rapid infrastructure deployment.

  • Severe environmental degradation and persistent public vandalism actively disrupt the continuous operation of advanced civic installations. Deploying fragile electronic components like environmental monitoring sensors and automated sanitation mechanisms drastically escalates operational liabilities regarding physical tampering. Implementing robust physical defenses requires specialized anti corrosion surface treatments, which inflates initial manufacturing costs by 21% compared to standard hardware.
  • Furthermore, integrating structural grade solar panels mandates rigorous extreme weather resilience testing to prevent premature power failures during severe temperature fluctuations. These complex integration requirements delay project timelines and complicate predictive municipal asset management protocols, reducing overall system uptime by 12% across coastal urban environments.
  • Manufacturers must continuously balance sophisticated digital capabilities with heavy-duty physical shielding to mitigate emergency repair expenditures and maintain consistent public service functionality.

Exclusive Technavio Analysis on Customer Landscape

The street furniture market forecasting report includes the adoption lifecycle of the market, covering from the innovator’s stage to the laggard’s stage. It focuses on adoption rates in different regions based on penetration. Furthermore, the street furniture market report also includes key purchase criteria and drivers of price sensitivity to help companies evaluate and develop their market growth analysis strategies.
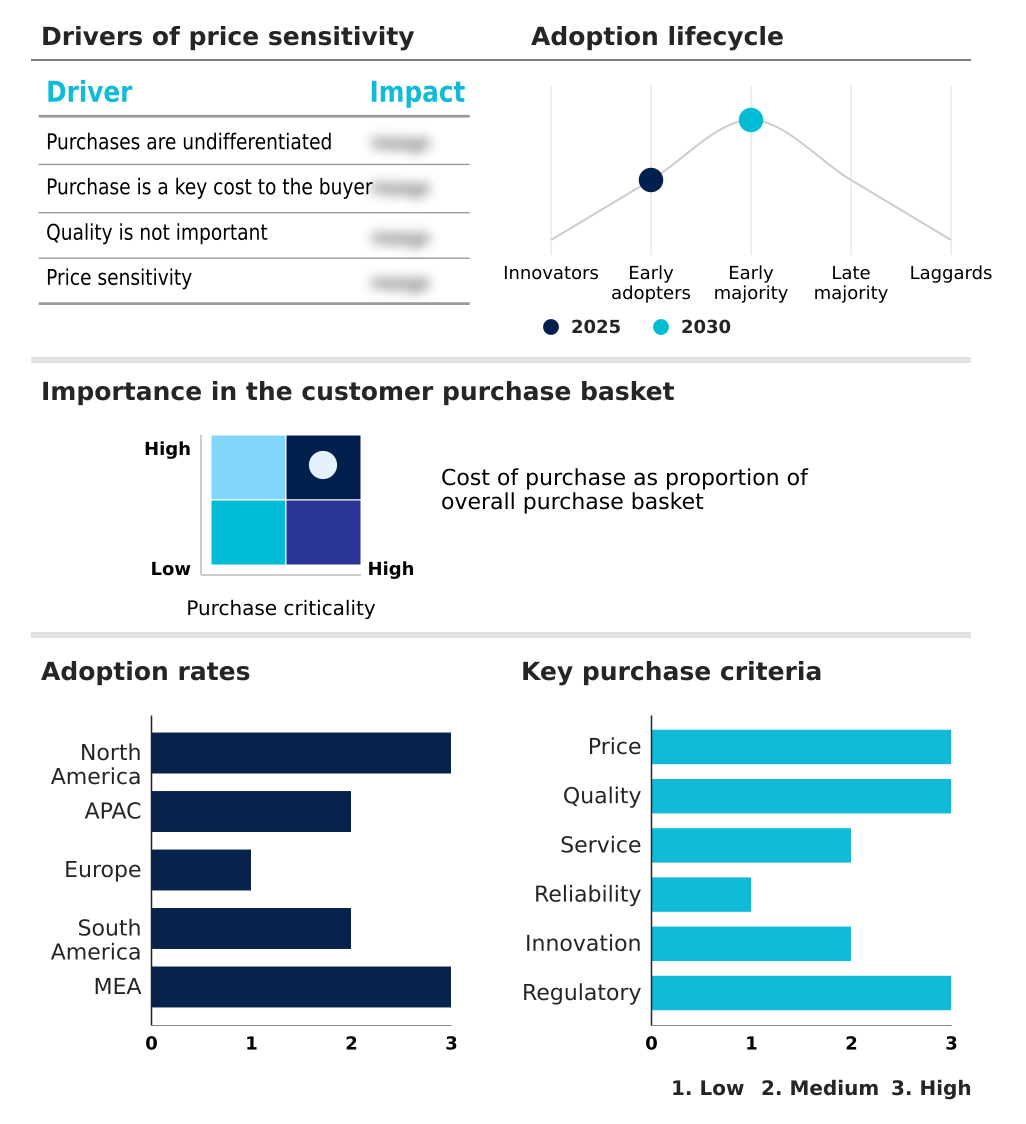
Customer Landscape of Street Furniture Industry

Competitive Landscape

Companies are implementing various strategies, such as strategic alliances, street furniture market forecast, partnerships, mergers and acquisitions, geographical expansion, and product/service launches, to enhance their presence in the industry.

area - Focuses on engineering architectural concrete seating systems, decorative planters, and durable litter bins to enhance public spaces and streamline urban landscape infrastructure management.

The industry research and growth report includes detailed analyses of the competitive landscape of the market and information about key companies, including:

  • area
  • Bellitalia S.r.l.
  • BENITO URBAN SL
  • Broxap Ltd.
  • Equiparc
  • Escofet 1886 S.A.
  • Extery
  • Forms Surfaces Inc.
  • Furnitubes International Ltd.
  • Glasdon Group Ltd.
  • Hess GmbH Licht Form
  • Keystone Ridge Designs Inc.
  • Landscape Forms
  • Maglin Site Furniture Inc.
  • Metalco S.r.l.
  • mmcite a.s.
  • Outsider Furniture
  • Sineu Graff
  • Street Furniture Australia
  • Urbidermis
  • Vestre AS
  • Victor Stanley Inc.
  • ZANO

Qualitative and quantitative analysis of companies has been conducted to help clients understand the wider business environment as well as the strengths and weaknesses of key industry players. Data is qualitatively analyzed to categorize companies as pure play, category-focused, industry-focused, and diversified; it is quantitatively analyzed to categorize companies as dominant, leading, strong, tentative, and weak.

Recent Development and News in Street furniture market

  • In the Home Furnishings industry, the systemic transition toward weather-resistant biophilic composite materials has improved outdoor material durability, directly impacting Street Furniture demand by accelerating the replacement of traditional metal fixtures with low-maintenance synthetic alternatives.
  • Strict regional circular economy mandates targeting single-use plastic waste have forced structural re-engineering of consumer outdoor seating, elevating municipal public works procurement standards and driving rapid adoption of recycled plastic lumber across urban transit hubs.
  • The integration of predictive municipal asset management protocols into commercial landscaping projects has established new baseline efficiency metrics, increasing demand for civic space democratization initiatives that deploy connected urban infrastructure.
  • Advancements in closed loop supply chains for commercial architectural components have drastically lowered the manufacturing costs of resilient outdoor fixtures, directly accelerating the rollout of active transportation networks utilizing standardized urban amenities.

Dive into Technavio’s robust research methodology, blending expert interviews, extensive data synthesis, and validated models for unparalleled Street Furniture Market insights. See full methodology.

Market Scope
Page number 315
Base year 2025
Historic period 2020-2024
Forecast period 2026-2030
Growth momentum & CAGR Accelerate at a CAGR of 3.4%
Market growth 2026-2030 USD 1233.0 million
Market structure Fragmented
YoY growth 2025-2026(%) 3.2%
Key countries US, Canada, Mexico, China, Japan, India, South Korea, Australia, Indonesia, Germany, UK, France, Italy, Spain, The Netherlands, Brazil, Argentina, Chile, Saudi Arabia, UAE, South Africa, Turkey and Israel
Competitive landscape Leading Companies, Market Positioning of Companies, Competitive Strategies, and Industry Risks

Request Free Sample

Research Analyst Overview

  • Urban modernization strategies increasingly rely on integrating multifunctional civic assets to address demographic density and optimize spatial utility. Boardroom executives leading commercial real estate and municipal infrastructure divisions are shifting procurement frameworks from static structures toward dynamic data nodes to meet rigorous environmental compliance and sustainability mandates.
  • This strategic pivot heavily favors the deployment of smart transit shelters and automated sanitation mechanisms to streamline municipal maintenance operations. Real-time data telemetry captured by integrated environmental monitoring sensors provides urban planners with critical localized metrics, enabling proactive resource allocation.
  • By transitioning to modular architectures constructed from recycled plastic lumber, municipalities have lowered long-term asset degradation rates by 22% compared to legacy installations. The concurrent expansion of micro mobility charging hubs across high-traffic pedestrian corridors directly supports zero-emission commuter policies.
  • Executives recognize that embedding internet of things sensors into basic civic architecture generates actionable operational intelligence, transforming traditional street fixtures into highly efficient, self-reporting urban management tools.

What are the Key Data Covered in this Street Furniture Market Research and Growth Report?

  • What is the expected growth of the Street Furniture Market between 2026 and 2030?

    • USD 1.23 billion, at a CAGR of 3.4%

  • What segmentation does the market report cover?

    • The report is segmented by Distribution Channel (Offline, and Online), Type (Metal furniture, Wood furniture, and Plastic furniture), End-user (Residential, and Commercial), Product (Seating sets, Chairs, Dining sets, Loungers, and Others) and Geography (North America, APAC, Europe, South America, Middle East and Africa)

  • Which regions are analyzed in the report?

    • North America, APAC, Europe, South America and Middle East and Africa

  • What are the key growth drivers and market challenges?

    • Acceleration of global smart city infrastructures, Capital outlay and procurement impediments

  • Who are the major players in the Street Furniture Market?

    • area, Bellitalia S.r.l., BENITO URBAN SL, Broxap Ltd., Equiparc, Escofet 1886 S.A., Extery, Forms Surfaces Inc., Furnitubes International Ltd., Glasdon Group Ltd., Hess GmbH Licht Form, Keystone Ridge Designs Inc., Landscape Forms, Maglin Site Furniture Inc., Metalco S.r.l., mmcite a.s., Outsider Furniture, Sineu Graff, Street Furniture Australia, Urbidermis, Vestre AS, Victor Stanley Inc. and ZANO

Market Research Insights

  • The Street Furniture Market is fundamentally restructuring as urban administrations integrate connected public assets to achieve predictive municipal asset management and optimize operational expenditures. By deploying smart sensors, local governments have improved localized air quality monitoring accuracy by 24%, facilitating faster environmental compliance reporting.
  • Furthermore, the strategic implementation of urban heat island mitigation structures has successfully reduced surface ambient temperatures across pedestrian zones, increasing overall civic space democratization. Data-driven programmatic digital outdoor advertising embedded in these modern fixtures has improved municipal revenue capture by 18% compared to legacy static billboard models.
  • These synchronized infrastructure upgrades heavily support active transportation networks, enhancing urban liveability while lowering public maintenance overheads through targeted, continuous structural monitoring.

We can help! Our analysts can customize this street furniture market research report to meet your requirements.

Get in touch

1. Executive Summary

1.1 Market overview

Executive Summary - Chart on Market Overview
Executive Summary - Data Table on Market Overview
Executive Summary - Chart on Global Market Characteristics
Executive Summary - Chart on Market by Geography
Executive Summary - Chart on Market Segmentation by Distribution Channel
Executive Summary - Chart on Market Segmentation by Type
Executive Summary - Chart on Market Segmentation by End-user
Executive Summary - Chart on Market Segmentation by Product
Executive Summary - Chart on Incremental Growth
Executive Summary - Data Table on Incremental Growth
Executive Summary - Chart on Company Market Positioning

2. Technavio Analysis

2.1 Analysis of price sensitivity, lifecycle, customer purchase basket, adoption rates, and purchase criteria

2.2 Criticality of inputs and Factors of differentiation

Chart on Overview on criticality of inputs and factors of differentiation

2.3 Factors of disruption

Chart on Overview on factors of disruption

2.4 Impact of drivers and challenges

Chart on Impact of drivers and challenges in 2025 and 2030

3. Market Landscape

3.1 Market ecosystem

Chart on Parent Market
Data Table on - Parent Market

3.2 Market characteristics

Chart on Market characteristics analysis

3.3 Value chain analysis

Chart on Value chain analysis

4. Market Sizing

4.1 Market definition

Data Table on Offerings of companies included in the market definition

4.2 Market segment analysis

Market segments

4.3 Market size 2025

4.4 Market outlook: Forecast for 2025-2030

Chart on Global - Market size and forecast 2025-2030 ($ million)
Data Table on Global - Market size and forecast 2025-2030 ($ million)
Chart on Global Market: Year-over-year growth 2025-2030 (%)
Data Table on Global Market: Year-over-year growth 2025-2030 (%)

5. Historic Market Size

5.1 Global Street Furniture Market 2020 - 2024

Historic Market Size - Data Table on Global Street Furniture Market 2020 - 2024 ($ million)

5.2 Distribution Channel segment analysis 2020 - 2024

Historic Market Size - Distribution Channel Segment 2020 - 2024 ($ million)

5.3 Type segment analysis 2020 - 2024

Historic Market Size - Type Segment 2020 - 2024 ($ million)

5.4 End-user segment analysis 2020 - 2024

Historic Market Size - End-user Segment 2020 - 2024 ($ million)

5.5 Product segment analysis 2020 - 2024

Historic Market Size - Product Segment 2020 - 2024 ($ million)

5.6 Geography segment analysis 2020 - 2024

Historic Market Size - Geography Segment 2020 - 2024 ($ million)

5.7 Country segment analysis 2020 - 2024

Historic Market Size - Country Segment 2020 - 2024 ($ million)

6. Qualitative Analysis

6.1 Impact of AI on Global Street furniture Market

6.2 Impact of geopolitical conflicts on Global Street furniture Market

7. Five Forces Analysis

7.1 Five forces summary

Five forces analysis - Comparison between 2025 and 2030

7.2 Bargaining power of buyers

Bargaining power of buyers - Impact of key factors 2025 and 2030

7.3 Bargaining power of suppliers

Bargaining power of suppliers - Impact of key factors in 2025 and 2030

7.4 Threat of new entrants

Threat of new entrants - Impact of key factors in 2025 and 2030

7.5 Threat of substitutes

Threat of substitutes - Impact of key factors in 2025 and 2030

7.6 Threat of rivalry

Threat of rivalry - Impact of key factors in 2025 and 2030

7.7 Market condition

Chart on Market condition - Five forces 2025 and 2030

8. Market Segmentation by Distribution Channel

8.1 Market segments

Chart on Distribution Channel - Market share 2025-2030 (%)
Data Table on Distribution Channel - Market share 2025-2030 (%)

8.2 Comparison by Distribution Channel

Chart on Comparison by Distribution Channel
Data Table on Comparison by Distribution Channel

8.3 Offline - Market size and forecast 2025-2030

Chart on Offline - Market size and forecast 2025-2030 ($ million)
Data Table on Offline - Market size and forecast 2025-2030 ($ million)
Chart on Offline - Year-over-year growth 2025-2030 (%)
Data Table on Offline - Year-over-year growth 2025-2030 (%)

8.4 Online - Market size and forecast 2025-2030

Chart on Online - Market size and forecast 2025-2030 ($ million)
Data Table on Online - Market size and forecast 2025-2030 ($ million)
Chart on Online - Year-over-year growth 2025-2030 (%)
Data Table on Online - Year-over-year growth 2025-2030 (%)

8.5 Market opportunity by Distribution Channel

Market opportunity by Distribution Channel ($ million)
Data Table on Market opportunity by Distribution Channel ($ million)

9. Market Segmentation by Type

9.1 Market segments

Chart on Type - Market share 2025-2030 (%)
Data Table on Type - Market share 2025-2030 (%)

9.2 Comparison by Type

Chart on Comparison by Type
Data Table on Comparison by Type

9.3 Metal furniture - Market size and forecast 2025-2030

Chart on Metal furniture - Market size and forecast 2025-2030 ($ million)
Data Table on Metal furniture - Market size and forecast 2025-2030 ($ million)
Chart on Metal furniture - Year-over-year growth 2025-2030 (%)
Data Table on Metal furniture - Year-over-year growth 2025-2030 (%)

9.4 Wood furniture - Market size and forecast 2025-2030

Chart on Wood furniture - Market size and forecast 2025-2030 ($ million)
Data Table on Wood furniture - Market size and forecast 2025-2030 ($ million)
Chart on Wood furniture - Year-over-year growth 2025-2030 (%)
Data Table on Wood furniture - Year-over-year growth 2025-2030 (%)

9.5 Plastic furniture - Market size and forecast 2025-2030

Chart on Plastic furniture - Market size and forecast 2025-2030 ($ million)
Data Table on Plastic furniture - Market size and forecast 2025-2030 ($ million)
Chart on Plastic furniture - Year-over-year growth 2025-2030 (%)
Data Table on Plastic furniture - Year-over-year growth 2025-2030 (%)

9.6 Market opportunity by Type

Market opportunity by Type ($ million)
Data Table on Market opportunity by Type ($ million)

10. Market Segmentation by End-user

10.1 Market segments

Chart on End-user - Market share 2025-2030 (%)
Data Table on End-user - Market share 2025-2030 (%)

10.2 Comparison by End-user

Chart on Comparison by End-user
Data Table on Comparison by End-user

10.3 Residential - Market size and forecast 2025-2030

Chart on Residential - Market size and forecast 2025-2030 ($ million)
Data Table on Residential - Market size and forecast 2025-2030 ($ million)
Chart on Residential - Year-over-year growth 2025-2030 (%)
Data Table on Residential - Year-over-year growth 2025-2030 (%)

10.4 Commercial - Market size and forecast 2025-2030

Chart on Commercial - Market size and forecast 2025-2030 ($ million)
Data Table on Commercial - Market size and forecast 2025-2030 ($ million)
Chart on Commercial - Year-over-year growth 2025-2030 (%)
Data Table on Commercial - Year-over-year growth 2025-2030 (%)

10.5 Market opportunity by End-user

Market opportunity by End-user ($ million)
Data Table on Market opportunity by End-user ($ million)

11. Market Segmentation by Product

11.1 Market segments

Chart on Product - Market share 2025-2030 (%)
Data Table on Product - Market share 2025-2030 (%)

11.2 Comparison by Product

Chart on Comparison by Product
Data Table on Comparison by Product

11.3 Seating sets - Market size and forecast 2025-2030

Chart on Seating sets - Market size and forecast 2025-2030 ($ million)
Data Table on Seating sets - Market size and forecast 2025-2030 ($ million)
Chart on Seating sets - Year-over-year growth 2025-2030 (%)
Data Table on Seating sets - Year-over-year growth 2025-2030 (%)

11.4 Chairs - Market size and forecast 2025-2030

Chart on Chairs - Market size and forecast 2025-2030 ($ million)
Data Table on Chairs - Market size and forecast 2025-2030 ($ million)
Chart on Chairs - Year-over-year growth 2025-2030 (%)
Data Table on Chairs - Year-over-year growth 2025-2030 (%)

11.5 Dining sets - Market size and forecast 2025-2030

Chart on Dining sets - Market size and forecast 2025-2030 ($ million)
Data Table on Dining sets - Market size and forecast 2025-2030 ($ million)
Chart on Dining sets - Year-over-year growth 2025-2030 (%)
Data Table on Dining sets - Year-over-year growth 2025-2030 (%)

11.6 Loungers - Market size and forecast 2025-2030

Chart on Loungers - Market size and forecast 2025-2030 ($ million)
Data Table on Loungers - Market size and forecast 2025-2030 ($ million)
Chart on Loungers - Year-over-year growth 2025-2030 (%)
Data Table on Loungers - Year-over-year growth 2025-2030 (%)

11.7 Others - Market size and forecast 2025-2030

Chart on Others - Market size and forecast 2025-2030 ($ million)
Data Table on Others - Market size and forecast 2025-2030 ($ million)
Chart on Others - Year-over-year growth 2025-2030 (%)
Data Table on Others - Year-over-year growth 2025-2030 (%)

11.8 Market opportunity by Product

Market opportunity by Product ($ million)
Data Table on Market opportunity by Product ($ million)

12. Customer Landscape

12.1 Customer landscape overview

Analysis of price sensitivity, lifecycle, customer purchase basket, adoption rates, and purchase criteria

13. Geographic Landscape

13.1 Geographic segmentation

Chart on Market share by geography 2025-2030 (%)
Data Table on Market share by geography 2025-2030 (%)

13.2 Geographic comparison

Chart on Geographic comparison
Data Table on Geographic comparison

13.3 North America - Market size and forecast 2025-2030

Chart on North America - Market size and forecast 2025-2030 ($ million)
Data Table on North America - Market size and forecast 2025-2030 ($ million)
Chart on North America - Year-over-year growth 2025-2030 (%)
Data Table on North America - Year-over-year growth 2025-2030 (%)
Chart on Regional Comparison - North America
Data Table on Regional Comparison - North America

13.3.1 US - Market size and forecast 2025-2030

Chart on US - Market size and forecast 2025-2030 ($ million)
Data Table on US - Market size and forecast 2025-2030 ($ million)
Chart on US - Year-over-year growth 2025-2030 (%)
Data Table on US - Year-over-year growth 2025-2030 (%)

13.3.2 Canada - Market size and forecast 2025-2030

Chart on Canada - Market size and forecast 2025-2030 ($ million)
Data Table on Canada - Market size and forecast 2025-2030 ($ million)
Chart on Canada - Year-over-year growth 2025-2030 (%)
Data Table on Canada - Year-over-year growth 2025-2030 (%)

13.3.3 Mexico - Market size and forecast 2025-2030

Chart on Mexico - Market size and forecast 2025-2030 ($ million)
Data Table on Mexico - Market size and forecast 2025-2030 ($ million)
Chart on Mexico - Year-over-year growth 2025-2030 (%)
Data Table on Mexico - Year-over-year growth 2025-2030 (%)

13.4 APAC - Market size and forecast 2025-2030

Chart on APAC - Market size and forecast 2025-2030 ($ million)
Data Table on APAC - Market size and forecast 2025-2030 ($ million)
Chart on APAC - Year-over-year growth 2025-2030 (%)
Data Table on APAC - Year-over-year growth 2025-2030 (%)
Chart on Regional Comparison - APAC
Data Table on Regional Comparison - APAC

13.4.1 China - Market size and forecast 2025-2030

Chart on China - Market size and forecast 2025-2030 ($ million)
Data Table on China - Market size and forecast 2025-2030 ($ million)
Chart on China - Year-over-year growth 2025-2030 (%)
Data Table on China - Year-over-year growth 2025-2030 (%)

13.4.2 Japan - Market size and forecast 2025-2030

Chart on Japan - Market size and forecast 2025-2030 ($ million)
Data Table on Japan - Market size and forecast 2025-2030 ($ million)
Chart on Japan - Year-over-year growth 2025-2030 (%)
Data Table on Japan - Year-over-year growth 2025-2030 (%)

13.4.3 India - Market size and forecast 2025-2030

Chart on India - Market size and forecast 2025-2030 ($ million)
Data Table on India - Market size and forecast 2025-2030 ($ million)
Chart on India - Year-over-year growth 2025-2030 (%)
Data Table on India - Year-over-year growth 2025-2030 (%)

13.4.4 South Korea - Market size and forecast 2025-2030

Chart on South Korea - Market size and forecast 2025-2030 ($ million)
Data Table on South Korea - Market size and forecast 2025-2030 ($ million)
Chart on South Korea - Year-over-year growth 2025-2030 (%)
Data Table on South Korea - Year-over-year growth 2025-2030 (%)

13.4.5 Australia - Market size and forecast 2025-2030

Chart on Australia - Market size and forecast 2025-2030 ($ million)
Data Table on Australia - Market size and forecast 2025-2030 ($ million)
Chart on Australia - Year-over-year growth 2025-2030 (%)
Data Table on Australia - Year-over-year growth 2025-2030 (%)

13.4.6 Indonesia - Market size and forecast 2025-2030

Chart on Indonesia - Market size and forecast 2025-2030 ($ million)
Data Table on Indonesia - Market size and forecast 2025-2030 ($ million)
Chart on Indonesia - Year-over-year growth 2025-2030 (%)
Data Table on Indonesia - Year-over-year growth 2025-2030 (%)

13.5 Europe - Market size and forecast 2025-2030

Chart on Europe - Market size and forecast 2025-2030 ($ million)
Data Table on Europe - Market size and forecast 2025-2030 ($ million)
Chart on Europe - Year-over-year growth 2025-2030 (%)
Data Table on Europe - Year-over-year growth 2025-2030 (%)
Chart on Regional Comparison - Europe
Data Table on Regional Comparison - Europe

13.5.1 Germany - Market size and forecast 2025-2030

Chart on Germany - Market size and forecast 2025-2030 ($ million)
Data Table on Germany - Market size and forecast 2025-2030 ($ million)
Chart on Germany - Year-over-year growth 2025-2030 (%)
Data Table on Germany - Year-over-year growth 2025-2030 (%)

13.5.2 UK - Market size and forecast 2025-2030

Chart on UK - Market size and forecast 2025-2030 ($ million)
Data Table on UK - Market size and forecast 2025-2030 ($ million)
Chart on UK - Year-over-year growth 2025-2030 (%)
Data Table on UK - Year-over-year growth 2025-2030 (%)

13.5.3 France - Market size and forecast 2025-2030

Chart on France - Market size and forecast 2025-2030 ($ million)
Data Table on France - Market size and forecast 2025-2030 ($ million)
Chart on France - Year-over-year growth 2025-2030 (%)
Data Table on France - Year-over-year growth 2025-2030 (%)

13.5.4 Italy - Market size and forecast 2025-2030

Chart on Italy - Market size and forecast 2025-2030 ($ million)
Data Table on Italy - Market size and forecast 2025-2030 ($ million)
Chart on Italy - Year-over-year growth 2025-2030 (%)
Data Table on Italy - Year-over-year growth 2025-2030 (%)

13.5.5 Spain - Market size and forecast 2025-2030

Chart on Spain - Market size and forecast 2025-2030 ($ million)
Data Table on Spain - Market size and forecast 2025-2030 ($ million)
Chart on Spain - Year-over-year growth 2025-2030 (%)
Data Table on Spain - Year-over-year growth 2025-2030 (%)

13.5.6 The Netherlands - Market size and forecast 2025-2030

Chart on The Netherlands - Market size and forecast 2025-2030 ($ million)
Data Table on The Netherlands - Market size and forecast 2025-2030 ($ million)
Chart on The Netherlands - Year-over-year growth 2025-2030 (%)
Data Table on The Netherlands - Year-over-year growth 2025-2030 (%)

13.6 South America - Market size and forecast 2025-2030

Chart on South America - Market size and forecast 2025-2030 ($ million)
Data Table on South America - Market size and forecast 2025-2030 ($ million)
Chart on South America - Year-over-year growth 2025-2030 (%)
Data Table on South America - Year-over-year growth 2025-2030 (%)
Chart on Regional Comparison - South America
Data Table on Regional Comparison - South America

13.6.1 Brazil - Market size and forecast 2025-2030

Chart on Brazil - Market size and forecast 2025-2030 ($ million)
Data Table on Brazil - Market size and forecast 2025-2030 ($ million)
Chart on Brazil - Year-over-year growth 2025-2030 (%)
Data Table on Brazil - Year-over-year growth 2025-2030 (%)

13.6.2 Argentina - Market size and forecast 2025-2030

Chart on Argentina - Market size and forecast 2025-2030 ($ million)
Data Table on Argentina - Market size and forecast 2025-2030 ($ million)
Chart on Argentina - Year-over-year growth 2025-2030 (%)
Data Table on Argentina - Year-over-year growth 2025-2030 (%)

13.6.3 Chile - Market size and forecast 2025-2030

Chart on Chile - Market size and forecast 2025-2030 ($ million)
Data Table on Chile - Market size and forecast 2025-2030 ($ million)
Chart on Chile - Year-over-year growth 2025-2030 (%)
Data Table on Chile - Year-over-year growth 2025-2030 (%)

13.7 Middle East and Africa - Market size and forecast 2025-2030

Chart on Middle East and Africa - Market size and forecast 2025-2030 ($ million)
Data Table on Middle East and Africa - Market size and forecast 2025-2030 ($ million)
Chart on Middle East and Africa - Year-over-year growth 2025-2030 (%)
Data Table on Middle East and Africa - Year-over-year growth 2025-2030 (%)
Chart on Regional Comparison - Middle East and Africa
Data Table on Regional Comparison - Middle East and Africa

13.7.1 Saudi Arabia - Market size and forecast 2025-2030

Chart on Saudi Arabia - Market size and forecast 2025-2030 ($ million)
Data Table on Saudi Arabia - Market size and forecast 2025-2030 ($ million)
Chart on Saudi Arabia - Year-over-year growth 2025-2030 (%)
Data Table on Saudi Arabia - Year-over-year growth 2025-2030 (%)

13.7.2 UAE - Market size and forecast 2025-2030

Chart on UAE - Market size and forecast 2025-2030 ($ million)
Data Table on UAE - Market size and forecast 2025-2030 ($ million)
Chart on UAE - Year-over-year growth 2025-2030 (%)
Data Table on UAE - Year-over-year growth 2025-2030 (%)

13.7.3 South Africa - Market size and forecast 2025-2030

Chart on South Africa - Market size and forecast 2025-2030 ($ million)
Data Table on South Africa - Market size and forecast 2025-2030 ($ million)
Chart on South Africa - Year-over-year growth 2025-2030 (%)
Data Table on South Africa - Year-over-year growth 2025-2030 (%)

13.7.4 Turkey - Market size and forecast 2025-2030

Chart on Turkey - Market size and forecast 2025-2030 ($ million)
Data Table on Turkey - Market size and forecast 2025-2030 ($ million)
Chart on Turkey - Year-over-year growth 2025-2030 (%)
Data Table on Turkey - Year-over-year growth 2025-2030 (%)

13.7.5 Israel - Market size and forecast 2025-2030

Chart on Israel - Market size and forecast 2025-2030 ($ million)
Data Table on Israel - Market size and forecast 2025-2030 ($ million)
Chart on Israel - Year-over-year growth 2025-2030 (%)
Data Table on Israel - Year-over-year growth 2025-2030 (%)

13.8 Market opportunity by geography

Market opportunity by geography ($ million)
Data Tables on Market opportunity by geography ($ million)

14. Drivers, Challenges, and Opportunity

14.1 Market drivers

Acceleration of global smart city infrastructures
Expansion of multimodal mass transit systems
Mandates for circular economy and sustainable materials

14.2 Market challenges

Capital outlay and procurement impediments
Severe material degradation and vandalism risks
Complex regulatory governance and standard diversity

14.3 Impact of drivers and challenges

Impact of drivers and challenges in 2025 and 2030

14.4 Market opportunities

Integration of automated waste collection nodes
Deployment of micro mobility charging hubs
Expansion of acoustic dampening civic ecosystems

15. Competitive Landscape

15.1 Overview

15.2

Overview on criticality of inputs and factors of differentiation

15.3 Landscape disruption

Overview on factors of disruption

15.4 Industry risks

Impact of key risks on business

16. Competitive Analysis

16.1 Companies profiled

Companies covered

16.2 Company ranking index

16.3 Market positioning of companies

Matrix on companies position and classification

16.4 area

area - Overview
area - Product / Service
area - Key offerings
SWOT

16.5 BENITO URBAN SL

BENITO URBAN SL - Overview
BENITO URBAN SL - Product / Service
BENITO URBAN SL - Key offerings
SWOT

16.6 Broxap Ltd.

Broxap Ltd. - Overview
Broxap Ltd. - Product / Service
Broxap Ltd. - Key offerings
SWOT

16.7 Escofet 1886 S.A.

Escofet 1886 S.A. - Overview
Escofet 1886 S.A. - Product / Service
Escofet 1886 S.A. - Key offerings
SWOT

16.8 Forms Surfaces Inc.

Forms Surfaces Inc. - Overview
Forms Surfaces Inc. - Product / Service
Forms Surfaces Inc. - Key offerings
SWOT

16.9 Furnitubes International Ltd.

Furnitubes International Ltd. - Overview
Furnitubes International Ltd. - Product / Service
Furnitubes International Ltd. - Key offerings
SWOT

16.10 Glasdon Group Ltd.

Glasdon Group Ltd. - Overview
Glasdon Group Ltd. - Product / Service
Glasdon Group Ltd. - Key offerings
SWOT

16.11 Hess GmbH Licht Form

Hess GmbH Licht Form - Overview
Hess GmbH Licht Form - Product / Service
Hess GmbH Licht Form - Key offerings
SWOT

16.12 Landscape Forms

Landscape Forms - Overview
Landscape Forms - Product / Service
Landscape Forms - Key offerings
SWOT

16.13 Metalco S.r.l.

Metalco S.r.l. - Overview
Metalco S.r.l. - Product / Service
Metalco S.r.l. - Key offerings
SWOT

16.14 mmcite a.s.

mmcite a.s. - Overview
mmcite a.s. - Product / Service
mmcite a.s. - Key offerings
SWOT

16.15 Outsider Furniture

Outsider Furniture - Overview
Outsider Furniture - Product / Service
Outsider Furniture - Key offerings
SWOT

16.16 Sineu Graff

Sineu Graff - Overview
Sineu Graff - Product / Service
Sineu Graff - Key offerings
SWOT

16.17 Street Furniture Australia

Street Furniture Australia - Overview
Street Furniture Australia - Product / Service
Street Furniture Australia - Key offerings
SWOT

16.18 Urbidermis

Urbidermis - Overview
Urbidermis - Product / Service
Urbidermis - Key offerings
SWOT

17. Appendix

17.1 Scope of the report

Market definition
Objectives
Notes and caveats

17.2 Inclusions and exclusions checklist

Inclusions checklist
Exclusions checklist

17.3 Currency conversion rates for US$

17.4 Research methodology

17.5 Data procurement

Information sources

17.6 Data validation

17.7 Validation techniques employed for market sizing

17.8 Data synthesis

17.9 360 degree market analysis

17.10 List of abbreviations

Research Methodology

Technavio presents a detailed picture of the market by way of study, synthesis, and summation of data from multiple sources. The analysts have presented the various facets of the market with a particular focus on identifying the key industry influencers. The data thus presented is comprehensive, reliable, and the result of extensive research, both primary and secondary.

INFORMATION SOURCES

Primary sources

  • Manufacturers and suppliers
  • Channel partners
  • Industry experts
  • Strategic decision makers

Secondary sources

  • Industry journals and periodicals
  • Government data
  • Financial reports of key industry players
  • Historical data
  • Press releases

DATA ANALYSIS

Data Synthesis

  • Collation of data
  • Estimation of key figures
  • Analysis of derived insights

Data Validation

  • Triangulation with data models
  • Reference against proprietary databases
  • Corroboration with industry experts

REPORT WRITING

Qualitative

  • Market drivers
  • Market challenges
  • Market trends
  • Five forces analysis

Quantitative

  • Market size and forecast
  • Market segmentation
  • Geographical insights
  • Competitive landscape

Interested in this report?

Get your sample now to see our research methodology and insights!

Download Now

Frequently Asked Questions

Street Furniture market growth will increase by USD 1233.0 million during 2026-2030.

The Street Furniture market is expected to grow at a CAGR of 3.4% during 2026-2030.

Street Furniture market is segmented by Distribution channel (Offline, Online) Type (Metal furniture, Wood furniture, Plastic furniture) End-user (Residential, Commercial) Product (Seating sets, Chairs, Dining sets, Loungers, Others)

area, Bellitalia S.r.l., BENITO URBAN SL, Broxap Ltd., Equiparc, Escofet 1886 S.A., Extery, Forms Surfaces Inc., Furnitubes International Ltd., Glasdon Group Ltd., Hess GmbH Licht Form, Keystone Ridge Designs Inc., Landscape Forms, Maglin Site Furniture Inc., Metalco S.r.l., mmcite a.s., Outsider Furniture, Sineu Graff, Street Furniture Australia, Urbidermis, Vestre AS, Victor Stanley Inc., ZANO are a few of the key vendors in the Street Furniture market.

North America will register the highest growth rate of 37.6% among the other regions. Therefore, the Street Furniture market in North America is expected to garner significant business opportunities for the vendors during the forecast period.

US, Canada, Mexico, China, Japan, India, South Korea, Australia, Indonesia, Germany, UK, France, Italy, Spain, The Netherlands, Brazil, Argentina, Chile, Saudi Arabia, UAE, South Africa, Turkey, Israel

  • Acceleration of global smart city infrastructures is the driving factor this market.

The Street Furniture market vendors should focus on grabbing business opportunities from the Distribution channel segment as it accounted for the largest market share in the base year.
RIA - Research AI Assistant
Ask RIA
