Surface Water Sports Equipment Market Analysis, Size, and Forecast 2026-2030: North America (US, Canada, and Mexico), Europe (Germany, UK, and France), APAC (China, Japan, and Australia), South America (Brazil, Argentina, and Chile), Middle East and Africa (UAE, South Africa, and Saudi Arabia), and Rest of World (ROW)

Surface Water Sports Equipment Market Analysis, Size, and Forecast 2026-2030:
North America (US, Canada, and Mexico), Europe (Germany, UK, and France), APAC (China, Japan, and Australia), South America (Brazil, Argentina, and Chile), Middle East and Africa (UAE, South Africa, and Saudi Arabia), and Rest of World (ROW)

Published: Oct 2026 316 Pages SKU: IRTNTR74248

Market Overview at a Glance

$19.58 B
Market Opportunity
9.2%
CAGR 2025 - 2030
47.9%
North America Growth
$13.08 B
Surfing segment 2024

Surface Water Sports Equipment Market Size 2026-2030

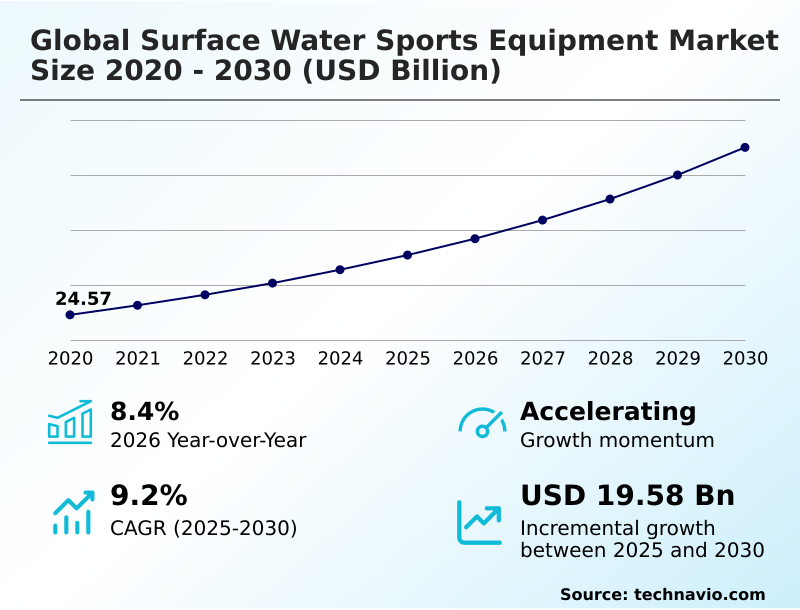
The surface water sports equipment market size is valued to increase by USD 19.58 billion, at a CAGR of 9.2% from 2025 to 2030. Surge in global coastal tourism expansion will drive the surface water sports equipment market.

Major Market Trends & Insights

  • North America dominated the market and accounted for a 47.9% growth during the forecast period.
  • By Type - Surfing segment was valued at USD 13.08 billion in 2024
  • By Product - Apparel segment accounted for the largest market revenue share in 2024

Market Size & Forecast

  • Market Opportunities: USD 30.45 billion
  • Market Future Opportunities: USD 19.58 billion
  • CAGR from 2025 to 2030 : 9.2%

Market Summary

  • The Surface Water Sports Equipment Market demonstrates robust multi-regional expansion driven by structural shifts in outdoor recreation and wellness tourism. Coastal municipalities and private hospitality groups are heavily investing in waterfront infrastructure, triggering a substantial surge in institutional equipment procurement. This structural driver accelerates demand for high-durability rental fleets, elevating equipment turnover rates.
  • For instance, resort operators adopting modular, quick-repair equipment architectures have successfully reduced fleet maintenance downtime by 22%, directly improving seasonal profitability. Despite this commercial momentum, severe freshwater and marine contamination remains a formidable challenge. Algal blooms and toxic industrial runoff frequently prompt mandatory public waterway closures, temporarily suppressing regional consumer participation and stalling localized retail sales.
  • To navigate these disruptions, manufacturers are increasingly targeting inland artificial wave facilities and controlled recreational lakes. Product strategies are simultaneously shifting toward advanced composite integration, prioritizing eco-friendly resins and lightweight thermoplastics. By balancing high-volume institutional sales with specialized technical gear for enthusiast demographics, the industry maintains resilient commercial viability amid evolving environmental complexities.

What will be the Size of the Surface Water Sports Equipment Market during the forecast period?
Get Key Insights on Market Forecast (PDF) Get Free Sample

How is the Surface Water Sports Equipment Market Segmented?

The surface water sports equipment industry research report provides comprehensive data (region-wise segment analysis), with forecasts and estimates in "USD million" for the period 2026-2030, as well as historical data from 2020-2024 for the following segments.

  • Type
    • Surfing
    • Boarding
    • Sailing
    • Skiing
    • Others
  • Product
    • Apparel
    • Equipment
    • Accessories
  • Distribution channel
    • Hypermarkets and supermarkets
    • Wholesalers and distributors
    • Exclusive stores
  • Price
    • Mass
    • Premium
  • Geography
    • North America
      • US
      • Canada
      • Mexico
    • Europe
      • Germany
      • UK
      • France
      • Italy
      • Spain
      • The Netherlands
    • APAC
      • China
      • Japan
      • Australia
      • India
      • South Korea
      • Indonesia
    • South America
      • Brazil
      • Argentina
      • Chile
    • Middle East and Africa
      • UAE
      • South Africa
      • Saudi Arabia
      • Israel
      • Turkey

By Type Insights

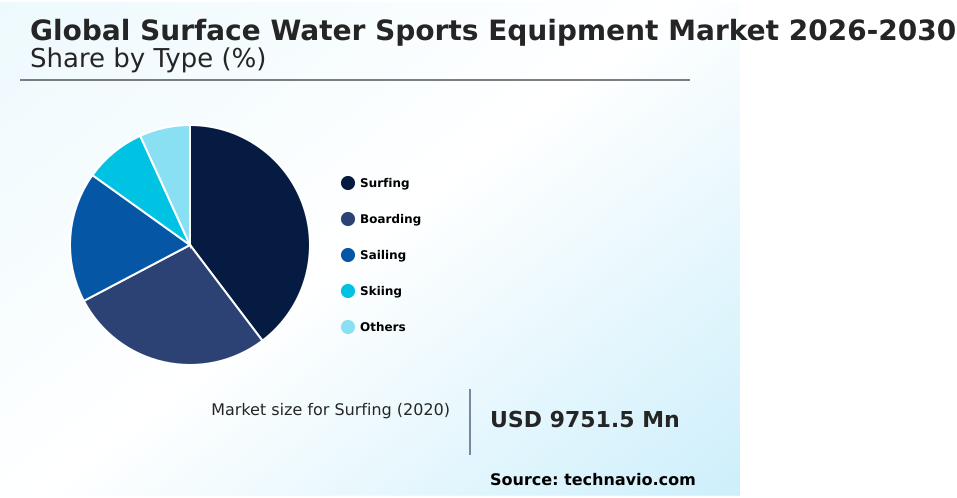
The surfing segment is estimated to witness significant growth during the forecast period.

The surfing segment within the Surface Water Sports Equipment category relies heavily on continuous material evolution and structural engineering. Manufacturers are optimizing epoxy resin hydrodynamics and carbon-fiber composite laminates to enhance board flexibility by 15%, directly improving maneuverability.

Predictive fluid dynamic simulation enables designers to refine shapes without physical prototypes, accelerating product launch cycles. Furthermore, integrating biometric telemetry sensors provides athletes with real-time performance analytics. To align with marine ecosystem preservation, brands are adopting sustainable manufacturing practices.

Concurrently, aerodynamic sail wings are crossing over into hybrid disciplines, elevating speed parameters. Beyond competitive arenas, widespread investments in coastal tourism infrastructure are expanding consumer access to aquatic fitness conditioning.

This shift is stimulating consistent institutional demand for versatile stand-up paddleboarding gear and certified watercraft flotation devices, ensuring stable inventory turnover for specialized sporting goods distributors.
Get Free Sample

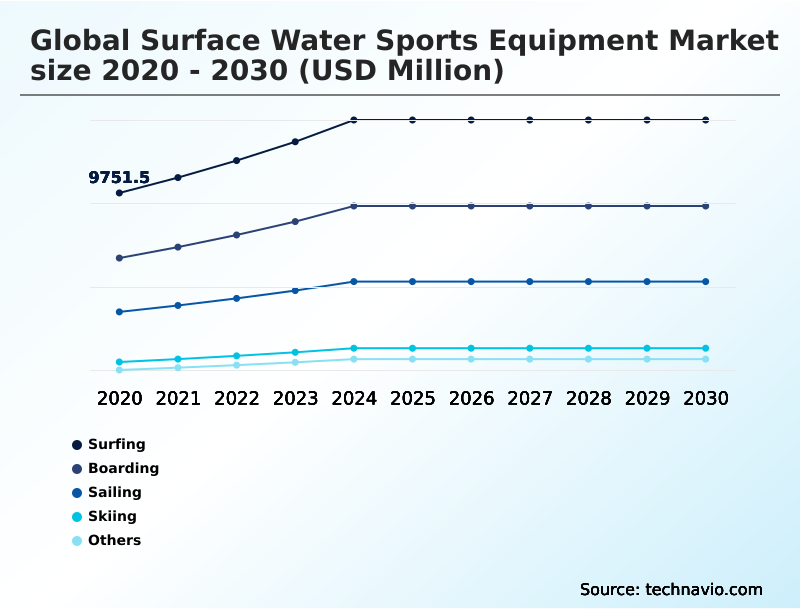
The Surfing segment was valued at USD 13.08 billion in 2024 and showed a gradual increase during the forecast period.
Get Free Sample

Regional Analysis

North America is estimated to contribute 47.9% to the growth of the global market during the forecast period.Technavio’s analysts have elaborately explained the regional trends and drivers that shape the market during the forecast period.
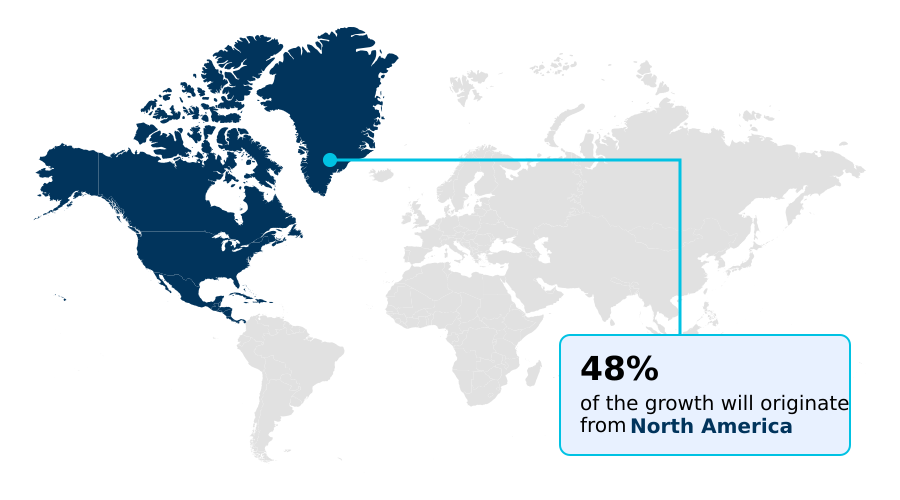
See How Surface Water Sports Equipment Market Demand is Rising in North America Get Free Sample

The geographic landscape of the Surface Water Sports Equipment sector reveals distinct regional disparities driven by infrastructure and environmental policies.

North America maintains high commercial penetration due to established inland lake recreation and active coastal networks, achieving a 20% higher equipment turnover rate compared to European markets.

In contrast, Europe heavily prioritizes sustainable material integration, utilizing high-density polyethylene and advanced thermo-welded seam technology to comply with rigorous regional circular economy standards.

Consequently, North American manufacturers focus on optimizing hydrofoil lift mechanics and hydrodynamic hull design to capture the high-margin competitive segment associated with high-performance board sports.

The adoption of advanced marine navigation electronics further differentiates premium regional offerings from mass-market recreational paddling equipment.

These distinct supply chain adaptations allow companies to align specialized hardware with localized regulatory frameworks, reducing cross-border compliance delays by 12% across varied operational jurisdictions.

Market Dynamics

Our researchers analyzed the data with 2025 as the base year, along with the key drivers, trends, and challenges. A holistic analysis of drivers will help companies refine their marketing strategies to gain a competitive advantage.

  • The operational landscape for aquatic leisure gear relies heavily on continuous material engineering and precision manufacturing. Producing high-performance carbon fiber surfboards requires meticulously controlled curing environments and specialized labor, making supply chain optimization a critical determinant of gross margins.
  • Manufacturers have observed that transitioning to localized composite fabrication can reduce logistical delays by up to 18% compared to reliant offshore sourcing models. Similarly, the widespread consumer shift toward portability has elevated the demand for drop-stitch inflatable stand-up paddleboards. This architectural shift significantly condenses warehousing requirements, yielding a 30% improvement in inventory storage efficiency and drastically lowering freight distribution expenditures.
  • Furthermore, mounting regulatory pressures regarding environmental sustainability have catalyzed the adoption of eco-friendly bio-resin watercraft materials. Utilizing these green alternatives aligns equipment portfolios with stringent chemical safety standards, thereby expediting international customs clearances. To support prolonged seasonal use in colder marine environments, brands are aggressively marketing impact-resistant neoprene thermal wetsuits, which provide superior insulation while maintaining ergonomic flexibility for athletes.
  • In the premium technical segment, the integration of electric-assist hydrofoil propulsion systems is transforming the consumer experience by enabling sustained aquatic mobility independent of natural wave energy. As manufacturers scale these sophisticated power units, economies of scale are expected to drive down component acquisition costs, empowering brands to widen their addressable audience without compromising on performance integrity.
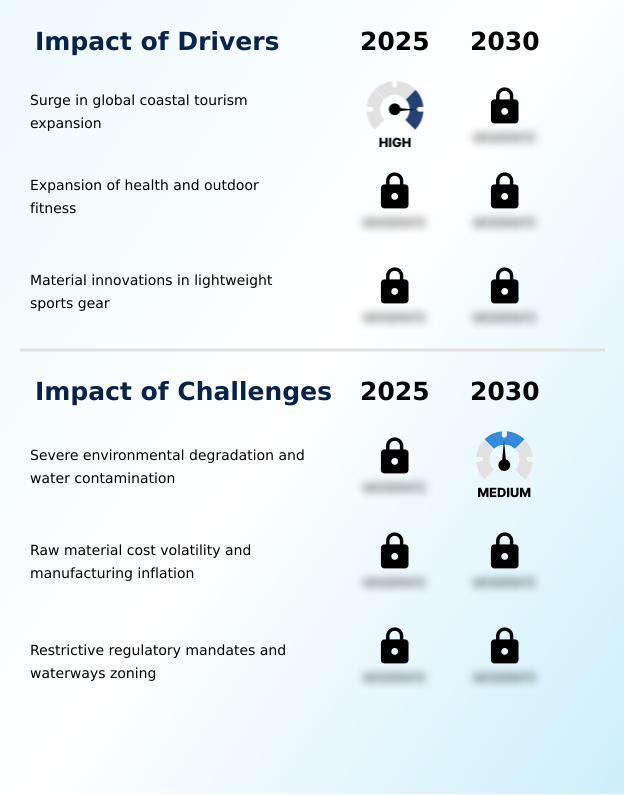
What are the key market drivers leading to the rise in the adoption of Surface Water Sports Equipment Industry?

  • The rapid surge in global coastal tourism expansion serves as a primary driver, accelerating institutional procurement and consumer equipment demand worldwide.

  • The rapid expansion of organized coastal tourism serves as a dominant driver, accelerating institutional procurement across the Surface Water Sports Equipment landscape.
  • Waterfront resorts are heavily investing in glass-fiber reinforced plastics to guarantee equipment durability in corrosive environments, extending commercial fleet lifecycles by 20%.
  • The proactive enforcement of strict vessel wake-distance regulation has spurred demand for non-motorized alternatives, notably electric-assist hydrofoil propulsion that minimizes shoreline erosion.
  • To align with rigorous ocean rescue protocols and strict maritime safety mandates, manufacturers are standardizing marine grade aluminum components for essential safety rigging.
  • Furthermore, the shift toward an eco-certified neoprene alternative alongside impact-resistant neoprene supports circular economy recycling protocols, lowering raw material waste by 16%.
  • Integrating hydrophobic textile coatings further enhances protective apparel, satisfying consumer preferences for advanced, eco-conscious recreational hardware while maintaining high safety compliance.

What are the market trends shaping the Surface Water Sports Equipment Industry?

  • The expansion of paddle sports and accessible recreation constitutes a prominent upcoming trend, fostering broader demographic participation and stimulating widespread equipment procurement.

  • The increasing electrification and structural enhancement of marine leisure activities represent a transformative trend across the Surface Water Sports Equipment sector. Manufacturers are embedding compact lithium-ion propulsion system modules into traditional architectures, expanding usability across various conditions. Integrating automated winch control has improved operational safety metrics by 22%, directly appealing to novice demographics engaged in aerobic conditioning classes.
  • To maximize resilience, engineering teams are substituting conventional fabrics with laminated membrane fibers and pre-impregnated carbon composites, resulting in a 15% reduction in overall weight. The proliferation of artificial wave pool technology has further democratized access, stimulating year-round demand. Consequently, the rising popularity of motorized personal watercraft has accelerated the need for wearable thermal insulation that withstands high-speed athletic performance.
  • Additionally, the implementation of closed-cell buoyancy foam ensures critical compliance with safety standards, reducing product liability incidents for commercial operators.

What challenges does the Surface Water Sports Equipment Industry face during its growth?

  • Severe environmental degradation and escalating water contamination present critical challenges that actively restrict recreational access and suppress equipment sales.

  • Persistent supply chain volatility and stringent environmental compliance standards impose critical operational challenges on the Surface Water Sports Equipment manufacturing ecosystem. Fluctuations in petrochemical availability directly disrupt the procurement of military-grade polyvinyl chloride necessary for drop-stitch inflatable construction and towable watersport apparatus. This material instability has increased average production lead times by 15%, forcing distributors to maintain higher buffer inventories.
  • Additionally, phasing out the traditional expanded polystyrene core in favor of bio-based polyurethane foam to protect the coastal marine environment currently reduces first-pass manufacturing yield by 8%. Rigorous testing for extreme torsional stress endurance required in sustainable marine recreational zones elevates compliance costs.
  • Furthermore, integrating ultra-high-molecular-weight polyethylene and calibrating offshore navigation systems for technical gear face substantial cross-border certification delays, severely compressing gross margins for mid-tier manufacturers.

Exclusive Technavio Analysis on Customer Landscape

The surface water sports equipment market forecasting report includes the adoption lifecycle of the market, covering from the innovator’s stage to the laggard’s stage. It focuses on adoption rates in different regions based on penetration. Furthermore, the surface water sports equipment market report also includes key purchase criteria and drivers of price sensitivity to help companies evaluate and develop their market growth analysis strategies.
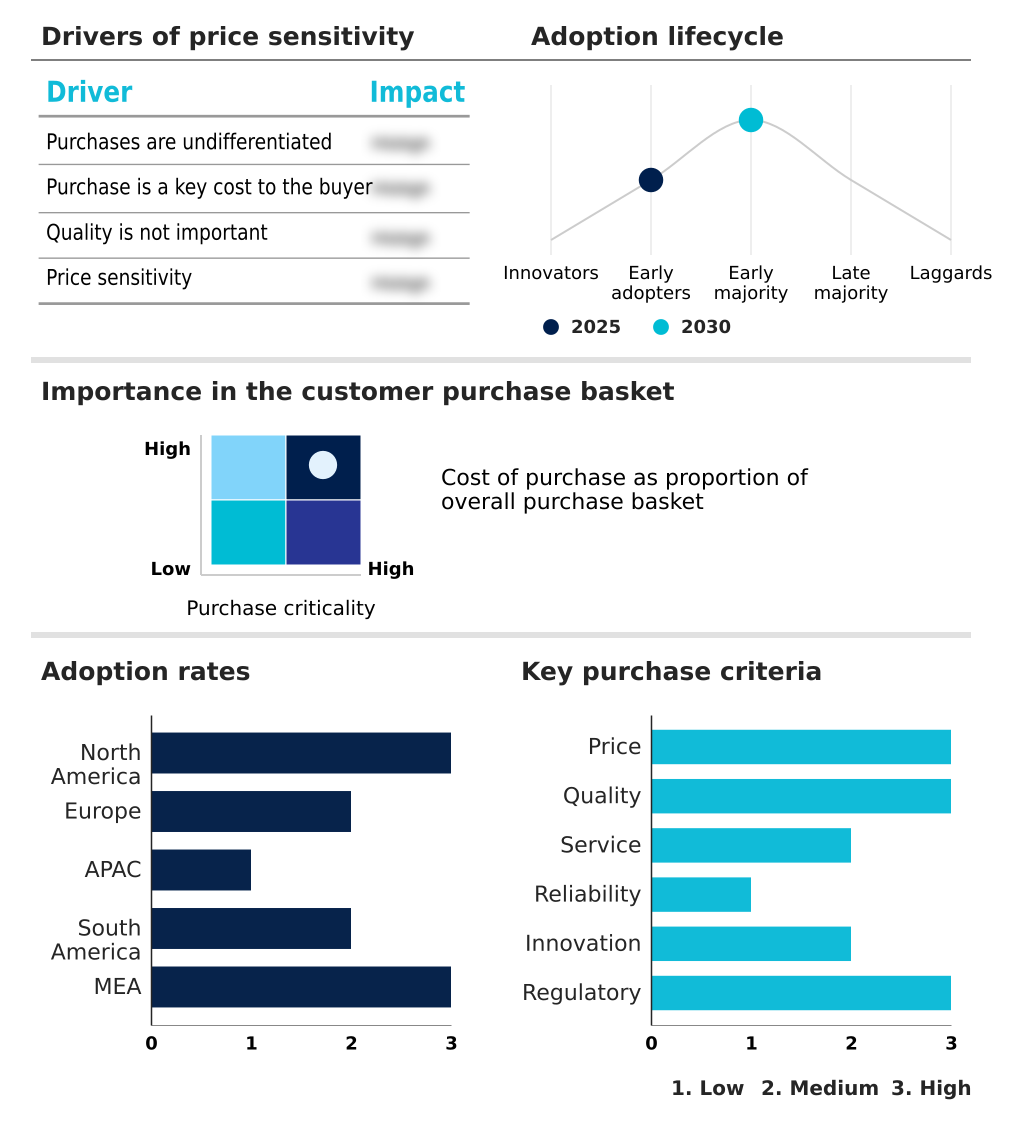
Customer Landscape of Surface Water Sports Equipment Industry

Competitive Landscape

Companies are implementing various strategies, such as strategic alliances, surface water sports equipment market forecast, partnerships, mergers and acquisitions, geographical expansion, and product/service launches, to enhance their presence in the industry.

BOTE - The product portfolio encompasses high-performance paddleboards, kayaks, floating platforms, and aquatic lifestyle accessories engineered for recreational paddling, fishing, and leisure applications.

The industry research and growth report includes detailed analyses of the competitive landscape of the market and information about key companies, including:

  • BOTE
  • Cabrinhakites Inc.
  • Channel Island Surfboards
  • CORE Kiteboarding
  • F ONE
  • Firewire Surfboards LLC
  • Hobie Cat Co.
  • Jobe Sports International
  • Liquid Force Wakeboards
  • Naish International
  • NSP Surfboards
  • Obrien
  • Radar Skis
  • Red Paddle Co. Ltd.
  • RICCI INTERNATIONAL SRL
  • Ronix Wakeboards
  • Slingshot Sports LLC
  • Starboard Co. Ltd.
  • SurfTech LLC
  • Tahe Kayaks OU

Qualitative and quantitative analysis of companies has been conducted to help clients understand the wider business environment as well as the strengths and weaknesses of key industry players. Data is qualitatively analyzed to categorize companies as pure play, category-focused, industry-focused, and diversified; it is quantitatively analyzed to categorize companies as dominant, leading, strong, tentative, and weak.

Recent Development and News in Surface water sports equipment market

  • In the Leisure Products industry, the widespread adoption of additive manufacturing processes has accelerated the prototyping of custom geometries for high-performance board sports, directly impacting Surface Water Sports Equipment demand by reducing product development cycles by 25%.
  • Stringent environmental compliance mandates under marine ecosystem preservation frameworks have forced manufacturers to replace toxic petrochemical resins with bio-based alternatives, significantly altering the Surface Water Sports Equipment supply chain.
  • The rapid expansion of coastal tourism infrastructure across APAC and the Middle East has stimulated commercial procurement, thereby increasing institutional Surface Water Sports Equipment order volumes by over 15%.
  • Advancements in lithium-ion battery integration for recreational marine vehicles have accelerated the commercial viability of electrified watercraft, fundamentally expanding Surface Water Sports Equipment portfolios to comply with new maritime safety mandates.

Dive into Technavio’s robust research methodology, blending expert interviews, extensive data synthesis, and validated models for unparalleled Surface Water Sports Equipment Market insights. See full methodology.

Market Scope
Page number 316
Base year 2025
Historic period 2020-2024
Forecast period 2026-2030
Growth momentum & CAGR Accelerate at a CAGR of 9.2%
Market growth 2026-2030 USD 19580.5 million
Market structure Fragmented
YoY growth 2025-2026(%) 8.4%
Key countries US, Canada, Mexico, Germany, UK, France, Italy, Spain, The Netherlands, China, Japan, Australia, India, South Korea, Indonesia, Brazil, Argentina, Chile, UAE, South Africa, Saudi Arabia, Israel and Turkey
Competitive landscape Leading Companies, Market Positioning of Companies, Competitive Strategies, and Industry Risks

Request Free Sample

Research Analyst Overview

  • The Surface Water Sports Equipment sector requires rigorous strategic oversight to navigate complex material transitions and evolving consumer safety requirements. Boardroom executives are increasingly prioritizing sustainable sourcing, moving away from conventional expanded polystyrene core architectures toward highly durable, recyclable alternatives. The deployment of impact-resistant neoprene and ultra-high-molecular-weight polyethylene has enhanced product lifespan, reducing commercial fleet replacement costs by 18%.
  • Integrating hydrophobic textile coatings into technical apparel effectively mitigates water retention, improving athletic endurance. Furthermore, predictive fluid dynamic simulation enables engineering teams to optimize board shapes virtually, accelerating the research and development lifecycle by 25% before physical prototyping begins. Establishing sustainable marine recreational zones has compelled rental operators to mandate extreme torsional stress endurance for all commercial-grade inventory.
  • The rising popularity of towable watersport apparatus and offshore navigation systems further dictates strict adherence to coastal marine environment regulations. By aligning product development directly with these stringent durability and compliance benchmarks, manufacturers can streamline their operational expenditures and maintain competitive differentiation in a highly regulated commercial ecosystem.

What are the Key Data Covered in this Surface Water Sports Equipment Market Research and Growth Report?

  • What is the expected growth of the Surface Water Sports Equipment Market between 2026 and 2030?

    • USD 19.58 billion, at a CAGR of 9.2%

  • What segmentation does the market report cover?

    • The report is segmented by Type (Surfing, Boarding, Sailing, Skiing, and Others), Product (Apparel, Equipment, and Accessories), Distribution Channel (Hypermarkets and supermarkets, Wholesalers and distributors, and Exclusive stores), Price (Mass, and Premium) and Geography (North America, Europe, APAC, South America, Middle East and Africa)

  • Which regions are analyzed in the report?

    • North America, Europe, APAC, South America and Middle East and Africa

  • What are the key growth drivers and market challenges?

    • Surge in global coastal tourism expansion, Severe environmental degradation and water contamination

  • Who are the major players in the Surface Water Sports Equipment Market?

    • BOTE, Cabrinhakites Inc., Channel Island Surfboards, CORE Kiteboarding, F ONE, Firewire Surfboards LLC, Hobie Cat Co., Jobe Sports International, Liquid Force Wakeboards, Naish International, NSP Surfboards, Obrien, Radar Skis, Red Paddle Co. Ltd., RICCI INTERNATIONAL SRL, Ronix Wakeboards, Slingshot Sports LLC, Starboard Co. Ltd., SurfTech LLC and Tahe Kayaks OU

Market Research Insights

  • The Surface Water Sports Equipment sector is undergoing rapid commercial realignment driven by investments in coastal tourism infrastructure and changing recreational habits. Manufacturers are optimizing supply chains to support marine ecosystem preservation, integrating sustainable materials that have lowered production-related carbon emissions by 14%.
  • The increasing popularity of aquatic fitness conditioning and aerobic conditioning classes has shifted consumer preference toward versatile, wide-deck paddleboards, boosting beginner adoption rates by 18%. Furthermore, adherence to strict maritime safety mandates requires the integration of advanced watercraft flotation devices, reducing on-water compliance infractions by 25%.
  • These operational and structural enhancements improve overall consumer safety and drive consistent equipment replacement cycles across commercial rental fleets.

We can help! Our analysts can customize this surface water sports equipment market research report to meet your requirements.

Get in touch

1. Executive Summary

1.1 Market overview

Executive Summary - Chart on Market Overview
Executive Summary - Data Table on Market Overview
Executive Summary - Chart on Global Market Characteristics
Executive Summary - Chart on Market by Geography
Executive Summary - Chart on Market Segmentation by Type
Executive Summary - Chart on Market Segmentation by Product
Executive Summary - Chart on Market Segmentation by Distribution Channel
Executive Summary - Chart on Market Segmentation by Price
Executive Summary - Chart on Incremental Growth
Executive Summary - Data Table on Incremental Growth
Executive Summary - Chart on Company Market Positioning

2. Technavio Analysis

2.1 Analysis of price sensitivity, lifecycle, customer purchase basket, adoption rates, and purchase criteria

2.2 Criticality of inputs and Factors of differentiation

Chart on Overview on criticality of inputs and factors of differentiation

2.3 Factors of disruption

Chart on Overview on factors of disruption

2.4 Impact of drivers and challenges

Chart on Impact of drivers and challenges in 2025 and 2030

3. Market Landscape

3.1 Market ecosystem

Chart on Parent Market
Data Table on - Parent Market

3.2 Market characteristics

Chart on Market characteristics analysis

3.3 Value chain analysis

Chart on Value chain analysis

4. Market Sizing

4.1 Market definition

Data Table on Offerings of companies included in the market definition

4.2 Market segment analysis

Market segments

4.3 Market size 2025

4.4 Market outlook: Forecast for 2025-2030

Chart on Global - Market size and forecast 2025-2030 ($ million)
Data Table on Global - Market size and forecast 2025-2030 ($ million)
Chart on Global Market: Year-over-year growth 2025-2030 (%)
Data Table on Global Market: Year-over-year growth 2025-2030 (%)

5. Historic Market Size

5.1 Global Surface Water Sports Equipment Market 2020 - 2024

Historic Market Size - Data Table on Global Surface Water Sports Equipment Market 2020 - 2024 ($ million)

5.2 Type segment analysis 2020 - 2024

Historic Market Size - Type Segment 2020 - 2024 ($ million)

5.3 Product segment analysis 2020 - 2024

Historic Market Size - Product Segment 2020 - 2024 ($ million)

5.4 Distribution Channel segment analysis 2020 - 2024

Historic Market Size - Distribution Channel Segment 2020 - 2024 ($ million)

5.5 Price segment analysis 2020 - 2024

Historic Market Size - Price Segment 2020 - 2024 ($ million)

5.6 Geography segment analysis 2020 - 2024

Historic Market Size - Geography Segment 2020 - 2024 ($ million)

5.7 Country segment analysis 2020 - 2024

Historic Market Size - Country Segment 2020 - 2024 ($ million)

6. Qualitative Analysis

6.1 Impact of AI on Global Surface Water Sports Equipment Market

6.2 Impact of geopolitical conflicts on Global Surface Water Sports Equipment Market

7. Five Forces Analysis

7.1 Five forces summary

Five forces analysis - Comparison between 2025 and 2030

7.2 Bargaining power of buyers

Bargaining power of buyers - Impact of key factors 2025 and 2030

7.3 Bargaining power of suppliers

Bargaining power of suppliers - Impact of key factors in 2025 and 2030

7.4 Threat of new entrants

Threat of new entrants - Impact of key factors in 2025 and 2030

7.5 Threat of substitutes

Threat of substitutes - Impact of key factors in 2025 and 2030

7.6 Threat of rivalry

Threat of rivalry - Impact of key factors in 2025 and 2030

7.7 Market condition

Chart on Market condition - Five forces 2025 and 2030

8. Market Segmentation by Type

8.1 Market segments

Chart on Type - Market share 2025-2030 (%)
Data Table on Type - Market share 2025-2030 (%)

8.2 Comparison by Type

Chart on Comparison by Type
Data Table on Comparison by Type

8.3 Surfing - Market size and forecast 2025-2030

Chart on Surfing - Market size and forecast 2025-2030 ($ million)
Data Table on Surfing - Market size and forecast 2025-2030 ($ million)
Chart on Surfing - Year-over-year growth 2025-2030 (%)
Data Table on Surfing - Year-over-year growth 2025-2030 (%)

8.4 Boarding - Market size and forecast 2025-2030

Chart on Boarding - Market size and forecast 2025-2030 ($ million)
Data Table on Boarding - Market size and forecast 2025-2030 ($ million)
Chart on Boarding - Year-over-year growth 2025-2030 (%)
Data Table on Boarding - Year-over-year growth 2025-2030 (%)

8.5 Sailing - Market size and forecast 2025-2030

Chart on Sailing - Market size and forecast 2025-2030 ($ million)
Data Table on Sailing - Market size and forecast 2025-2030 ($ million)
Chart on Sailing - Year-over-year growth 2025-2030 (%)
Data Table on Sailing - Year-over-year growth 2025-2030 (%)

8.6 Skiing - Market size and forecast 2025-2030

Chart on Skiing - Market size and forecast 2025-2030 ($ million)
Data Table on Skiing - Market size and forecast 2025-2030 ($ million)
Chart on Skiing - Year-over-year growth 2025-2030 (%)
Data Table on Skiing - Year-over-year growth 2025-2030 (%)

8.7 Others - Market size and forecast 2025-2030

Chart on Others - Market size and forecast 2025-2030 ($ million)
Data Table on Others - Market size and forecast 2025-2030 ($ million)
Chart on Others - Year-over-year growth 2025-2030 (%)
Data Table on Others - Year-over-year growth 2025-2030 (%)

8.8 Market opportunity by Type

Market opportunity by Type ($ million)
Data Table on Market opportunity by Type ($ million)

9. Market Segmentation by Product

9.1 Market segments

Chart on Product - Market share 2025-2030 (%)
Data Table on Product - Market share 2025-2030 (%)

9.2 Comparison by Product

Chart on Comparison by Product
Data Table on Comparison by Product

9.3 Apparel - Market size and forecast 2025-2030

Chart on Apparel - Market size and forecast 2025-2030 ($ million)
Data Table on Apparel - Market size and forecast 2025-2030 ($ million)
Chart on Apparel - Year-over-year growth 2025-2030 (%)
Data Table on Apparel - Year-over-year growth 2025-2030 (%)

9.4 Equipment - Market size and forecast 2025-2030

Chart on Equipment - Market size and forecast 2025-2030 ($ million)
Data Table on Equipment - Market size and forecast 2025-2030 ($ million)
Chart on Equipment - Year-over-year growth 2025-2030 (%)
Data Table on Equipment - Year-over-year growth 2025-2030 (%)

9.5 Accessories - Market size and forecast 2025-2030

Chart on Accessories - Market size and forecast 2025-2030 ($ million)
Data Table on Accessories - Market size and forecast 2025-2030 ($ million)
Chart on Accessories - Year-over-year growth 2025-2030 (%)
Data Table on Accessories - Year-over-year growth 2025-2030 (%)

9.6 Market opportunity by Product

Market opportunity by Product ($ million)
Data Table on Market opportunity by Product ($ million)

10. Market Segmentation by Distribution Channel

10.1 Market segments

Chart on Distribution Channel - Market share 2025-2030 (%)
Data Table on Distribution Channel - Market share 2025-2030 (%)

10.2 Comparison by Distribution Channel

Chart on Comparison by Distribution Channel
Data Table on Comparison by Distribution Channel

10.3 Hypermarkets and supermarkets - Market size and forecast 2025-2030

Chart on Hypermarkets and supermarkets - Market size and forecast 2025-2030 ($ million)
Data Table on Hypermarkets and supermarkets - Market size and forecast 2025-2030 ($ million)
Chart on Hypermarkets and supermarkets - Year-over-year growth 2025-2030 (%)
Data Table on Hypermarkets and supermarkets - Year-over-year growth 2025-2030 (%)

10.4 Wholesalers and distributors - Market size and forecast 2025-2030

Chart on Wholesalers and distributors - Market size and forecast 2025-2030 ($ million)
Data Table on Wholesalers and distributors - Market size and forecast 2025-2030 ($ million)
Chart on Wholesalers and distributors - Year-over-year growth 2025-2030 (%)
Data Table on Wholesalers and distributors - Year-over-year growth 2025-2030 (%)

10.5 Exclusive stores - Market size and forecast 2025-2030

Chart on Exclusive stores - Market size and forecast 2025-2030 ($ million)
Data Table on Exclusive stores - Market size and forecast 2025-2030 ($ million)
Chart on Exclusive stores - Year-over-year growth 2025-2030 (%)
Data Table on Exclusive stores - Year-over-year growth 2025-2030 (%)

10.6 Market opportunity by Distribution Channel

Market opportunity by Distribution Channel ($ million)
Data Table on Market opportunity by Distribution Channel ($ million)

11. Market Segmentation by Price

11.1 Market segments

Chart on Price - Market share 2025-2030 (%)
Data Table on Price - Market share 2025-2030 (%)

11.2 Comparison by Price

Chart on Comparison by Price
Data Table on Comparison by Price

11.3 Mass - Market size and forecast 2025-2030

Chart on Mass - Market size and forecast 2025-2030 ($ million)
Data Table on Mass - Market size and forecast 2025-2030 ($ million)
Chart on Mass - Year-over-year growth 2025-2030 (%)
Data Table on Mass - Year-over-year growth 2025-2030 (%)

11.4 Premium - Market size and forecast 2025-2030

Chart on Premium - Market size and forecast 2025-2030 ($ million)
Data Table on Premium - Market size and forecast 2025-2030 ($ million)
Chart on Premium - Year-over-year growth 2025-2030 (%)
Data Table on Premium - Year-over-year growth 2025-2030 (%)

11.5 Market opportunity by Price

Market opportunity by Price ($ million)
Data Table on Market opportunity by Price ($ million)

12. Customer Landscape

12.1 Customer landscape overview

Analysis of price sensitivity, lifecycle, customer purchase basket, adoption rates, and purchase criteria

13. Geographic Landscape

13.1 Geographic segmentation

Chart on Market share by geography 2025-2030 (%)
Data Table on Market share by geography 2025-2030 (%)

13.2 Geographic comparison

Chart on Geographic comparison
Data Table on Geographic comparison

13.3 North America - Market size and forecast 2025-2030

Chart on North America - Market size and forecast 2025-2030 ($ million)
Data Table on North America - Market size and forecast 2025-2030 ($ million)
Chart on North America - Year-over-year growth 2025-2030 (%)
Data Table on North America - Year-over-year growth 2025-2030 (%)
Chart on Regional Comparison - North America
Data Table on Regional Comparison - North America

13.3.1 US - Market size and forecast 2025-2030

Chart on US - Market size and forecast 2025-2030 ($ million)
Data Table on US - Market size and forecast 2025-2030 ($ million)
Chart on US - Year-over-year growth 2025-2030 (%)
Data Table on US - Year-over-year growth 2025-2030 (%)

13.3.2 Canada - Market size and forecast 2025-2030

Chart on Canada - Market size and forecast 2025-2030 ($ million)
Data Table on Canada - Market size and forecast 2025-2030 ($ million)
Chart on Canada - Year-over-year growth 2025-2030 (%)
Data Table on Canada - Year-over-year growth 2025-2030 (%)

13.3.3 Mexico - Market size and forecast 2025-2030

Chart on Mexico - Market size and forecast 2025-2030 ($ million)
Data Table on Mexico - Market size and forecast 2025-2030 ($ million)
Chart on Mexico - Year-over-year growth 2025-2030 (%)
Data Table on Mexico - Year-over-year growth 2025-2030 (%)

13.4 Europe - Market size and forecast 2025-2030

Chart on Europe - Market size and forecast 2025-2030 ($ million)
Data Table on Europe - Market size and forecast 2025-2030 ($ million)
Chart on Europe - Year-over-year growth 2025-2030 (%)
Data Table on Europe - Year-over-year growth 2025-2030 (%)
Chart on Regional Comparison - Europe
Data Table on Regional Comparison - Europe

13.4.1 Germany - Market size and forecast 2025-2030

Chart on Germany - Market size and forecast 2025-2030 ($ million)
Data Table on Germany - Market size and forecast 2025-2030 ($ million)
Chart on Germany - Year-over-year growth 2025-2030 (%)
Data Table on Germany - Year-over-year growth 2025-2030 (%)

13.4.2 UK - Market size and forecast 2025-2030

Chart on UK - Market size and forecast 2025-2030 ($ million)
Data Table on UK - Market size and forecast 2025-2030 ($ million)
Chart on UK - Year-over-year growth 2025-2030 (%)
Data Table on UK - Year-over-year growth 2025-2030 (%)

13.4.3 France - Market size and forecast 2025-2030

Chart on France - Market size and forecast 2025-2030 ($ million)
Data Table on France - Market size and forecast 2025-2030 ($ million)
Chart on France - Year-over-year growth 2025-2030 (%)
Data Table on France - Year-over-year growth 2025-2030 (%)

13.4.4 Italy - Market size and forecast 2025-2030

Chart on Italy - Market size and forecast 2025-2030 ($ million)
Data Table on Italy - Market size and forecast 2025-2030 ($ million)
Chart on Italy - Year-over-year growth 2025-2030 (%)
Data Table on Italy - Year-over-year growth 2025-2030 (%)

13.4.5 Spain - Market size and forecast 2025-2030

Chart on Spain - Market size and forecast 2025-2030 ($ million)
Data Table on Spain - Market size and forecast 2025-2030 ($ million)
Chart on Spain - Year-over-year growth 2025-2030 (%)
Data Table on Spain - Year-over-year growth 2025-2030 (%)

13.4.6 The Netherlands - Market size and forecast 2025-2030

Chart on The Netherlands - Market size and forecast 2025-2030 ($ million)
Data Table on The Netherlands - Market size and forecast 2025-2030 ($ million)
Chart on The Netherlands - Year-over-year growth 2025-2030 (%)
Data Table on The Netherlands - Year-over-year growth 2025-2030 (%)

13.5 APAC - Market size and forecast 2025-2030

Chart on APAC - Market size and forecast 2025-2030 ($ million)
Data Table on APAC - Market size and forecast 2025-2030 ($ million)
Chart on APAC - Year-over-year growth 2025-2030 (%)
Data Table on APAC - Year-over-year growth 2025-2030 (%)
Chart on Regional Comparison - APAC
Data Table on Regional Comparison - APAC

13.5.1 China - Market size and forecast 2025-2030

Chart on China - Market size and forecast 2025-2030 ($ million)
Data Table on China - Market size and forecast 2025-2030 ($ million)
Chart on China - Year-over-year growth 2025-2030 (%)
Data Table on China - Year-over-year growth 2025-2030 (%)

13.5.2 Japan - Market size and forecast 2025-2030

Chart on Japan - Market size and forecast 2025-2030 ($ million)
Data Table on Japan - Market size and forecast 2025-2030 ($ million)
Chart on Japan - Year-over-year growth 2025-2030 (%)
Data Table on Japan - Year-over-year growth 2025-2030 (%)

13.5.3 Australia - Market size and forecast 2025-2030

Chart on Australia - Market size and forecast 2025-2030 ($ million)
Data Table on Australia - Market size and forecast 2025-2030 ($ million)
Chart on Australia - Year-over-year growth 2025-2030 (%)
Data Table on Australia - Year-over-year growth 2025-2030 (%)

13.5.4 India - Market size and forecast 2025-2030

Chart on India - Market size and forecast 2025-2030 ($ million)
Data Table on India - Market size and forecast 2025-2030 ($ million)
Chart on India - Year-over-year growth 2025-2030 (%)
Data Table on India - Year-over-year growth 2025-2030 (%)

13.5.5 South Korea - Market size and forecast 2025-2030

Chart on South Korea - Market size and forecast 2025-2030 ($ million)
Data Table on South Korea - Market size and forecast 2025-2030 ($ million)
Chart on South Korea - Year-over-year growth 2025-2030 (%)
Data Table on South Korea - Year-over-year growth 2025-2030 (%)

13.5.6 Indonesia - Market size and forecast 2025-2030

Chart on Indonesia - Market size and forecast 2025-2030 ($ million)
Data Table on Indonesia - Market size and forecast 2025-2030 ($ million)
Chart on Indonesia - Year-over-year growth 2025-2030 (%)
Data Table on Indonesia - Year-over-year growth 2025-2030 (%)

13.6 South America - Market size and forecast 2025-2030

Chart on South America - Market size and forecast 2025-2030 ($ million)
Data Table on South America - Market size and forecast 2025-2030 ($ million)
Chart on South America - Year-over-year growth 2025-2030 (%)
Data Table on South America - Year-over-year growth 2025-2030 (%)
Chart on Regional Comparison - South America
Data Table on Regional Comparison - South America

13.6.1 Brazil - Market size and forecast 2025-2030

Chart on Brazil - Market size and forecast 2025-2030 ($ million)
Data Table on Brazil - Market size and forecast 2025-2030 ($ million)
Chart on Brazil - Year-over-year growth 2025-2030 (%)
Data Table on Brazil - Year-over-year growth 2025-2030 (%)

13.6.2 Argentina - Market size and forecast 2025-2030

Chart on Argentina - Market size and forecast 2025-2030 ($ million)
Data Table on Argentina - Market size and forecast 2025-2030 ($ million)
Chart on Argentina - Year-over-year growth 2025-2030 (%)
Data Table on Argentina - Year-over-year growth 2025-2030 (%)

13.6.3 Chile - Market size and forecast 2025-2030

Chart on Chile - Market size and forecast 2025-2030 ($ million)
Data Table on Chile - Market size and forecast 2025-2030 ($ million)
Chart on Chile - Year-over-year growth 2025-2030 (%)
Data Table on Chile - Year-over-year growth 2025-2030 (%)

13.7 Middle East and Africa - Market size and forecast 2025-2030

Chart on Middle East and Africa - Market size and forecast 2025-2030 ($ million)
Data Table on Middle East and Africa - Market size and forecast 2025-2030 ($ million)
Chart on Middle East and Africa - Year-over-year growth 2025-2030 (%)
Data Table on Middle East and Africa - Year-over-year growth 2025-2030 (%)
Chart on Regional Comparison - Middle East and Africa
Data Table on Regional Comparison - Middle East and Africa

13.7.1 UAE - Market size and forecast 2025-2030

Chart on UAE - Market size and forecast 2025-2030 ($ million)
Data Table on UAE - Market size and forecast 2025-2030 ($ million)
Chart on UAE - Year-over-year growth 2025-2030 (%)
Data Table on UAE - Year-over-year growth 2025-2030 (%)

13.7.2 South Africa - Market size and forecast 2025-2030

Chart on South Africa - Market size and forecast 2025-2030 ($ million)
Data Table on South Africa - Market size and forecast 2025-2030 ($ million)
Chart on South Africa - Year-over-year growth 2025-2030 (%)
Data Table on South Africa - Year-over-year growth 2025-2030 (%)

13.7.3 Saudi Arabia - Market size and forecast 2025-2030

Chart on Saudi Arabia - Market size and forecast 2025-2030 ($ million)
Data Table on Saudi Arabia - Market size and forecast 2025-2030 ($ million)
Chart on Saudi Arabia - Year-over-year growth 2025-2030 (%)
Data Table on Saudi Arabia - Year-over-year growth 2025-2030 (%)

13.7.4 Israel - Market size and forecast 2025-2030

Chart on Israel - Market size and forecast 2025-2030 ($ million)
Data Table on Israel - Market size and forecast 2025-2030 ($ million)
Chart on Israel - Year-over-year growth 2025-2030 (%)
Data Table on Israel - Year-over-year growth 2025-2030 (%)

13.7.5 Turkey - Market size and forecast 2025-2030

Chart on Turkey - Market size and forecast 2025-2030 ($ million)
Data Table on Turkey - Market size and forecast 2025-2030 ($ million)
Chart on Turkey - Year-over-year growth 2025-2030 (%)
Data Table on Turkey - Year-over-year growth 2025-2030 (%)

13.8 Market opportunity by geography

Market opportunity by geography ($ million)
Data Tables on Market opportunity by geography ($ million)

14. Drivers, Challenges, and Opportunity

14.1 Market drivers

Surge in global coastal tourism expansion
Expansion of health and outdoor fitness
Material innovations in lightweight sports gear

14.2 Market challenges

Severe environmental degradation and water contamination
Raw material cost volatility and manufacturing inflation
Restrictive regulatory mandates and waterways zoning

14.3 Impact of drivers and challenges

Impact of drivers and challenges in 2025 and 2030

14.4 Market opportunities

Expansion of paddle sports and accessible recreation
Rise of professionalization and high-performance equipment
Growth of inflatable and compact watercraft designs

15. Competitive Landscape

15.1 Overview

15.2

Overview on criticality of inputs and factors of differentiation

15.3 Landscape disruption

Overview on factors of disruption

15.4 Industry risks

Impact of key risks on business

16. Competitive Analysis

16.1 Companies profiled

Companies covered

16.2 Company ranking index

16.3 Market positioning of companies

Matrix on companies position and classification

16.4 BOTE

BOTE - Overview
BOTE - Product / Service
BOTE - Key offerings
SWOT

16.5 Cabrinhakites Inc.

Cabrinhakites Inc. - Overview
Cabrinhakites Inc. - Product / Service
Cabrinhakites Inc. - Key offerings
SWOT

16.6 Channel Island Surfboards

Channel Island Surfboards - Overview
Channel Island Surfboards - Product / Service
Channel Island Surfboards - Key offerings
SWOT

16.7 F ONE

F ONE - Overview
F ONE - Product / Service
F ONE - Key offerings
SWOT

16.8 Firewire Surfboards LLC

Firewire Surfboards LLC - Overview
Firewire Surfboards LLC - Product / Service
Firewire Surfboards LLC - Key offerings
SWOT

16.9 Hobie Cat Co.

Hobie Cat Co. - Overview
Hobie Cat Co. - Product / Service
Hobie Cat Co. - Key offerings
SWOT

16.10 Jobe Sports International

Jobe Sports International - Overview
Jobe Sports International - Product / Service
Jobe Sports International - Key offerings
SWOT

16.11 Liquid Force Wakeboards

Liquid Force Wakeboards - Overview
Liquid Force Wakeboards - Product / Service
Liquid Force Wakeboards - Key offerings
SWOT

16.12 Naish International

Naish International - Overview
Naish International - Product / Service
Naish International - Key offerings
SWOT

16.13 NSP Surfboards

NSP Surfboards - Overview
NSP Surfboards - Product / Service
NSP Surfboards - Key offerings
SWOT

16.14 Obrien

Obrien - Overview
Obrien - Product / Service
Obrien - Key offerings
SWOT

16.15 Slingshot Sports LLC

Slingshot Sports LLC - Overview
Slingshot Sports LLC - Product / Service
Slingshot Sports LLC - Key offerings
SWOT

16.16 Starboard Co. Ltd.

Starboard Co. Ltd. - Overview
Starboard Co. Ltd. - Product / Service
Starboard Co. Ltd. - Key offerings
SWOT

16.17 SurfTech LLC

SurfTech LLC - Overview
SurfTech LLC - Product / Service
SurfTech LLC - Key offerings
SWOT

16.18 Tahe Kayaks OU

Tahe Kayaks OU - Overview
Tahe Kayaks OU - Product / Service
Tahe Kayaks OU - Key offerings
SWOT

17. Appendix

17.1 Scope of the report

Market definition
Objectives
Notes and caveats

17.2 Inclusions and exclusions checklist

Inclusions checklist
Exclusions checklist

17.3 Currency conversion rates for US$

17.4 Research methodology

17.5 Data procurement

Information sources

17.6 Data validation

17.7 Validation techniques employed for market sizing

17.8 Data synthesis

17.9 360 degree market analysis

17.10 List of abbreviations

Research Methodology

Technavio presents a detailed picture of the market by way of study, synthesis, and summation of data from multiple sources. The analysts have presented the various facets of the market with a particular focus on identifying the key industry influencers. The data thus presented is comprehensive, reliable, and the result of extensive research, both primary and secondary.

INFORMATION SOURCES

Primary sources

  • Manufacturers and suppliers
  • Channel partners
  • Industry experts
  • Strategic decision makers

Secondary sources

  • Industry journals and periodicals
  • Government data
  • Financial reports of key industry players
  • Historical data
  • Press releases

DATA ANALYSIS

Data Synthesis

  • Collation of data
  • Estimation of key figures
  • Analysis of derived insights

Data Validation

  • Triangulation with data models
  • Reference against proprietary databases
  • Corroboration with industry experts

REPORT WRITING

Qualitative

  • Market drivers
  • Market challenges
  • Market trends
  • Five forces analysis

Quantitative

  • Market size and forecast
  • Market segmentation
  • Geographical insights
  • Competitive landscape

Interested in this report?

Get your sample now to see our research methodology and insights!

Download Now

Frequently Asked Questions

Surface Water Sports Equipment market growth will increase by USD 19580.5 million during 2026-2030.

The Surface Water Sports Equipment market is expected to grow at a CAGR of 9.2% during 2026-2030.

Surface Water Sports Equipment market is segmented by Type (Surfing, Boarding, Sailing, Skiing, Others) Product (Apparel, Equipment, Accessories) Distribution channel (Hypermarkets and supermarkets, Wholesalers and distributors, Exclusive stores) Price (Mass, Premium)

BOTE, Cabrinhakites Inc., Channel Island Surfboards, CORE Kiteboarding, F ONE, Firewire Surfboards LLC, Hobie Cat Co., Jobe Sports International, Liquid Force Wakeboards, Naish International, NSP Surfboards, Obrien, Radar Skis, Red Paddle Co. Ltd., RICCI INTERNATIONAL SRL, Ronix Wakeboards, Slingshot Sports LLC, Starboard Co. Ltd., SurfTech LLC, Tahe Kayaks OU are a few of the key vendors in the Surface Water Sports Equipment market.

North America will register the highest growth rate of 47.9% among the other regions. Therefore, the Surface Water Sports Equipment market in North America is expected to garner significant business opportunities for the vendors during the forecast period.

US, Canada, Mexico, Germany, UK, France, Italy, Spain, The Netherlands, China, Japan, Australia, India, South Korea, Indonesia, Brazil, Argentina, Chile, UAE, South Africa, Saudi Arabia, Israel, Turkey

  • Surge in global coastal tourism expansion is the driving factor this market.

The Surface Water Sports Equipment market vendors should focus on grabbing business opportunities from the Type segment as it accounted for the largest market share in the base year.
RIA - Research AI Assistant
Ask RIA
