
Sustainable Pet Products Market Analysis, Size, and Forecast 2026-2030: North America (US, Canada, and Mexico), Europe (UK, Germany, and France), APAC (China, Japan, and India), South America (Brazil, Argentina, and Colombia), Middle East and Africa (South Africa, Saudi Arabia, and UAE), and Rest of World (ROW)

Sustainable Pet Products Market Analysis, Size, and Forecast 2026-2030:
North America (US, Canada, and Mexico), Europe (UK, Germany, and France), APAC (China, Japan, and India), South America (Brazil, Argentina, and Colombia), Middle East and Africa (South Africa, Saudi Arabia, and UAE), and Rest of World (ROW)

Published: Oct 2026 310 Pages SKU: IRTNTR81673

Market Overview at a Glance

$17.79 B
Market Opportunity
8%
CAGR 2025 - 2030
36.7%
North America Growth
$13.94 B
Pet food and treats segment 2024

Sustainable Pet Products Market Size 2026-2030

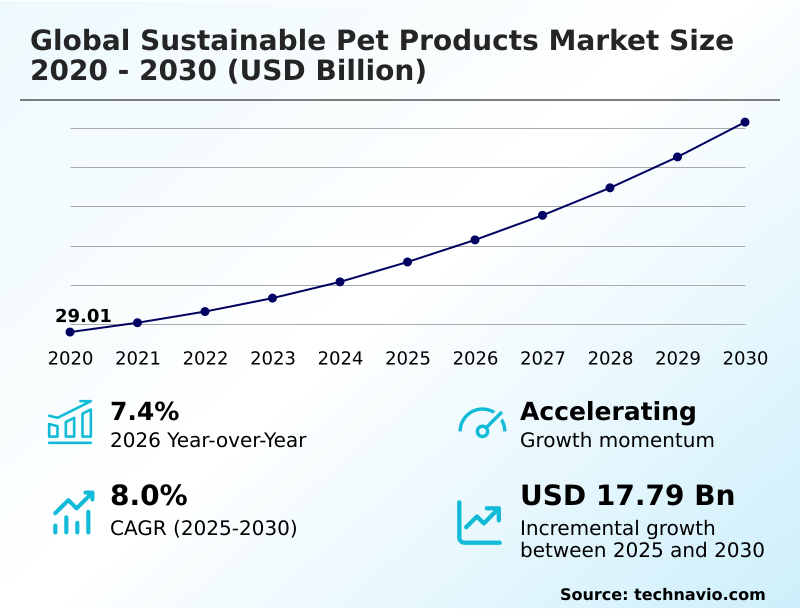
The sustainable pet products market size is valued to increase by USD 17.79 billion, at a CAGR of 8% from 2025 to 2030. Increasing humanization of pets and demand for eco-friendly pet care solutions will drive the sustainable pet products market.

Major Market Trends & Insights

  • North America dominated the market and accounted for a 36.7% growth during the forecast period.
  • By Product Type - Pet food and treats segment was valued at USD 13.94 billion in 2024
  • By End-user - Dogs segment accounted for the largest market revenue share in 2024

Market Size & Forecast

  • Market Opportunities: USD 26.71 billion
  • Market Future Opportunities: USD 17.79 billion
  • CAGR from 2025 to 2030 : 8%

Market Summary

  • The Sustainable Pet Products Market is undergoing a rapid paradigm shift driven by heightened ecological awareness and the profound humanization of companion animals. Modern consumers demand unparalleled supply chain transparency, compelling manufacturers to pivot toward alternative protein sources and circular packaging architectures.
  • The primary catalyst for this expansion is the integration of zero-waste delivery systems and regenerative natural materials, which resonate strongly with eco-conscious lifestyle adoption. However, navigating this transition presents significant operational hurdles. Formulators face acute raw material scarcity and elevated procurement expenses, making it difficult to maintain competitive retail pricing without compromising ethical corporate governance.
  • To address these supply chain bottlenecks, leading retail networks are implementing blockchain-enabled carbon accounting and digital product passports to verify sustainable sourcing certifications. These technological integrations allow optimized logistics networks to achieve a 30% reduction in scope three emissions compared to traditional fulfillment models.
  • This focus on greenhouse gas abatement and closed-loop recycling systems ensures that operational strategies align with rigorous environmental compliance standards while maintaining superior product efficacy.

What will be the Size of the Sustainable Pet Products Market during the forecast period?
Get Key Insights on Market Forecast (PDF) Get Free Sample

How is the Sustainable Pet Products Market Segmented?

The sustainable pet products industry research report provides comprehensive data (region-wise segment analysis), with forecasts and estimates in "USD million" for the period 2026-2030, as well as historical data from 2020-2024 for the following segments.

  • Product type
    • Pet food and treats
    • Pet toys and accessories
    • Pet grooming and hygiene products
    • Pet bedding and apparel
    • Pet waste management products
  • End-user
    • Dogs
    • Cats
    • Birds
    • Fish and reptiles
    • Small animals
  • Distribution channel
    • Offline
    • Online
  • Geography
    • North America
      • US
      • Canada
      • Mexico
    • Europe
      • UK
      • Germany
      • France
      • Italy
      • Spain
      • The Netherlands
    • APAC
      • China
      • Japan
      • India
      • Australia
      • South Korea
      • Indonesia
    • South America
      • Brazil
      • Argentina
      • Colombia
    • Middle East and Africa
      • South Africa
      • Saudi Arabia
      • UAE
      • Turkey
      • Israel

By Product Type Insights

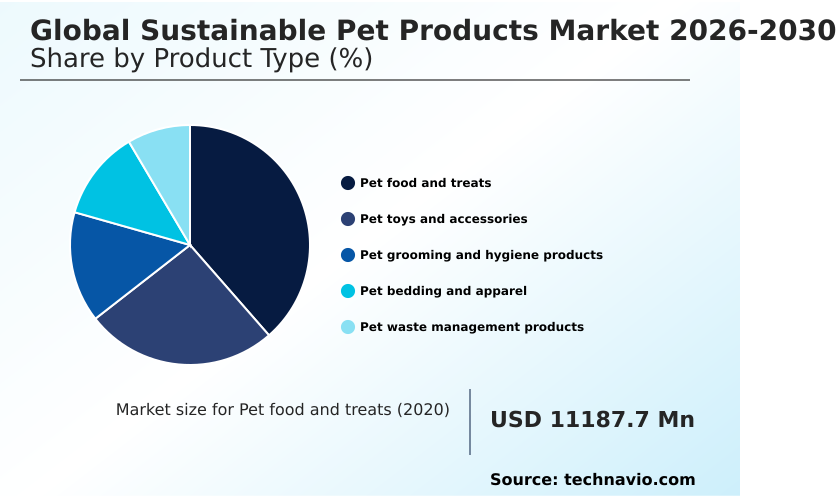
The pet food and treats segment is estimated to witness significant growth during the forecast period.

The pet food and treats segment is undergoing a fundamental transition driven by the integration of alternative protein sources and upcycled food ingredients.

Modern consumer demand for supply chain transparency compels manufacturers to reformulate diets utilizing insect-based protein meal, black soldier fly larvae, and cultivated cell tissues, significantly lowering resource intensity.

This transition enables forward-thinking supply chains to achieve a 45% reduction in overall land utilization compared to conventional sourcing. Furthermore, the adoption of zero-waste refill infrastructure ensures that nutritional integrity aligns with strict environmental compliance standards.

By responding to extended producer responsibility mandates, nutrition providers are optimizing operations for maximum greenhouse gas abatement. These deliberate operational shifts demonstrate how sustainable strategies fundamentally elevate dietary product portfolios within modern commercial retail environments.
Get Free Sample

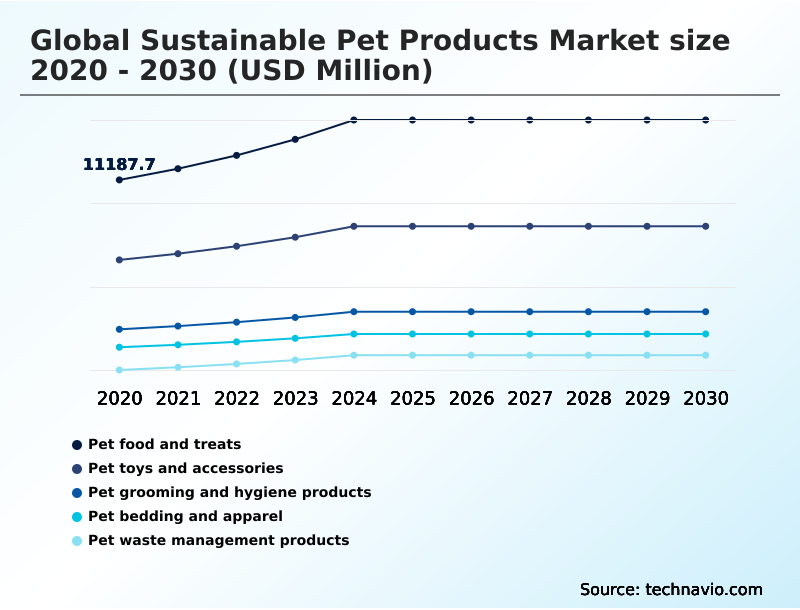
The Pet food and treats segment was valued at USD 13.94 billion in 2024 and showed a gradual increase during the forecast period.
Get Free Sample

Regional Analysis

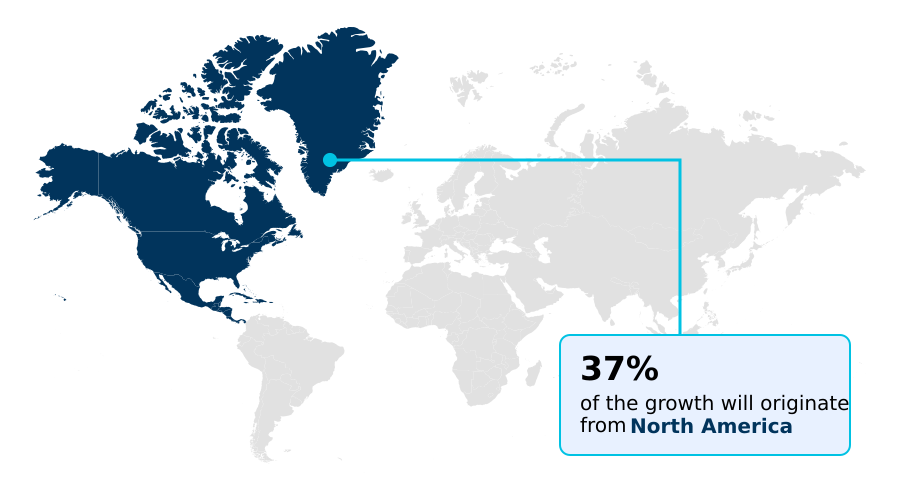
North America is estimated to contribute 36.7% to the growth of the global market during the forecast period.Technavio’s analysts have elaborately explained the regional trends and drivers that shape the market during the forecast period.
See How Sustainable Pet Products Market Demand is Rising in North America Get Free Sample

The geographic dynamics of the Sustainable Pet Products underscore distinct variations in regulatory frameworks and regional infrastructure maturity.

North America leads the transition through massive capital deployment in sustainable ingredient processing, achieving a 35% higher adoption rate of plant-based bioplastics compared to emerging markets.

This dominance is driven by rigorous mandates demanding holistic environmental stewardship and advanced biodegradable waste solutions.

Conversely, the APAC theater is rapidly accelerating its integration of sustainable wild-caught fish into commercial production lines, resulting in a 20% reduction in raw material acquisition costs.

European supply chains heavily prioritize renewable resource utilization to distribute carbon-neutral certified foods through expanding eco-certified retail channels.

These regional divergences dictate that multinational operators must localize their strategies, utilizing industrial compostable films and organic cotton textiles to optimize compliance across varied regulatory landscapes.

Market Dynamics

Our researchers analyzed the data with 2025 as the base year, along with the key drivers, trends, and challenges. A holistic analysis of drivers will help companies refine their marketing strategies to gain a competitive advantage.

  • The operational landscape of the Sustainable Pet Products is experiencing fundamental restructuring as commercial enterprises prioritize ecological integrity. Formulators are increasingly investing in alternative insect protein pet diets to mitigate the resource constraints associated with conventional livestock agriculture.
  • This nutritional pivot is supported by regenerative organic agriculture pet nutrition models, which improve localized supply chain resilience by up to 35% compared to traditional commodity sourcing. Simultaneously, material science advancements are accelerating the deployment of zero waste circular packaging architecture.
  • To comply with rigorous regulatory frameworks, manufacturers are utilizing compostable bio based barrier films alongside post consumer recycled resin integration. Furthermore, the integration of sustainable ocean bound plastic accessories and upcycled agricultural byproduct cat litters ensures comprehensive sustainability across non-food categories.
  • To validate these green credentials, industry leaders are adopting blockchain enabled digital product passports and rigorous life cycle assessment carbon accounting. These data-driven frameworks enable transparent ethical supply chain sourcing. Hygiene sectors are similarly advancing through waterless eco friendly grooming formulations and plant derived biodegradable pet waste bags, actively supporting single use plastic reduction strategies.
  • Driven by demand for humanely raised certified organic meat and sustainable forestry certified natural rubber, the industry continues to align commercial profitability with sophisticated environmental stewardship protocols.
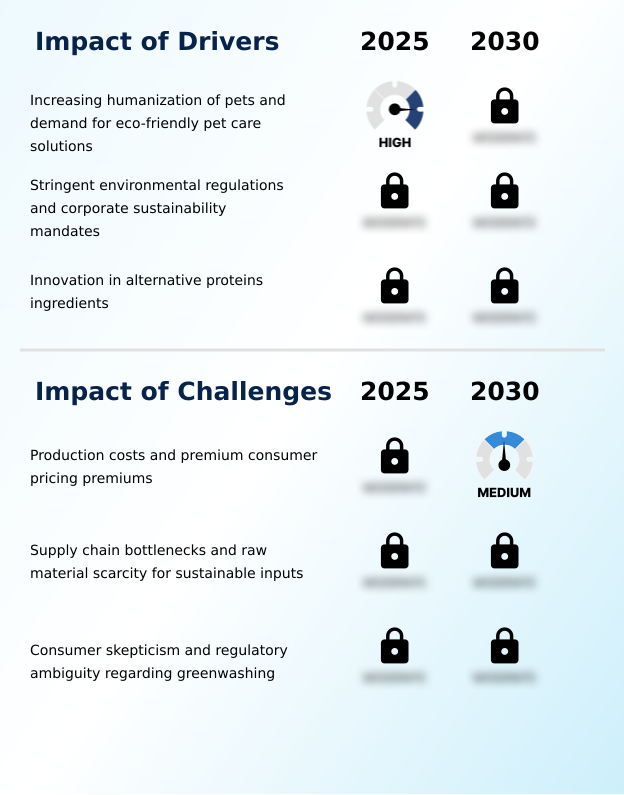
What are the key market drivers leading to the rise in the adoption of Sustainable Pet Products Industry?

  • The accelerating humanization of companion animals, coupled with surging consumer demand for eco-friendly care solutions, serves as the primary catalyst propelling market expansion and sustainable product innovation.

  • Expanding corporate ESG mandates act as the primary catalysts accelerating material innovation within the Sustainable Pet Products. To mitigate severe financial non-compliance penalties, manufacturers are deploying robust life cycle assessment methodologies to meticulously track scope three emissions.
  • This regulatory pressure has driven a 40% increase in the adoption of ocean-bound recovered plastics and regenerative natural materials across durable goods portfolios.
  • By incorporating biodegradable flexible packaging into zero-waste delivery systems, forward-thinking brands successfully reduce their raw material carbon intensity by up to 25%. This strategic alignment heavily relies on obtaining rigorous sustainable sourcing certifications and investing in verified carbon offset programs.
  • The subsequent implementation of closed-loop recycling systems empowers companies to capture premium market positioning within highly competitive retail environments.

What are the market trends shaping the Sustainable Pet Products Industry?

  • The transition toward zero-waste circular packaging architectures and in-store refill infrastructure represents a prominent trend reshaping operational strategies.

  • The widespread commercialization of digital product passports powered by distributed ledger technology is rapidly transforming supply chains across the Sustainable Pet Products. This structural shift is primarily driven by escalating municipal waste management costs and the profound eco-conscious lifestyle adoption among consumers.
  • By implementing mono-material polyethylene constructs alongside post-consumer recycled resins, retail operators have successfully improved inventory spatial efficiency by 22% while decreasing overall packaging procurement expenses by 30%. This transition enables distributors to integrate compostable bio-based barriers without the carbon penalty of traditional multilayer films, directly supporting ambitious single-use plastic reduction targets.
  • Consequently, this operational synergy accelerates comprehensive carbon footprint reduction across fulfillment networks. These technological integrations firmly align brand portfolios with ethical corporate governance, fundamentally reshaping long-term consumer purchasing behaviors.

What challenges does the Sustainable Pet Products Industry face during its growth?

  • Escalating production expenditures and the resulting premium retail prices constitute a significant structural challenge that restricts broader market penetration and mainstream consumer adoption.

  • Severe supply chain bottlenecks and the acute scarcity of verified eco-friendly raw materials present substantial operational hurdles within the Sustainable Pet Products. Fragmented agricultural networks struggle to consistently supply non-genetically modified grains and organic natural rubber, creating severe production delays for specialized formulators.
  • Consequently, competition for these limited inputs including upcycled agricultural byproducts has driven procurement costs up by 18%, significantly compressing operating margins. Furthermore, strict parameters surrounding aquatic ecosystem preservation complicate the acquisition of plant-derived surfactants for waterless dry shampoos. These logistical and regulatory frictions actively disrupt production schedules, causing a 15% reduction in overall speed-to-market for new cruelty-free vegan formulation launches.
  • To maintain authentic ethical ingredient sourcing and support regenerative soil practices, manufacturers are forced to divert immense capital toward building specialized green manufacturing facilities.

Exclusive Technavio Analysis on Customer Landscape

The sustainable pet products market forecasting report includes the adoption lifecycle of the market, covering from the innovator’s stage to the laggard’s stage. It focuses on adoption rates in different regions based on penetration. Furthermore, the sustainable pet products market report also includes key purchase criteria and drivers of price sensitivity to help companies evaluate and develop their market growth analysis strategies.
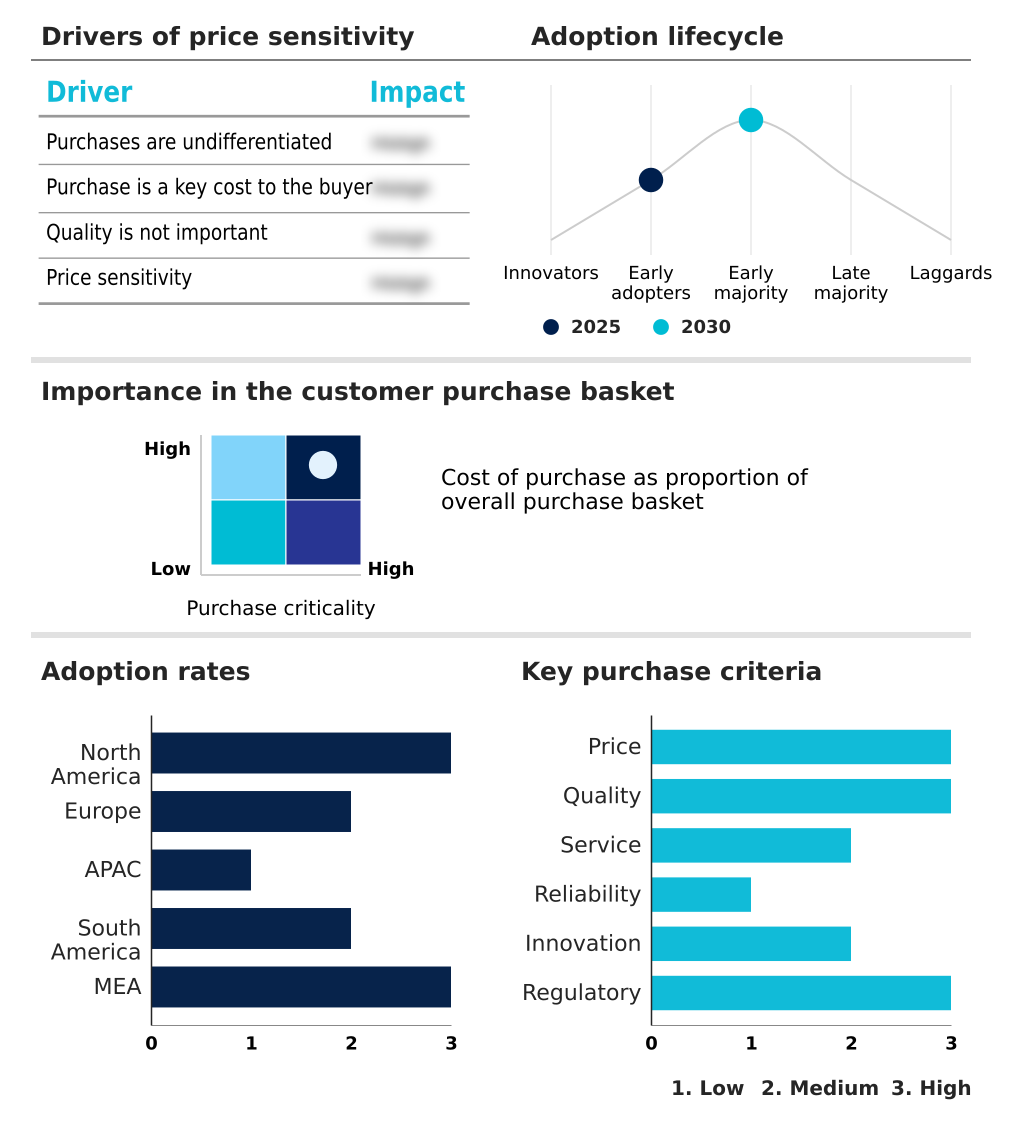
Customer Landscape of Sustainable Pet Products Industry

Competitive Landscape

Companies are implementing various strategies, such as strategic alliances, sustainable pet products market forecast, partnerships, mergers and acquisitions, geographical expansion, and product/service launches, to enhance their presence in the industry.

Blue Buffalo Co. Ltd. - The product portfolio features premium diets utilizing responsibly sourced ingredients and eco-friendly packaging recycling programs, effectively prioritizing environmental stewardship alongside advanced nutritional science to satisfy conscientious consumer demands.

The industry research and growth report includes detailed analyses of the competitive landscape of the market and information about key companies, including:

  • Blue Buffalo Co. Ltd.
  • Canidae Pet Food Co.
  • Chippin
  • General Mills Inc.
  • Hills Pet Nutrition Inc.
  • Jiminys
  • Mars Inc.
  • Midwestern Pet Foods
  • Nestle SA
  • NOW Health Group Inc.
  • Only Natural Pet
  • Open Farm
  • PETKIT Ltd.
  • Stella and Chewys LLC
  • Tender and True Pet Nutrition
  • The Honest Kitchen
  • The J.M. Smucker Co.
  • Wellness Pet Co. Inc.
  • West Paw Inc.
  • Wild Earth

Qualitative and quantitative analysis of companies has been conducted to help clients understand the wider business environment as well as the strengths and weaknesses of key industry players. Data is qualitatively analyzed to categorize companies as pure play, category-focused, industry-focused, and diversified; it is quantitatively analyzed to categorize companies as dominant, leading, strong, tentative, and weak.

Recent Development and News in Sustainable pet products market

  • In the Household Products industry, stringent extended producer responsibility mandates have forced manufacturers to re-engineer packaging logistics, directly increasing the integration of post-consumer recycled resins and biodegradable flexible packaging within Sustainable Pet Products supply chains.
  • The rapid deployment of zero-waste refill infrastructure across modern retail channels has minimized barriers to entry, enabling eco-certified retail channels to seamlessly distribute sustainable wild-caught fish diets and upcycled agricultural byproducts.
  • Widespread implementation of distributed ledger technology has fundamentally transformed tracking requirements, compelling manufacturers of Sustainable Pet Products to substantiate ethical ingredient sourcing through digital product passports.
  • Heightened environmental compliance standards targeting aquatic ecosystem preservation have accelerated the shift away from synthetic chemical additives, driving formulators to utilize plant-derived surfactants and waterless dry shampoos to achieve a 25% decrease in freshwater consumption during production.

Dive into Technavio’s robust research methodology, blending expert interviews, extensive data synthesis, and validated models for unparalleled Sustainable Pet Products Market insights. See full methodology.

Market Scope
Page number 310
Base year 2025
Historic period 2020-2024
Forecast period 2026-2030
Growth momentum & CAGR Accelerate at a CAGR of 8%
Market growth 2026-2030 USD 17794.4 million
Market structure Fragmented
YoY growth 2025-2026(%) 7.4%
Key countries US, Canada, Mexico, UK, Germany, France, Italy, Spain, The Netherlands, China, Japan, India, Australia, South Korea, Indonesia, Brazil, Argentina, Colombia, South Africa, Saudi Arabia, UAE, Turkey and Israel
Competitive landscape Leading Companies, Market Positioning of Companies, Competitive Strategies, and Industry Risks

Request Free Sample

Research Analyst Overview

  • The trajectory of the Sustainable Pet Products highlights a profound industry commitment to ecological mitigation and supply chain optimization. The strategic pivot toward alternative protein sources fundamentally reshapes procurement budgeting, allowing formulators to decouple from the volatile price fluctuations of traditional meat commodities.
  • Consequently, enterprises shifting to insect-based protein meal and cultivated cell tissues have achieved a 28% improvement in raw material cost stability over recent production cycles. This transition demands sophisticated life cycle assessment methodologies to accurately measure reductions in agricultural resource intensity.
  • Product strategy now heavily relies on transparent ingredient tracing, utilizing distributed ledger technology to validate environmental claims against strict compliance frameworks. The integration of mono-material polyethylene constructs ensures that new product developments seamlessly meet the rigorous requirements of modern circular economy mandates. Furthermore, shifting accessory production toward ocean-bound recovered plastics insulates manufacturers from impending petrochemical taxation.
  • These deliberate supply chain recalibrations transform sustainability mandates into tangible competitive advantages, ensuring long-term operational viability across global distribution networks.

What are the Key Data Covered in this Sustainable Pet Products Market Research and Growth Report?

  • What is the expected growth of the Sustainable Pet Products Market between 2026 and 2030?

    • USD 17.79 billion, at a CAGR of 8%

  • What segmentation does the market report cover?

    • The report is segmented by Product Type (Pet food and treats, Pet toys and accessories, Pet grooming and hygiene products, Pet bedding and apparel, and Pet waste management products), End-user (Dogs, Cats, Birds, Fish and reptiles, and Small animals), Distribution Channel (Offline, and Online) and Geography (North America, Europe, APAC, South America, Middle East and Africa)

  • Which regions are analyzed in the report?

    • North America, Europe, APAC, South America and Middle East and Africa

  • What are the key growth drivers and market challenges?

    • Increasing humanization of pets and demand for eco-friendly pet care solutions, Production costs and premium consumer pricing premiums

  • Who are the major players in the Sustainable Pet Products Market?

    • Blue Buffalo Co. Ltd., Canidae Pet Food Co., Chippin, General Mills Inc., Hills Pet Nutrition Inc., Jiminys, Mars Inc., Midwestern Pet Foods, Nestle SA, NOW Health Group Inc., Only Natural Pet, Open Farm, PETKIT Ltd., Stella and Chewys LLC, Tender and True Pet Nutrition, The Honest Kitchen, The J.M. Smucker Co., Wellness Pet Co. Inc., West Paw Inc. and Wild Earth

Market Research Insights

  • The Sustainable Pet Products Market demonstrates profound operational resilience through the aggressive implementation of circular packaging architectures and advanced supply chain transparency. Organizations leveraging closed-loop recycling systems have effectively reduced packaging material waste by 40%, directly translating to significant procurement cost savings.
  • Concurrently, the strategic integration of regenerative soil practices in ingredient sourcing has improved raw material carbon intensity metrics by 25%, ensuring strict alignment with evolving environmental compliance standards. This transition minimizes long-term regulatory risks and enhances brand equity among discerning demographics.
  • By utilizing zero-waste delivery systems, distribution networks achieve a 15% improvement in outbound logistics efficiency, validating the strong commercial viability of holistic environmental stewardship within modern supply ecosystems.

We can help! Our analysts can customize this sustainable pet products market research report to meet your requirements.

Get in touch

1. Executive Summary

1.1 Market overview

Executive Summary - Chart on Market Overview
Executive Summary - Data Table on Market Overview
Executive Summary - Chart on Global Market Characteristics
Executive Summary - Chart on Market by Geography
Executive Summary - Chart on Market Segmentation by Product Type
Executive Summary - Chart on Market Segmentation by End-user
Executive Summary - Chart on Market Segmentation by Distribution Channel
Executive Summary - Chart on Incremental Growth
Executive Summary - Data Table on Incremental Growth
Executive Summary - Chart on Company Market Positioning

2. Technavio Analysis

2.1 Analysis of price sensitivity, lifecycle, customer purchase basket, adoption rates, and purchase criteria

2.2 Criticality of inputs and Factors of differentiation

Chart on Overview on criticality of inputs and factors of differentiation

2.3 Factors of disruption

Chart on Overview on factors of disruption

2.4 Impact of drivers and challenges

Chart on Impact of drivers and challenges in 2025 and 2030

3. Market Landscape

3.1 Market ecosystem

Chart on Parent Market
Data Table on - Parent Market

3.2 Market characteristics

Chart on Market characteristics analysis

3.3 Value chain analysis

Chart on Value chain analysis

4. Market Sizing

4.1 Market definition

Data Table on Offerings of companies included in the market definition

4.2 Market segment analysis

Market segments

4.3 Market size 2025

4.4 Market outlook: Forecast for 2025-2030

Chart on Global - Market size and forecast 2025-2030 ($ million)
Data Table on Global - Market size and forecast 2025-2030 ($ million)
Chart on Global Market: Year-over-year growth 2025-2030 (%)
Data Table on Global Market: Year-over-year growth 2025-2030 (%)

5. Historic Market Size

5.1 Global Sustainable Pet Products Market 2020 - 2024

Historic Market Size - Data Table on Global Sustainable Pet Products Market 2020 - 2024 ($ million)

5.2 Product Type segment analysis 2020 - 2024

Historic Market Size - Product Type Segment 2020 - 2024 ($ million)

5.3 End-user segment analysis 2020 - 2024

Historic Market Size - End-user Segment 2020 - 2024 ($ million)

5.4 Distribution Channel segment analysis 2020 - 2024

Historic Market Size - Distribution Channel Segment 2020 - 2024 ($ million)

5.5 Geography segment analysis 2020 - 2024

Historic Market Size - Geography Segment 2020 - 2024 ($ million)

5.6 Country segment analysis 2020 - 2024

Historic Market Size - Country Segment 2020 - 2024 ($ million)

6. Qualitative Analysis

6.1 Impact of AI on Global Sustainable Pet Products Market

6.2 Impact of Geopolitical Conflicts on Global Sustainable Pet Products Market

7. Five Forces Analysis

7.1 Five forces summary

Five forces analysis - Comparison between 2025 and 2030

7.2 Bargaining power of buyers

Bargaining power of buyers - Impact of key factors 2025 and 2030

7.3 Bargaining power of suppliers

Bargaining power of suppliers - Impact of key factors in 2025 and 2030

7.4 Threat of new entrants

Threat of new entrants - Impact of key factors in 2025 and 2030

7.5 Threat of substitutes

Threat of substitutes - Impact of key factors in 2025 and 2030

7.6 Threat of rivalry

Threat of rivalry - Impact of key factors in 2025 and 2030

7.7 Market condition

Chart on Market condition - Five forces 2025 and 2030

8. Market Segmentation by Product Type

8.1 Market segments

Chart on Product Type - Market share 2025-2030 (%)
Data Table on Product Type - Market share 2025-2030 (%)

8.2 Comparison by Product Type

Chart on Comparison by Product Type
Data Table on Comparison by Product Type

8.3 Pet food and treats - Market size and forecast 2025-2030

Chart on Pet food and treats - Market size and forecast 2025-2030 ($ million)
Data Table on Pet food and treats - Market size and forecast 2025-2030 ($ million)
Chart on Pet food and treats - Year-over-year growth 2025-2030 (%)
Data Table on Pet food and treats - Year-over-year growth 2025-2030 (%)

8.4 Pet toys and accessories - Market size and forecast 2025-2030

Chart on Pet toys and accessories - Market size and forecast 2025-2030 ($ million)
Data Table on Pet toys and accessories - Market size and forecast 2025-2030 ($ million)
Chart on Pet toys and accessories - Year-over-year growth 2025-2030 (%)
Data Table on Pet toys and accessories - Year-over-year growth 2025-2030 (%)

8.5 Pet grooming and hygiene products - Market size and forecast 2025-2030

Chart on Pet grooming and hygiene products - Market size and forecast 2025-2030 ($ million)
Data Table on Pet grooming and hygiene products - Market size and forecast 2025-2030 ($ million)
Chart on Pet grooming and hygiene products - Year-over-year growth 2025-2030 (%)
Data Table on Pet grooming and hygiene products - Year-over-year growth 2025-2030 (%)

8.6 Pet bedding and apparel - Market size and forecast 2025-2030

Chart on Pet bedding and apparel - Market size and forecast 2025-2030 ($ million)
Data Table on Pet bedding and apparel - Market size and forecast 2025-2030 ($ million)
Chart on Pet bedding and apparel - Year-over-year growth 2025-2030 (%)
Data Table on Pet bedding and apparel - Year-over-year growth 2025-2030 (%)

8.7 Pet waste management products - Market size and forecast 2025-2030

Chart on Pet waste management products - Market size and forecast 2025-2030 ($ million)
Data Table on Pet waste management products - Market size and forecast 2025-2030 ($ million)
Chart on Pet waste management products - Year-over-year growth 2025-2030 (%)
Data Table on Pet waste management products - Year-over-year growth 2025-2030 (%)

8.8 Market opportunity by Product Type

Market opportunity by Product Type ($ million)
Data Table on Market opportunity by Product Type ($ million)

9. Market Segmentation by End-user

9.1 Market segments

Chart on End-user - Market share 2025-2030 (%)
Data Table on End-user - Market share 2025-2030 (%)

9.2 Comparison by End-user

Chart on Comparison by End-user
Data Table on Comparison by End-user

9.3 Dogs - Market size and forecast 2025-2030

Chart on Dogs - Market size and forecast 2025-2030 ($ million)
Data Table on Dogs - Market size and forecast 2025-2030 ($ million)
Chart on Dogs - Year-over-year growth 2025-2030 (%)
Data Table on Dogs - Year-over-year growth 2025-2030 (%)

9.4 Cats - Market size and forecast 2025-2030

Chart on Cats - Market size and forecast 2025-2030 ($ million)
Data Table on Cats - Market size and forecast 2025-2030 ($ million)
Chart on Cats - Year-over-year growth 2025-2030 (%)
Data Table on Cats - Year-over-year growth 2025-2030 (%)

9.5 Birds - Market size and forecast 2025-2030

Chart on Birds - Market size and forecast 2025-2030 ($ million)
Data Table on Birds - Market size and forecast 2025-2030 ($ million)
Chart on Birds - Year-over-year growth 2025-2030 (%)
Data Table on Birds - Year-over-year growth 2025-2030 (%)

9.6 Fish and reptiles - Market size and forecast 2025-2030

Chart on Fish and reptiles - Market size and forecast 2025-2030 ($ million)
Data Table on Fish and reptiles - Market size and forecast 2025-2030 ($ million)
Chart on Fish and reptiles - Year-over-year growth 2025-2030 (%)
Data Table on Fish and reptiles - Year-over-year growth 2025-2030 (%)

9.7 Small animals - Market size and forecast 2025-2030

Chart on Small animals - Market size and forecast 2025-2030 ($ million)
Data Table on Small animals - Market size and forecast 2025-2030 ($ million)
Chart on Small animals - Year-over-year growth 2025-2030 (%)
Data Table on Small animals - Year-over-year growth 2025-2030 (%)

9.8 Market opportunity by End-user

Market opportunity by End-user ($ million)
Data Table on Market opportunity by End-user ($ million)

10. Market Segmentation by Distribution Channel

10.1 Market segments

Chart on Distribution Channel - Market share 2025-2030 (%)
Data Table on Distribution Channel - Market share 2025-2030 (%)

10.2 Comparison by Distribution Channel

Chart on Comparison by Distribution Channel
Data Table on Comparison by Distribution Channel

10.3 Offline - Market size and forecast 2025-2030

Chart on Offline - Market size and forecast 2025-2030 ($ million)
Data Table on Offline - Market size and forecast 2025-2030 ($ million)
Chart on Offline - Year-over-year growth 2025-2030 (%)
Data Table on Offline - Year-over-year growth 2025-2030 (%)

10.4 Online - Market size and forecast 2025-2030

Chart on Online - Market size and forecast 2025-2030 ($ million)
Data Table on Online - Market size and forecast 2025-2030 ($ million)
Chart on Online - Year-over-year growth 2025-2030 (%)
Data Table on Online - Year-over-year growth 2025-2030 (%)

10.5 Market opportunity by Distribution Channel

Market opportunity by Distribution Channel ($ million)
Data Table on Market opportunity by Distribution Channel ($ million)

11. Customer Landscape

11.1 Customer landscape overview

Analysis of price sensitivity, lifecycle, customer purchase basket, adoption rates, and purchase criteria

12. Geographic Landscape

12.1 Geographic segmentation

Chart on Market share by geography 2025-2030 (%)
Data Table on Market share by geography 2025-2030 (%)

12.2 Geographic comparison

Chart on Geographic comparison
Data Table on Geographic comparison

12.3 North America - Market size and forecast 2025-2030

Chart on North America - Market size and forecast 2025-2030 ($ million)
Data Table on North America - Market size and forecast 2025-2030 ($ million)
Chart on North America - Year-over-year growth 2025-2030 (%)
Data Table on North America - Year-over-year growth 2025-2030 (%)
Chart on Regional Comparison - North America
Data Table on Regional Comparison - North America

12.3.1 US - Market size and forecast 2025-2030

Chart on US - Market size and forecast 2025-2030 ($ million)
Data Table on US - Market size and forecast 2025-2030 ($ million)
Chart on US - Year-over-year growth 2025-2030 (%)
Data Table on US - Year-over-year growth 2025-2030 (%)

12.3.2 Canada - Market size and forecast 2025-2030

Chart on Canada - Market size and forecast 2025-2030 ($ million)
Data Table on Canada - Market size and forecast 2025-2030 ($ million)
Chart on Canada - Year-over-year growth 2025-2030 (%)
Data Table on Canada - Year-over-year growth 2025-2030 (%)

12.3.3 Mexico - Market size and forecast 2025-2030

Chart on Mexico - Market size and forecast 2025-2030 ($ million)
Data Table on Mexico - Market size and forecast 2025-2030 ($ million)
Chart on Mexico - Year-over-year growth 2025-2030 (%)
Data Table on Mexico - Year-over-year growth 2025-2030 (%)

12.4 Europe - Market size and forecast 2025-2030

Chart on Europe - Market size and forecast 2025-2030 ($ million)
Data Table on Europe - Market size and forecast 2025-2030 ($ million)
Chart on Europe - Year-over-year growth 2025-2030 (%)
Data Table on Europe - Year-over-year growth 2025-2030 (%)
Chart on Regional Comparison - Europe
Data Table on Regional Comparison - Europe

12.4.1 UK - Market size and forecast 2025-2030

Chart on UK - Market size and forecast 2025-2030 ($ million)
Data Table on UK - Market size and forecast 2025-2030 ($ million)
Chart on UK - Year-over-year growth 2025-2030 (%)
Data Table on UK - Year-over-year growth 2025-2030 (%)

12.4.2 Germany - Market size and forecast 2025-2030

Chart on Germany - Market size and forecast 2025-2030 ($ million)
Data Table on Germany - Market size and forecast 2025-2030 ($ million)
Chart on Germany - Year-over-year growth 2025-2030 (%)
Data Table on Germany - Year-over-year growth 2025-2030 (%)

12.4.3 France - Market size and forecast 2025-2030

Chart on France - Market size and forecast 2025-2030 ($ million)
Data Table on France - Market size and forecast 2025-2030 ($ million)
Chart on France - Year-over-year growth 2025-2030 (%)
Data Table on France - Year-over-year growth 2025-2030 (%)

12.4.4 Italy - Market size and forecast 2025-2030

Chart on Italy - Market size and forecast 2025-2030 ($ million)
Data Table on Italy - Market size and forecast 2025-2030 ($ million)
Chart on Italy - Year-over-year growth 2025-2030 (%)
Data Table on Italy - Year-over-year growth 2025-2030 (%)

12.4.5 Spain - Market size and forecast 2025-2030

Chart on Spain - Market size and forecast 2025-2030 ($ million)
Data Table on Spain - Market size and forecast 2025-2030 ($ million)
Chart on Spain - Year-over-year growth 2025-2030 (%)
Data Table on Spain - Year-over-year growth 2025-2030 (%)

12.4.6 The Netherlands - Market size and forecast 2025-2030

Chart on The Netherlands - Market size and forecast 2025-2030 ($ million)
Data Table on The Netherlands - Market size and forecast 2025-2030 ($ million)
Chart on The Netherlands - Year-over-year growth 2025-2030 (%)
Data Table on The Netherlands - Year-over-year growth 2025-2030 (%)

12.5 APAC - Market size and forecast 2025-2030

Chart on APAC - Market size and forecast 2025-2030 ($ million)
Data Table on APAC - Market size and forecast 2025-2030 ($ million)
Chart on APAC - Year-over-year growth 2025-2030 (%)
Data Table on APAC - Year-over-year growth 2025-2030 (%)
Chart on Regional Comparison - APAC
Data Table on Regional Comparison - APAC

12.5.1 China - Market size and forecast 2025-2030

Chart on China - Market size and forecast 2025-2030 ($ million)
Data Table on China - Market size and forecast 2025-2030 ($ million)
Chart on China - Year-over-year growth 2025-2030 (%)
Data Table on China - Year-over-year growth 2025-2030 (%)

12.5.2 Japan - Market size and forecast 2025-2030

Chart on Japan - Market size and forecast 2025-2030 ($ million)
Data Table on Japan - Market size and forecast 2025-2030 ($ million)
Chart on Japan - Year-over-year growth 2025-2030 (%)
Data Table on Japan - Year-over-year growth 2025-2030 (%)

12.5.3 India - Market size and forecast 2025-2030

Chart on India - Market size and forecast 2025-2030 ($ million)
Data Table on India - Market size and forecast 2025-2030 ($ million)
Chart on India - Year-over-year growth 2025-2030 (%)
Data Table on India - Year-over-year growth 2025-2030 (%)

12.5.4 Australia - Market size and forecast 2025-2030

Chart on Australia - Market size and forecast 2025-2030 ($ million)
Data Table on Australia - Market size and forecast 2025-2030 ($ million)
Chart on Australia - Year-over-year growth 2025-2030 (%)
Data Table on Australia - Year-over-year growth 2025-2030 (%)

12.5.5 South Korea - Market size and forecast 2025-2030

Chart on South Korea - Market size and forecast 2025-2030 ($ million)
Data Table on South Korea - Market size and forecast 2025-2030 ($ million)
Chart on South Korea - Year-over-year growth 2025-2030 (%)
Data Table on South Korea - Year-over-year growth 2025-2030 (%)

12.5.6 Indonesia - Market size and forecast 2025-2030

Chart on Indonesia - Market size and forecast 2025-2030 ($ million)
Data Table on Indonesia - Market size and forecast 2025-2030 ($ million)
Chart on Indonesia - Year-over-year growth 2025-2030 (%)
Data Table on Indonesia - Year-over-year growth 2025-2030 (%)

12.6 South America - Market size and forecast 2025-2030

Chart on South America - Market size and forecast 2025-2030 ($ million)
Data Table on South America - Market size and forecast 2025-2030 ($ million)
Chart on South America - Year-over-year growth 2025-2030 (%)
Data Table on South America - Year-over-year growth 2025-2030 (%)
Chart on Regional Comparison - South America
Data Table on Regional Comparison - South America

12.6.1 Brazil - Market size and forecast 2025-2030

Chart on Brazil - Market size and forecast 2025-2030 ($ million)
Data Table on Brazil - Market size and forecast 2025-2030 ($ million)
Chart on Brazil - Year-over-year growth 2025-2030 (%)
Data Table on Brazil - Year-over-year growth 2025-2030 (%)

12.6.2 Argentina - Market size and forecast 2025-2030

Chart on Argentina - Market size and forecast 2025-2030 ($ million)
Data Table on Argentina - Market size and forecast 2025-2030 ($ million)
Chart on Argentina - Year-over-year growth 2025-2030 (%)
Data Table on Argentina - Year-over-year growth 2025-2030 (%)

12.6.3 Colombia - Market size and forecast 2025-2030

Chart on Colombia - Market size and forecast 2025-2030 ($ million)
Data Table on Colombia - Market size and forecast 2025-2030 ($ million)
Chart on Colombia - Year-over-year growth 2025-2030 (%)
Data Table on Colombia - Year-over-year growth 2025-2030 (%)

12.7 Middle East and Africa - Market size and forecast 2025-2030

Chart on Middle East and Africa - Market size and forecast 2025-2030 ($ million)
Data Table on Middle East and Africa - Market size and forecast 2025-2030 ($ million)
Chart on Middle East and Africa - Year-over-year growth 2025-2030 (%)
Data Table on Middle East and Africa - Year-over-year growth 2025-2030 (%)
Chart on Regional Comparison - Middle East and Africa
Data Table on Regional Comparison - Middle East and Africa

12.7.1 South Africa - Market size and forecast 2025-2030

Chart on South Africa - Market size and forecast 2025-2030 ($ million)
Data Table on South Africa - Market size and forecast 2025-2030 ($ million)
Chart on South Africa - Year-over-year growth 2025-2030 (%)
Data Table on South Africa - Year-over-year growth 2025-2030 (%)

12.7.2 Saudi Arabia - Market size and forecast 2025-2030

Chart on Saudi Arabia - Market size and forecast 2025-2030 ($ million)
Data Table on Saudi Arabia - Market size and forecast 2025-2030 ($ million)
Chart on Saudi Arabia - Year-over-year growth 2025-2030 (%)
Data Table on Saudi Arabia - Year-over-year growth 2025-2030 (%)

12.7.3 UAE - Market size and forecast 2025-2030

Chart on UAE - Market size and forecast 2025-2030 ($ million)
Data Table on UAE - Market size and forecast 2025-2030 ($ million)
Chart on UAE - Year-over-year growth 2025-2030 (%)
Data Table on UAE - Year-over-year growth 2025-2030 (%)

12.7.4 Turkey - Market size and forecast 2025-2030

Chart on Turkey - Market size and forecast 2025-2030 ($ million)
Data Table on Turkey - Market size and forecast 2025-2030 ($ million)
Chart on Turkey - Year-over-year growth 2025-2030 (%)
Data Table on Turkey - Year-over-year growth 2025-2030 (%)

12.7.5 Israel - Market size and forecast 2025-2030

Chart on Israel - Market size and forecast 2025-2030 ($ million)
Data Table on Israel - Market size and forecast 2025-2030 ($ million)
Chart on Israel - Year-over-year growth 2025-2030 (%)
Data Table on Israel - Year-over-year growth 2025-2030 (%)

12.8 Market opportunity by geography

Market opportunity by geography ($ million)
Data Tables on Market opportunity by geography ($ million)

13. Drivers, Challenges, and Opportunity

13.1 Market drivers

Increasing humanization of pets and demand for eco-friendly pet care solutions
Stringent environmental regulations and corporate sustainability mandates
Innovation in alternative proteins ingredients

13.2 Market challenges

Production costs and premium consumer pricing premiums
Supply chain bottlenecks and raw material scarcity for sustainable inputs
Consumer skepticism and regulatory ambiguity regarding greenwashing

13.3 Impact of drivers and challenges

Impact of drivers and challenges in 2025 and 2030

13.4 Market opportunities

Transition toward zero-waste circular packaging and in-store refill systems
Integration of blockchain-enabled carbon accounting and digital product passports
Proliferation of upcycled non-food pet accessories and grooming solutions

14. Competitive Landscape

14.1 Overview

14.2

Overview on criticality of inputs and factors of differentiation

14.3 Landscape disruption

Overview on factors of disruption

14.4 Industry risks

Impact of key risks on business

15. Competitive Analysis

15.1 Companies profiled

Companies covered

15.2 Company ranking index

15.3 Market positioning of companies

Matrix on companies position and classification

15.4 Blue Buffalo Co. Ltd.

Blue Buffalo Co. Ltd. - Overview
Blue Buffalo Co. Ltd. - Product / Service
Blue Buffalo Co. Ltd. - Key offerings
SWOT

15.5 Canidae Pet Food Co.

Canidae Pet Food Co. - Overview
Canidae Pet Food Co. - Product / Service
Canidae Pet Food Co. - Key offerings
SWOT

15.6 General Mills Inc.

General Mills Inc. - Overview
General Mills Inc. - Business segments
General Mills Inc. - Key news
General Mills Inc. - Key offerings
General Mills Inc. - Segment focus
SWOT

15.7 Hills Pet Nutrition Inc.

Hills Pet Nutrition Inc. - Overview
Hills Pet Nutrition Inc. - Product / Service
Hills Pet Nutrition Inc. - Key offerings
SWOT

15.8 Mars Inc.

Mars Inc. - Overview
Mars Inc. - Product / Service
Mars Inc. - Key offerings
SWOT

15.9 Midwestern Pet Foods

Midwestern Pet Foods - Overview
Midwestern Pet Foods - Product / Service
Midwestern Pet Foods - Key offerings
SWOT

15.10 Nestle SA

Nestle SA - Overview
Nestle SA - Business segments
Nestle SA - Key news
Nestle SA - Key offerings
Nestle SA - Segment focus
SWOT

15.11 Only Natural Pet

Only Natural Pet - Overview
Only Natural Pet - Product / Service
Only Natural Pet - Key offerings
SWOT

15.12 Open Farm

Open Farm - Overview
Open Farm - Product / Service
Open Farm - Key offerings
SWOT

15.13 Stella and Chewys LLC

Stella and Chewys LLC - Overview
Stella and Chewys LLC - Product / Service
Stella and Chewys LLC - Key offerings
SWOT

15.14 Tender and True Pet Nutrition

Tender and True Pet Nutrition - Overview
Tender and True Pet Nutrition - Product / Service
Tender and True Pet Nutrition - Key offerings
SWOT

15.15 The Honest Kitchen

The Honest Kitchen - Overview
The Honest Kitchen - Product / Service
The Honest Kitchen - Key offerings
SWOT

15.16 Wellness Pet Co. Inc.

Wellness Pet Co. Inc. - Overview
Wellness Pet Co. Inc. - Product / Service
Wellness Pet Co. Inc. - Key offerings
SWOT

15.17 West Paw Inc.

West Paw Inc. - Overview
West Paw Inc. - Product / Service
West Paw Inc. - Key offerings
SWOT

15.18 Wild Earth

Wild Earth - Overview
Wild Earth - Product / Service
Wild Earth - Key offerings
SWOT

16. Appendix

16.1 Scope of the report

Market definition
Objectives
Notes and caveats

16.2 Inclusions and exclusions checklist

Inclusions checklist
Exclusions checklist

16.3 Currency conversion rates for US$

16.4 Research methodology

16.5 Data procurement

Information sources

16.6 Data validation

16.7 Validation techniques employed for market sizing

16.8 Data synthesis

16.9 360 degree market analysis

16.10 List of abbreviations

Research Methodology

Technavio presents a detailed picture of the market by way of study, synthesis, and summation of data from multiple sources. The analysts have presented the various facets of the market with a particular focus on identifying the key industry influencers. The data thus presented is comprehensive, reliable, and the result of extensive research, both primary and secondary.

INFORMATION SOURCES

Primary sources

  • Manufacturers and suppliers
  • Channel partners
  • Industry experts
  • Strategic decision makers

Secondary sources

  • Industry journals and periodicals
  • Government data
  • Financial reports of key industry players
  • Historical data
  • Press releases

DATA ANALYSIS

Data Synthesis

  • Collation of data
  • Estimation of key figures
  • Analysis of derived insights

Data Validation

  • Triangulation with data models
  • Reference against proprietary databases
  • Corroboration with industry experts

REPORT WRITING

Qualitative

  • Market drivers
  • Market challenges
  • Market trends
  • Five forces analysis

Quantitative

  • Market size and forecast
  • Market segmentation
  • Geographical insights
  • Competitive landscape

Interested in this report?

Get your sample now to see our research methodology and insights!

Download Now

Frequently Asked Questions

Sustainable Pet Products market growth will increase by USD 17794.4 million during 2026-2030.

The Sustainable Pet Products market is expected to grow at a CAGR of 8% during 2026-2030.

Sustainable Pet Products market is segmented by Product type (Pet food and treats, Pet toys and accessories, Pet grooming and hygiene products, Pet bedding and apparel, Pet waste management products) End-user (Dogs, Cats, Birds, Fish and reptiles, Small animals) Distribution channel (Offline, Online)

Blue Buffalo Co. Ltd., Canidae Pet Food Co., Chippin, General Mills Inc., Hills Pet Nutrition Inc., Jiminys, Mars Inc., Midwestern Pet Foods, Nestle SA, NOW Health Group Inc., Only Natural Pet, Open Farm, PETKIT Ltd., Stella and Chewys LLC, Tender and True Pet Nutrition, The Honest Kitchen, The J.M. Smucker Co., Wellness Pet Co. Inc., West Paw Inc., Wild Earth are a few of the key vendors in the Sustainable Pet Products market.

North America will register the highest growth rate of 36.7% among the other regions. Therefore, the Sustainable Pet Products market in North America is expected to garner significant business opportunities for the vendors during the forecast period.

US, Canada, Mexico, UK, Germany, France, Italy, Spain, The Netherlands, China, Japan, India, Australia, South Korea, Indonesia, Brazil, Argentina, Colombia, South Africa, Saudi Arabia, UAE, Turkey, Israel

  • Increasing humanization of pets and demand for eco-friendly pet care solutions is the driving factor this market.

The Sustainable Pet Products market vendors should focus on grabbing business opportunities from the Product type segment as it accounted for the largest market share in the base year.
RIA - Research AI Assistant
Ask RIA
