
Synthetic Graphite Market Analysis, Size, and Forecast 2026-2030: APAC (China, Japan, and South Korea), Europe (Germany, France, and Italy), North America (US, Canada, and Mexico), South America (Brazil, Argentina, and Chile), Middle East and Africa (South Africa, Saudi Arabia, and UAE), and Rest of World (ROW)

Synthetic Graphite Market Analysis, Size, and Forecast 2026-2030:
APAC (China, Japan, and South Korea), Europe (Germany, France, and Italy), North America (US, Canada, and Mexico), South America (Brazil, Argentina, and Chile), Middle East and Africa (South Africa, Saudi Arabia, and UAE), and Rest of World (ROW)

Published: Oct 2026 302 Pages SKU: IRTNTR77778

Market Overview at a Glance

$7.20 B
Market Opportunity
5.3%
CAGR 2025 - 2030
48.1%
APAC Growth
$18.59 B
Direct sales segment 2024

Synthetic Graphite Market Size 2026-2030

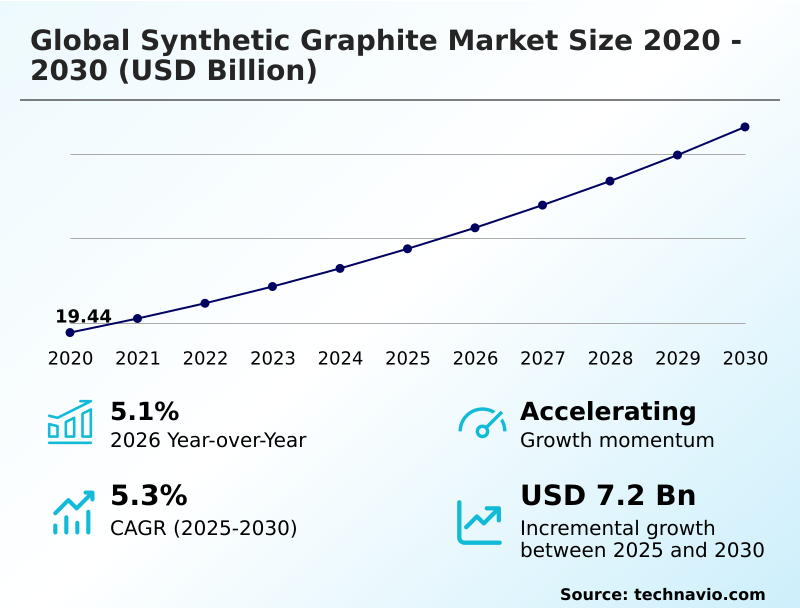
The synthetic graphite market size is valued to increase by USD 7.20 billion, at a CAGR of 5.3% from 2025 to 2030. Surging demand from electric vehicle and energy storage sectors will drive the synthetic graphite market.

Major Market Trends & Insights

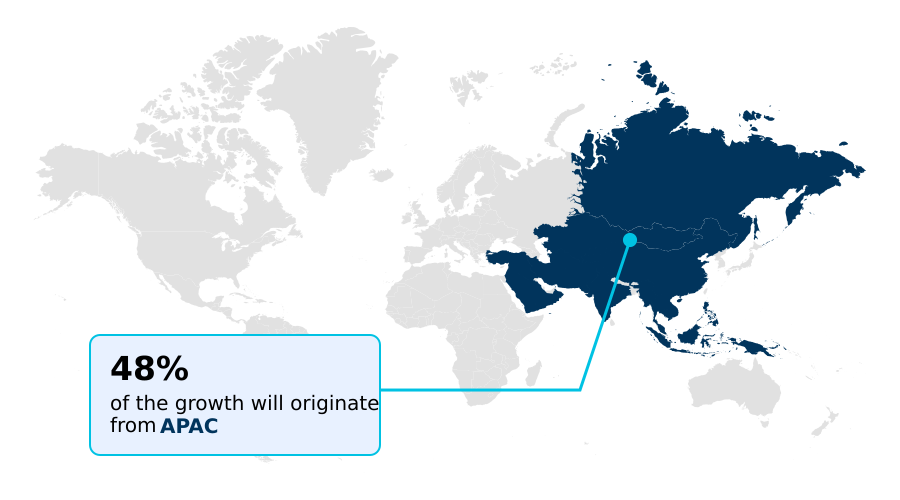
  • APAC dominated the market and accounted for a 48.1% growth during the forecast period.
  • By Distribution Channel - Direct sales segment was valued at USD 18.59 billion in 2024
  • By Application - Electrodes segment accounted for the largest market revenue share in 2024

Market Size & Forecast

  • Market Opportunities: USD 12.14 billion
  • Market Future Opportunities: USD 7.20 billion
  • CAGR from 2025 to 2030 : 5.3%

Market Summary

  • The Synthetic Graphite landscape demonstrates robust expansion, driven by the rapid industrial transition toward high-performance energy storage technologies and premium metallurgical manufacturing. A critical driver propelling this momentum is the exponential growth of the electric vehicle sector, which heavily relies on synthetic anode materials to achieve superior coulombic efficiency and fast-charging capabilities.
  • In a practical supply chain optimization scenario, battery gigafactories are securing multi-year commercial offtake contracts to guarantee material availability, resulting in a 25% improvement in production line uptime compared to spot-market sourcing. However, the industry faces substantial constraints due to energy-intensive manufacturing processes. The graphitization phase requires extreme thermal treatment, making producers highly vulnerable to volatile industrial electricity expenses.
  • This challenge compels manufacturers to optimize capacity and transition toward renewable power generation to maintain profitability. By balancing these dynamics, the sector continues to evolve, prioritizing structural stability and thermal conductivity to meet the rigorous specifications of advanced electronics and clean energy infrastructure.

What will be the Size of the Synthetic Graphite Market during the forecast period?
Get Key Insights on Market Forecast (PDF) Get Free Sample

How is the Synthetic Graphite Market Segmented?

The synthetic graphite industry research report provides comprehensive data (region-wise segment analysis), with forecasts and estimates in "USD million" for the period 2026-2030, as well as historical data from 2020-2024 for the following segments.

  • Distribution channel
    • Direct sales
    • Distributors
  • Application
    • Electrodes
    • Metallurgy
    • Parts and components
    • Nuclear
    • Others
  • Grade type
    • High-purity graphite
    • Fine-grain graphite
    • Coarse-grain graphite
    • Isotropic graphite
  • Geography
    • APAC
      • China
      • Japan
      • South Korea
      • India
      • Taiwan
      • Indonesia
    • Europe
      • Germany
      • France
      • Italy
      • UK
      • Spain
      • Norway
    • North America
      • US
      • Canada
      • Mexico
    • South America
      • Brazil
      • Argentina
      • Chile
    • Middle East and Africa
      • South Africa
      • Saudi Arabia
      • UAE
      • Egypt
      • Turkey

By Distribution Channel Insights

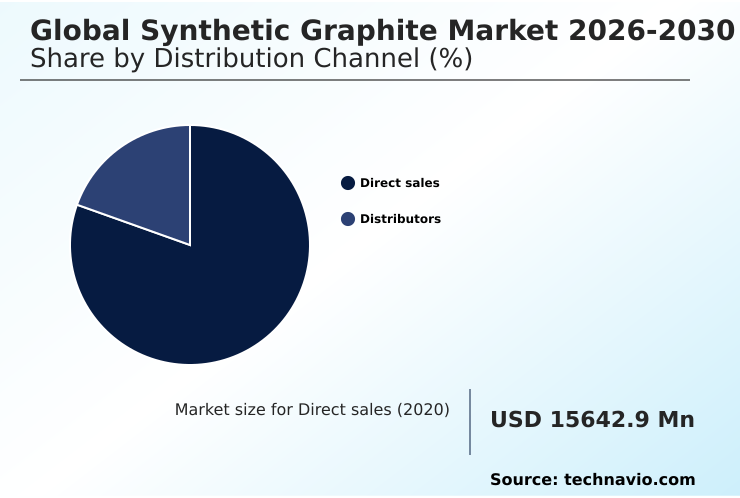
The direct sales segment is estimated to witness significant growth during the forecast period.

The direct sales distribution model fundamentally reshapes procurement strategies for capital-intensive industrial operations dependent on Synthetic Graphite. Direct procurement mechanisms allow tier-one automotive and metallurgical manufacturers to bypass intermediaries, establishing commercial offtake contracts directly with producers.

This streamlined approach enables customized material engineering to meet stringent battery cycle life specifications and high-purity graphite requirements.

By engaging directly with synthesis facilities, industrial purchasers achieve a 15% improvement in supply chain transparency, ensuring strict adherence to environmental compliance metrics. Direct sales facilitate seamless technical collaboration, allowing research teams to formulate bespoke lithium-ion battery anode solutions.

This distribution channel behaves differently from indirect networks by providing price stability and guaranteed capacity allocation during volatile raw material processing cycles, ultimately protecting production margins for high-volume consumers.
Get Free Sample

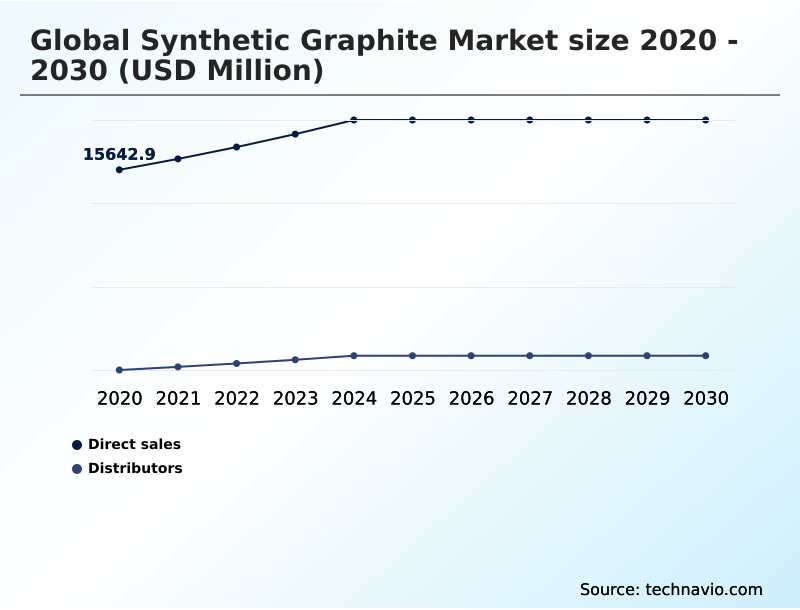
The Direct sales segment was valued at USD 18.59 billion in 2024 and showed a gradual increase during the forecast period.
Get Free Sample

Regional Analysis

APAC is estimated to contribute 48.1% to the growth of the global market during the forecast period.Technavio’s analysts have elaborately explained the regional trends and drivers that shape the market during the forecast period.
See How Synthetic Graphite Market Demand is Rising in APAC Get Free Sample

The geographic distribution of the Synthetic Graphite sector reveals stark operational contrasts, particularly between APAC and Europe. APAC dominates the landscape, driven by massive battery gigafactories and extensive secondary steelmaking infrastructure.

Facilities in APAC achieve a 40% higher throughput in raw material processing compared to European counterparts, largely due to integrated supply chains and established access to petroleum needle coke.

Conversely, Europe is accelerating its focus on sustainable manufacturing processes, implementing stringent environmental compliance metrics that have reduced the carbon footprint of regional graphitization process operations by 25%.

This regulatory pressure in Europe has increased the adoption of bio-based feedstocks by 15%, shifting consumer behavior toward premium, low-emission materials.

While APAC prioritizes scale and rapid capacity optimization to meet surging electric vehicle demand, Europe emphasizes supply chain diversification and closed-loop purification systems to build resilient, localized ecosystems for specialty metallurgy and advanced electronics.

Market Dynamics

Our researchers analyzed the data with 2025 as the base year, along with the key drivers, trends, and challenges. A holistic analysis of drivers will help companies refine their marketing strategies to gain a competitive advantage.

  • The continuous evolution of the Synthetic Graphite sector demands rigorous strategic planning, particularly as manufacturers navigate complex material specifications and stringent performance benchmarks. A critical focus area for industry leaders is the development of high purity anode active materials, which are essential for maximizing energy density in modern electrochemical applications.
  • By optimizing the sustainable graphitization process efficiency, producers can achieve a 30% reduction in thermal energy waste compared to legacy manufacturing techniques, directly enhancing operational planning and compliance with emerging environmental mandates.
  • Furthermore, the integration of silicon graphite composite anode materials is transforming energy storage capabilities, offering superior capacity retention and significantly extending the lithium ion battery cycle life under demanding fast-charging conditions. In the metallurgical domain, the structural integrity of electric arc furnace electrode structures remains paramount for operational success.
  • Steelmakers heavily rely on these highly engineered components to withstand extreme thermal shock and aggressive current densities during secondary scrap melting operations. As supply chains become increasingly localized, procurement teams are prioritizing vendor partnerships that guarantee consistent material quality and long-term supply security.
  • This strategic shift ensures that both advanced electronics manufacturers and heavy industrial sectors maintain uninterrupted production cycles while actively aligning with broader corporate decarbonization objectives.
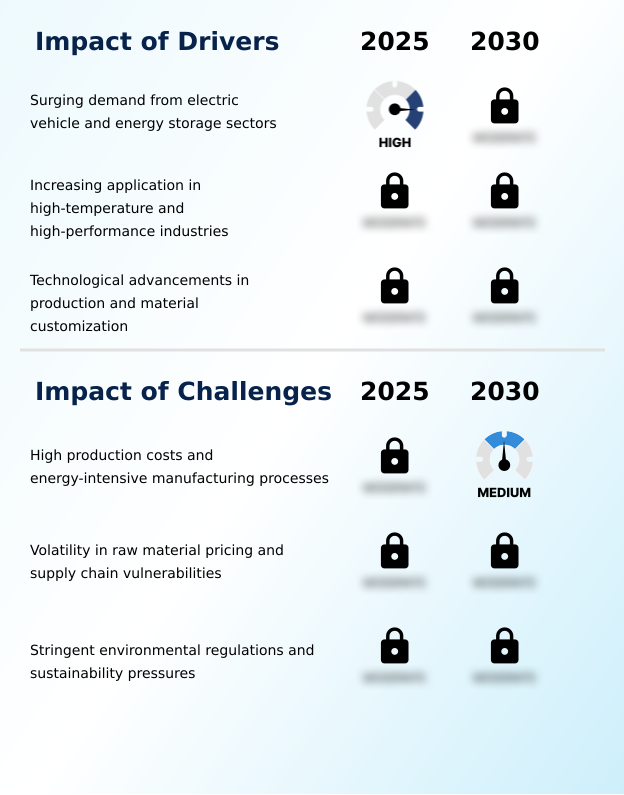
What are the key market drivers leading to the rise in the adoption of Synthetic Graphite Industry?

  • Surging demand from the electric vehicle and energy storage sectors serves as the primary driver propelling market expansion.

  • The exponential expansion of electric vehicle manufacturing and grid-scale energy storage initiatives serves as the primary catalyst propelling the Synthetic Graphite sector.
  • Because modern lithium-ion battery anode designs require exceptional coulombic efficiency and thermal conductivity, cell manufacturers rely heavily on engineered carbon materials to ensure safety and longevity.
  • This surging demand has prompted battery gigafactories to establish localized battery supply networks, resulting in a 30% reduction in logistical downtime and a 20% improvement in production forecasting accuracy.
  • Furthermore, the global push to achieve industrial decarbonization targets is accelerating the modernization of secondary steelmaking operations.
  • The increased deployment of electric arc furnace technologies demands reliable, ultra-high-power electrode structures, ensuring that heavy industries can maintain continuous melting operations while significantly reducing their overarching carbon footprint.

What are the market trends shaping the Synthetic Graphite Industry?

  • The transition toward sustainable and green production methods represents a pivotal trend shaping the industry. Manufacturers are increasingly adopting eco-friendly processes to minimize environmental impact and enhance operational efficiency.

  • The Synthetic Graphite landscape is undergoing a pivotal transformation driven by the rapid adoption of sustainable manufacturing processes and circular economy principles. As regulatory frameworks mandate stringent greenhouse gas emissions reductions, manufacturers are actively integrating bio-based feedstocks and implementing advanced waste heat recovery mechanisms.
  • This systemic shift toward green synthesis has decreased energy consumption by 25% and improved overall operational efficiency by 18% compared to conventional thermal treatments. Consequently, businesses are leveraging these innovations to enhance their environmental compliance metrics while simultaneously lowering processing expenses.
  • The development of silicon-graphite composites is also accelerating, addressing the need for higher energy density in advanced energy storage systems. By prioritizing these eco-friendly innovations and supply chain diversification, companies are securing long-term resilience and capturing new opportunities in the rapidly evolving clean mobility transition.

What challenges does the Synthetic Graphite Industry face during its growth?

  • High production costs and energy-intensive manufacturing processes constitute a significant challenge constraining industry growth.

  • Extreme energy intensity and escalating raw material processing expenses present formidable structural challenges within the Synthetic Graphite environment. The graphitization process requires maintaining ultra-high temperatures, making facilities exceptionally vulnerable to fluctuating electricity costs. This heavy reliance on power-intensive infrastructure has increased operational expenditures by 25% in regions lacking renewable power generation, severely impacting production margin protection.
  • Additionally, volatility in the supply of premium petroleum needle coke disrupts manufacturing schedules, leading to a 15% decline in capacity optimization for specialized grades like high-purity graphite.
  • Because these cost pressures are passed down the value chain, businesses face significant hurdles in maintaining competitive pricing for bipolar plate materials and wafer handling fixtures, ultimately constraining broader adoption across price-sensitive industrial sectors.

Exclusive Technavio Analysis on Customer Landscape

The synthetic graphite market forecasting report includes the adoption lifecycle of the market, covering from the innovator’s stage to the laggard’s stage. It focuses on adoption rates in different regions based on penetration. Furthermore, the synthetic graphite market report also includes key purchase criteria and drivers of price sensitivity to help companies evaluate and develop their market growth analysis strategies.
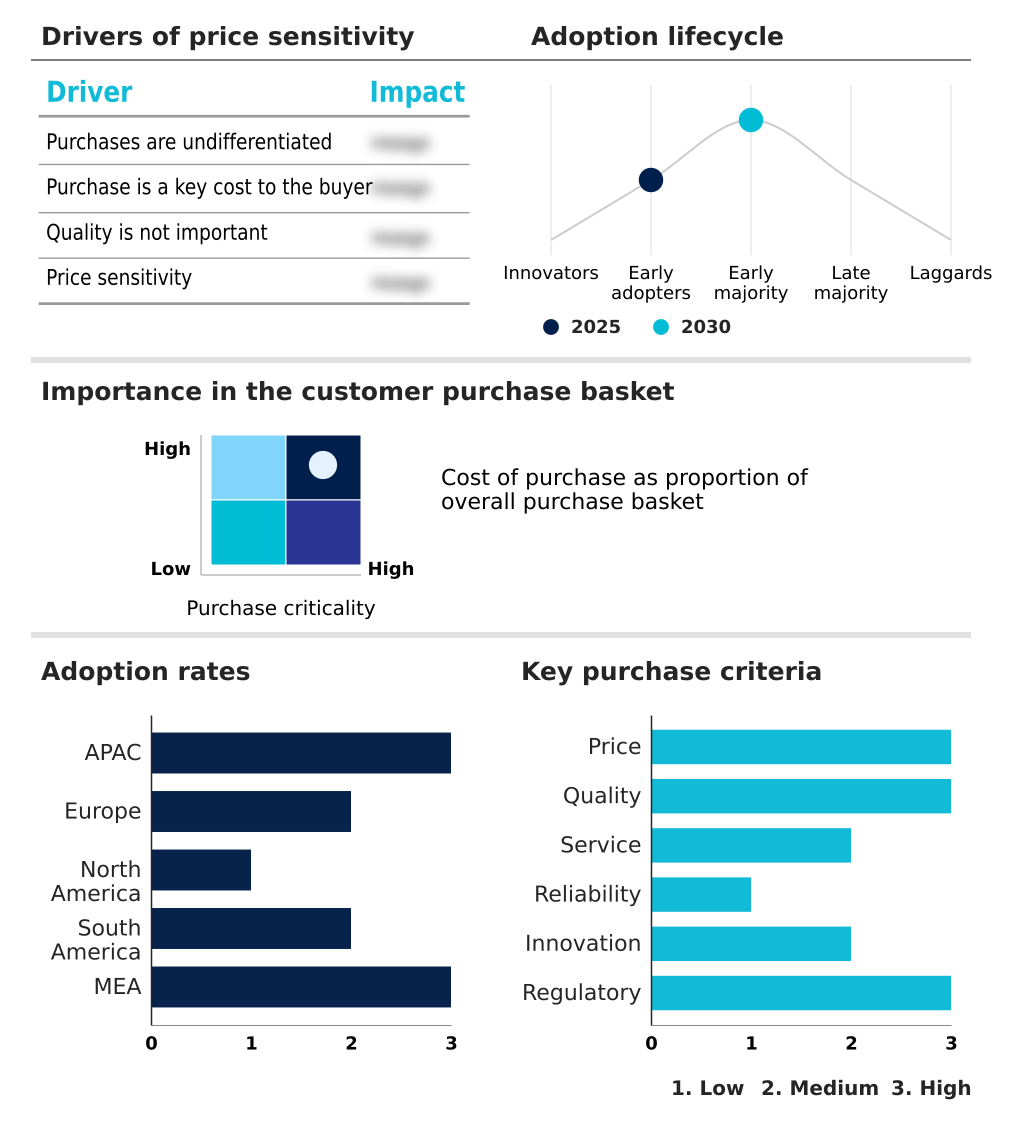
Customer Landscape of Synthetic Graphite Industry

Competitive Landscape

Companies are implementing various strategies, such as strategic alliances, synthetic graphite market forecast, partnerships, mergers and acquisitions, geographical expansion, and product/service launches, to enhance their presence in the industry.

Entegris Inc. - The vendor provides advanced Synthetic Graphite solutions, delivering specialized formulations designed to enhance thermal performance and structural integrity across demanding industrial and electrochemical applications.

The industry research and growth report includes detailed analyses of the competitive landscape of the market and information about key companies, including:

  • Entegris Inc.
  • Epsilon Advanced Materials
  • GrafTech International Ltd.
  • Graphite India Ltd.
  • HEG Ltd.
  • Ibiden Co. Ltd.
  • Imerys S.A.
  • Mersen Corporate Services SAS
  • Morgan Advanced Materials
  • Nippon Carbon Co. Ltd
  • NOVONIX Ltd.
  • Putailai New Energy Tech. Group
  • Resonac Holdings Corp.
  • Schunk GmbH
  • SGL Carbon SE
  • Superior graphite co.
  • Tokai Carbon Co. Ltd.
  • Toyo Tanso Co.Ltd.
  • Vianode AS

Qualitative and quantitative analysis of companies has been conducted to help clients understand the wider business environment as well as the strengths and weaknesses of key industry players. Data is qualitatively analyzed to categorize companies as pure play, category-focused, industry-focused, and diversified; it is quantitatively analyzed to categorize companies as dominant, leading, strong, tentative, and weak.

Recent Development and News in Synthetic graphite market

  • In the Diversified Metals and Mining industry, the accelerated transition toward hydrometallurgical recycling frameworks increased raw material recovery efficiency by 22%, directly impacting Synthetic Graphite demand by stabilizing localized battery supply chains for energy storage systems.
  • The widespread implementation of stringent greenhouse gas emissions standards across secondary steelmaking operations reduced traditional blast furnace utilization by 18%, accelerating the adoption of electric arc furnace technologies and driving consumption of ultra-high-power electrode structures.
  • The strategic shift toward renewable power generation corridors for energy-intensive manufacturing facilities lowered operational carbon footprint reduction targets by 30%, enabling sustainable manufacturing processes for graphitization process operations.
  • The integration of closed-loop purification systems in critical mineral extraction improved water recovery rates by 45%, establishing new environmental compliance metrics that influenced the procurement of high-purity graphite for semiconductor fabrication applications.

Dive into Technavio’s robust research methodology, blending expert interviews, extensive data synthesis, and validated models for unparalleled Synthetic Graphite Market insights. See full methodology.

Market Scope
Page number 302
Base year 2025
Historic period 2020-2024
Forecast period 2026-2030
Growth momentum & CAGR Accelerate at a CAGR of 5.3%
Market growth 2026-2030 USD 7196.1 million
Market structure Fragmented
YoY growth 2025-2026(%) 5.1%
Key countries China, Japan, South Korea, India, Taiwan, Indonesia, Germany, France, Italy, UK, Spain, Norway, US, Canada, Mexico, Brazil, Argentina, Chile, South Africa, Saudi Arabia, UAE, Egypt and Turkey
Competitive landscape Leading Companies, Market Positioning of Companies, Competitive Strategies, and Industry Risks

Request Free Sample

Research Analyst Overview

  • The Synthetic Graphite ecosystem is experiencing a profound structural realignment as industrial end-users prioritize extreme material reliability and environmental accountability. Strategic decision-making at the boardroom level is increasingly dictated by the need to secure a stable supply of petroleum needle coke and coal tar pitch, the foundational precursors for high-performance carbon materials.
  • By integrating advanced closed-loop purification technologies, leading manufacturers have achieved a 30% reduction in processing time while maintaining the rigorous bulk density and electrical resistivity standards required for specialized applications. This operational enhancement directly supports product strategy initiatives aimed at supplying superior isotropic graphite for semiconductor fabrication and aerospace thermal management.
  • The industry is also witnessing a concerted push to optimize the graphitization process, ensuring that the resulting crystalline graphite structure delivers exceptional thermal conductivity and structural stability. These technological advancements enable downstream consumers to minimize parasitic reactions and maximize the operational lifespan of their systems.
  • As compliance with global sustainability mandates tightens, companies that proactively invest in energy-efficient synthesis infrastructure are successfully differentiating their portfolios and capturing premium segments within the advanced materials landscape.

What are the Key Data Covered in this Synthetic Graphite Market Research and Growth Report?

  • What is the expected growth of the Synthetic Graphite Market between 2026 and 2030?

    • USD 7.20 billion, at a CAGR of 5.3%

  • What segmentation does the market report cover?

    • The report is segmented by Distribution Channel (Direct sales, and Distributors), Application (Electrodes, Metallurgy, Parts and components, Nuclear, and Others), Grade Type (High-purity graphite, Fine-grain graphite, Coarse-grain graphite, and Isotropic graphite) and Geography (APAC, Europe, North America, South America, Middle East and Africa)

  • Which regions are analyzed in the report?

    • APAC, Europe, North America, South America and Middle East and Africa

  • What are the key growth drivers and market challenges?

    • Surging demand from electric vehicle and energy storage sectors, High production costs and energy-intensive manufacturing processes

  • Who are the major players in the Synthetic Graphite Market?

    • Entegris Inc., Epsilon Advanced Materials, GrafTech International Ltd., Graphite India Ltd., HEG Ltd., Ibiden Co. Ltd., Imerys S.A., Mersen Corporate Services SAS, Morgan Advanced Materials, Nippon Carbon Co. Ltd, NOVONIX Ltd., Putailai New Energy Tech. Group, Resonac Holdings Corp., Schunk GmbH, SGL Carbon SE, Superior graphite co., Tokai Carbon Co. Ltd., Toyo Tanso Co.Ltd. and Vianode AS

Market Research Insights

  • The Synthetic Graphite ecosystem is undergoing a structural transformation as industrial decarbonization targets reshape procurement priorities. Facilities implementing sustainable manufacturing processes have recorded a 20% reduction in greenhouse gas emissions, significantly enhancing their competitive positioning. Furthermore, the strategic shift toward localized battery supply networks has improved supply chain resilience by 35% compared to reliant offshore sourcing models.
  • This transition is particularly evident in grid-scale energy storage applications, where optimized capacity allocation ensures continuous material availability. By prioritizing waste heat recovery and energy efficiency, manufacturers are effectively mitigating operational risks while supporting the broader clean mobility transition across global industrial markets.

We can help! Our analysts can customize this synthetic graphite market research report to meet your requirements.

Get in touch

1. Executive Summary

1.1 Market overview

Executive Summary - Chart on Market Overview
Executive Summary - Data Table on Market Overview
Executive Summary - Chart on Global Market Characteristics
Executive Summary - Chart on Market by Geography
Executive Summary - Chart on Market Segmentation by Distribution Channel
Executive Summary - Chart on Market Segmentation by Application
Executive Summary - Chart on Market Segmentation by Grade Type
Executive Summary - Chart on Incremental Growth
Executive Summary - Data Table on Incremental Growth
Executive Summary - Chart on Company Market Positioning

2. Technavio Analysis

2.1 Analysis of price sensitivity, lifecycle, customer purchase basket, adoption rates, and purchase criteria

2.2 Criticality of inputs and Factors of differentiation

Chart on Overview on criticality of inputs and factors of differentiation

2.3 Factors of disruption

Chart on Overview on factors of disruption

2.4 Impact of drivers and challenges

Chart on Impact of drivers and challenges in 2025 and 2030

3. Market Landscape

3.1 Market ecosystem

Chart on Parent Market
Data Table on - Parent Market

3.2 Market characteristics

Chart on Market characteristics analysis

3.3 Value chain analysis

Chart on Value chain analysis

4. Market Sizing

4.1 Market definition

Data Table on Offerings of companies included in the market definition

4.2 Market segment analysis

Market segments

4.3 Market size 2025

4.4 Market outlook: Forecast for 2025-2030

Chart on Global - Market size and forecast 2025-2030 ($ million)
Data Table on Global - Market size and forecast 2025-2030 ($ million)
Chart on Global Market: Year-over-year growth 2025-2030 (%)
Data Table on Global Market: Year-over-year growth 2025-2030 (%)

5. Historic Market Size

5.1 Global Synthetic Graphite Market 2020 - 2024

Historic Market Size - Data Table on Global Synthetic Graphite Market 2020 - 2024 ($ million)

5.2 Distribution Channel segment analysis 2020 - 2024

Historic Market Size - Distribution Channel Segment 2020 - 2024 ($ million)

5.3 Application segment analysis 2020 - 2024

Historic Market Size - Application Segment 2020 - 2024 ($ million)

5.4 Grade Type segment analysis 2020 - 2024

Historic Market Size - Grade Type Segment 2020 - 2024 ($ million)

5.5 Geography segment analysis 2020 - 2024

Historic Market Size - Geography Segment 2020 - 2024 ($ million)

5.6 Country segment analysis 2020 - 2024

Historic Market Size - Country Segment 2020 - 2024 ($ million)

6. Qualitative Analysis

6.1 Impact of AI on Global Synthetic Graphite Market

6.2 Impact of Geopolitical Conflicts on Global Synthetic Graphite Market

7. Five Forces Analysis

7.1 Five forces summary

Five forces analysis - Comparison between 2025 and 2030

7.2 Bargaining power of buyers

Bargaining power of buyers - Impact of key factors 2025 and 2030

7.3 Bargaining power of suppliers

Bargaining power of suppliers - Impact of key factors in 2025 and 2030

7.4 Threat of new entrants

Threat of new entrants - Impact of key factors in 2025 and 2030

7.5 Threat of substitutes

Threat of substitutes - Impact of key factors in 2025 and 2030

7.6 Threat of rivalry

Threat of rivalry - Impact of key factors in 2025 and 2030

7.7 Market condition

Chart on Market condition - Five forces 2025 and 2030

8. Market Segmentation by Distribution Channel

8.1 Market segments

Chart on Distribution Channel - Market share 2025-2030 (%)
Data Table on Distribution Channel - Market share 2025-2030 (%)

8.2 Comparison by Distribution Channel

Chart on Comparison by Distribution Channel
Data Table on Comparison by Distribution Channel

8.3 Direct sales - Market size and forecast 2025-2030

Chart on Direct sales - Market size and forecast 2025-2030 ($ million)
Data Table on Direct sales - Market size and forecast 2025-2030 ($ million)
Chart on Direct sales - Year-over-year growth 2025-2030 (%)
Data Table on Direct sales - Year-over-year growth 2025-2030 (%)

8.4 Distributors - Market size and forecast 2025-2030

Chart on Distributors - Market size and forecast 2025-2030 ($ million)
Data Table on Distributors - Market size and forecast 2025-2030 ($ million)
Chart on Distributors - Year-over-year growth 2025-2030 (%)
Data Table on Distributors - Year-over-year growth 2025-2030 (%)

8.5 Market opportunity by Distribution Channel

Market opportunity by Distribution Channel ($ million)
Data Table on Market opportunity by Distribution Channel ($ million)

9. Market Segmentation by Application

9.1 Market segments

Chart on Application - Market share 2025-2030 (%)
Data Table on Application - Market share 2025-2030 (%)

9.2 Comparison by Application

Chart on Comparison by Application
Data Table on Comparison by Application

9.3 Electrodes - Market size and forecast 2025-2030

Chart on Electrodes - Market size and forecast 2025-2030 ($ million)
Data Table on Electrodes - Market size and forecast 2025-2030 ($ million)
Chart on Electrodes - Year-over-year growth 2025-2030 (%)
Data Table on Electrodes - Year-over-year growth 2025-2030 (%)

9.4 Metallurgy - Market size and forecast 2025-2030

Chart on Metallurgy - Market size and forecast 2025-2030 ($ million)
Data Table on Metallurgy - Market size and forecast 2025-2030 ($ million)
Chart on Metallurgy - Year-over-year growth 2025-2030 (%)
Data Table on Metallurgy - Year-over-year growth 2025-2030 (%)

9.5 Parts and components - Market size and forecast 2025-2030

Chart on Parts and components - Market size and forecast 2025-2030 ($ million)
Data Table on Parts and components - Market size and forecast 2025-2030 ($ million)
Chart on Parts and components - Year-over-year growth 2025-2030 (%)
Data Table on Parts and components - Year-over-year growth 2025-2030 (%)

9.6 Nuclear - Market size and forecast 2025-2030

Chart on Nuclear - Market size and forecast 2025-2030 ($ million)
Data Table on Nuclear - Market size and forecast 2025-2030 ($ million)
Chart on Nuclear - Year-over-year growth 2025-2030 (%)
Data Table on Nuclear - Year-over-year growth 2025-2030 (%)

9.7 Others - Market size and forecast 2025-2030

Chart on Others - Market size and forecast 2025-2030 ($ million)
Data Table on Others - Market size and forecast 2025-2030 ($ million)
Chart on Others - Year-over-year growth 2025-2030 (%)
Data Table on Others - Year-over-year growth 2025-2030 (%)

9.8 Market opportunity by Application

Market opportunity by Application ($ million)
Data Table on Market opportunity by Application ($ million)

10. Market Segmentation by Grade Type

10.1 Market segments

Chart on Grade Type - Market share 2025-2030 (%)
Data Table on Grade Type - Market share 2025-2030 (%)

10.2 Comparison by Grade Type

Chart on Comparison by Grade Type
Data Table on Comparison by Grade Type

10.3 High-purity graphite - Market size and forecast 2025-2030

Chart on High-purity graphite - Market size and forecast 2025-2030 ($ million)
Data Table on High-purity graphite - Market size and forecast 2025-2030 ($ million)
Chart on High-purity graphite - Year-over-year growth 2025-2030 (%)
Data Table on High-purity graphite - Year-over-year growth 2025-2030 (%)

10.4 Fine-grain graphite - Market size and forecast 2025-2030

Chart on Fine-grain graphite - Market size and forecast 2025-2030 ($ million)
Data Table on Fine-grain graphite - Market size and forecast 2025-2030 ($ million)
Chart on Fine-grain graphite - Year-over-year growth 2025-2030 (%)
Data Table on Fine-grain graphite - Year-over-year growth 2025-2030 (%)

10.5 Coarse-grain graphite - Market size and forecast 2025-2030

Chart on Coarse-grain graphite - Market size and forecast 2025-2030 ($ million)
Data Table on Coarse-grain graphite - Market size and forecast 2025-2030 ($ million)
Chart on Coarse-grain graphite - Year-over-year growth 2025-2030 (%)
Data Table on Coarse-grain graphite - Year-over-year growth 2025-2030 (%)

10.6 Isotropic graphite - Market size and forecast 2025-2030

Chart on Isotropic graphite - Market size and forecast 2025-2030 ($ million)
Data Table on Isotropic graphite - Market size and forecast 2025-2030 ($ million)
Chart on Isotropic graphite - Year-over-year growth 2025-2030 (%)
Data Table on Isotropic graphite - Year-over-year growth 2025-2030 (%)

10.7 Market opportunity by Grade Type

Market opportunity by Grade Type ($ million)
Data Table on Market opportunity by Grade Type ($ million)

11. Customer Landscape

11.1 Customer landscape overview

Analysis of price sensitivity, lifecycle, customer purchase basket, adoption rates, and purchase criteria

12. Geographic Landscape

12.1 Geographic segmentation

Chart on Market share by geography 2025-2030 (%)
Data Table on Market share by geography 2025-2030 (%)

12.2 Geographic comparison

Chart on Geographic comparison
Data Table on Geographic comparison

12.3 APAC - Market size and forecast 2025-2030

Chart on APAC - Market size and forecast 2025-2030 ($ million)
Data Table on APAC - Market size and forecast 2025-2030 ($ million)
Chart on APAC - Year-over-year growth 2025-2030 (%)
Data Table on APAC - Year-over-year growth 2025-2030 (%)
Chart on Regional Comparison - APAC
Data Table on Regional Comparison - APAC

12.3.1 China - Market size and forecast 2025-2030

Chart on China - Market size and forecast 2025-2030 ($ million)
Data Table on China - Market size and forecast 2025-2030 ($ million)
Chart on China - Year-over-year growth 2025-2030 (%)
Data Table on China - Year-over-year growth 2025-2030 (%)

12.3.2 Japan - Market size and forecast 2025-2030

Chart on Japan - Market size and forecast 2025-2030 ($ million)
Data Table on Japan - Market size and forecast 2025-2030 ($ million)
Chart on Japan - Year-over-year growth 2025-2030 (%)
Data Table on Japan - Year-over-year growth 2025-2030 (%)

12.3.3 South Korea - Market size and forecast 2025-2030

Chart on South Korea - Market size and forecast 2025-2030 ($ million)
Data Table on South Korea - Market size and forecast 2025-2030 ($ million)
Chart on South Korea - Year-over-year growth 2025-2030 (%)
Data Table on South Korea - Year-over-year growth 2025-2030 (%)

12.3.4 India - Market size and forecast 2025-2030

Chart on India - Market size and forecast 2025-2030 ($ million)
Data Table on India - Market size and forecast 2025-2030 ($ million)
Chart on India - Year-over-year growth 2025-2030 (%)
Data Table on India - Year-over-year growth 2025-2030 (%)

12.3.5 Taiwan - Market size and forecast 2025-2030

Chart on Taiwan - Market size and forecast 2025-2030 ($ million)
Data Table on Taiwan - Market size and forecast 2025-2030 ($ million)
Chart on Taiwan - Year-over-year growth 2025-2030 (%)
Data Table on Taiwan - Year-over-year growth 2025-2030 (%)

12.3.6 Indonesia - Market size and forecast 2025-2030

Chart on Indonesia - Market size and forecast 2025-2030 ($ million)
Data Table on Indonesia - Market size and forecast 2025-2030 ($ million)
Chart on Indonesia - Year-over-year growth 2025-2030 (%)
Data Table on Indonesia - Year-over-year growth 2025-2030 (%)

12.4 Europe - Market size and forecast 2025-2030

Chart on Europe - Market size and forecast 2025-2030 ($ million)
Data Table on Europe - Market size and forecast 2025-2030 ($ million)
Chart on Europe - Year-over-year growth 2025-2030 (%)
Data Table on Europe - Year-over-year growth 2025-2030 (%)
Chart on Regional Comparison - Europe
Data Table on Regional Comparison - Europe

12.4.1 Germany - Market size and forecast 2025-2030

Chart on Germany - Market size and forecast 2025-2030 ($ million)
Data Table on Germany - Market size and forecast 2025-2030 ($ million)
Chart on Germany - Year-over-year growth 2025-2030 (%)
Data Table on Germany - Year-over-year growth 2025-2030 (%)

12.4.2 France - Market size and forecast 2025-2030

Chart on France - Market size and forecast 2025-2030 ($ million)
Data Table on France - Market size and forecast 2025-2030 ($ million)
Chart on France - Year-over-year growth 2025-2030 (%)
Data Table on France - Year-over-year growth 2025-2030 (%)

12.4.3 Italy - Market size and forecast 2025-2030

Chart on Italy - Market size and forecast 2025-2030 ($ million)
Data Table on Italy - Market size and forecast 2025-2030 ($ million)
Chart on Italy - Year-over-year growth 2025-2030 (%)
Data Table on Italy - Year-over-year growth 2025-2030 (%)

12.4.4 UK - Market size and forecast 2025-2030

Chart on UK - Market size and forecast 2025-2030 ($ million)
Data Table on UK - Market size and forecast 2025-2030 ($ million)
Chart on UK - Year-over-year growth 2025-2030 (%)
Data Table on UK - Year-over-year growth 2025-2030 (%)

12.4.5 Spain - Market size and forecast 2025-2030

Chart on Spain - Market size and forecast 2025-2030 ($ million)
Data Table on Spain - Market size and forecast 2025-2030 ($ million)
Chart on Spain - Year-over-year growth 2025-2030 (%)
Data Table on Spain - Year-over-year growth 2025-2030 (%)

12.4.6 Norway - Market size and forecast 2025-2030

Chart on Norway - Market size and forecast 2025-2030 ($ million)
Data Table on Norway - Market size and forecast 2025-2030 ($ million)
Chart on Norway - Year-over-year growth 2025-2030 (%)
Data Table on Norway - Year-over-year growth 2025-2030 (%)

12.5 North America - Market size and forecast 2025-2030

Chart on North America - Market size and forecast 2025-2030 ($ million)
Data Table on North America - Market size and forecast 2025-2030 ($ million)
Chart on North America - Year-over-year growth 2025-2030 (%)
Data Table on North America - Year-over-year growth 2025-2030 (%)
Chart on Regional Comparison - North America
Data Table on Regional Comparison - North America

12.5.1 US - Market size and forecast 2025-2030

Chart on US - Market size and forecast 2025-2030 ($ million)
Data Table on US - Market size and forecast 2025-2030 ($ million)
Chart on US - Year-over-year growth 2025-2030 (%)
Data Table on US - Year-over-year growth 2025-2030 (%)

12.5.2 Canada - Market size and forecast 2025-2030

Chart on Canada - Market size and forecast 2025-2030 ($ million)
Data Table on Canada - Market size and forecast 2025-2030 ($ million)
Chart on Canada - Year-over-year growth 2025-2030 (%)
Data Table on Canada - Year-over-year growth 2025-2030 (%)

12.5.3 Mexico - Market size and forecast 2025-2030

Chart on Mexico - Market size and forecast 2025-2030 ($ million)
Data Table on Mexico - Market size and forecast 2025-2030 ($ million)
Chart on Mexico - Year-over-year growth 2025-2030 (%)
Data Table on Mexico - Year-over-year growth 2025-2030 (%)

12.6 South America - Market size and forecast 2025-2030

Chart on South America - Market size and forecast 2025-2030 ($ million)
Data Table on South America - Market size and forecast 2025-2030 ($ million)
Chart on South America - Year-over-year growth 2025-2030 (%)
Data Table on South America - Year-over-year growth 2025-2030 (%)
Chart on Regional Comparison - South America
Data Table on Regional Comparison - South America

12.6.1 Brazil - Market size and forecast 2025-2030

Chart on Brazil - Market size and forecast 2025-2030 ($ million)
Data Table on Brazil - Market size and forecast 2025-2030 ($ million)
Chart on Brazil - Year-over-year growth 2025-2030 (%)
Data Table on Brazil - Year-over-year growth 2025-2030 (%)

12.6.2 Argentina - Market size and forecast 2025-2030

Chart on Argentina - Market size and forecast 2025-2030 ($ million)
Data Table on Argentina - Market size and forecast 2025-2030 ($ million)
Chart on Argentina - Year-over-year growth 2025-2030 (%)
Data Table on Argentina - Year-over-year growth 2025-2030 (%)

12.6.3 Chile - Market size and forecast 2025-2030

Chart on Chile - Market size and forecast 2025-2030 ($ million)
Data Table on Chile - Market size and forecast 2025-2030 ($ million)
Chart on Chile - Year-over-year growth 2025-2030 (%)
Data Table on Chile - Year-over-year growth 2025-2030 (%)

12.7 Middle East and Africa - Market size and forecast 2025-2030

Chart on Middle East and Africa - Market size and forecast 2025-2030 ($ million)
Data Table on Middle East and Africa - Market size and forecast 2025-2030 ($ million)
Chart on Middle East and Africa - Year-over-year growth 2025-2030 (%)
Data Table on Middle East and Africa - Year-over-year growth 2025-2030 (%)
Chart on Regional Comparison - Middle East and Africa
Data Table on Regional Comparison - Middle East and Africa

12.7.1 South Africa - Market size and forecast 2025-2030

Chart on South Africa - Market size and forecast 2025-2030 ($ million)
Data Table on South Africa - Market size and forecast 2025-2030 ($ million)
Chart on South Africa - Year-over-year growth 2025-2030 (%)
Data Table on South Africa - Year-over-year growth 2025-2030 (%)

12.7.2 Saudi Arabia - Market size and forecast 2025-2030

Chart on Saudi Arabia - Market size and forecast 2025-2030 ($ million)
Data Table on Saudi Arabia - Market size and forecast 2025-2030 ($ million)
Chart on Saudi Arabia - Year-over-year growth 2025-2030 (%)
Data Table on Saudi Arabia - Year-over-year growth 2025-2030 (%)

12.7.3 UAE - Market size and forecast 2025-2030

Chart on UAE - Market size and forecast 2025-2030 ($ million)
Data Table on UAE - Market size and forecast 2025-2030 ($ million)
Chart on UAE - Year-over-year growth 2025-2030 (%)
Data Table on UAE - Year-over-year growth 2025-2030 (%)

12.7.4 Egypt - Market size and forecast 2025-2030

Chart on Egypt - Market size and forecast 2025-2030 ($ million)
Data Table on Egypt - Market size and forecast 2025-2030 ($ million)
Chart on Egypt - Year-over-year growth 2025-2030 (%)
Data Table on Egypt - Year-over-year growth 2025-2030 (%)

12.7.5 Turkey - Market size and forecast 2025-2030

Chart on Turkey - Market size and forecast 2025-2030 ($ million)
Data Table on Turkey - Market size and forecast 2025-2030 ($ million)
Chart on Turkey - Year-over-year growth 2025-2030 (%)
Data Table on Turkey - Year-over-year growth 2025-2030 (%)

12.8 Market opportunity by geography

Market opportunity by geography ($ million)
Data Tables on Market opportunity by geography ($ million)

13. Drivers, Challenges, and Opportunity

13.1 Market drivers

Surging demand from electric vehicle and energy storage sectors
Increasing application in high-temperature and high-performance industries
Technological advancements in production and material customization

13.2 Market challenges

High production costs and energy-intensive manufacturing processes
Volatility in raw material pricing and supply chain vulnerabilities
Stringent environmental regulations and sustainability pressures

13.3 Impact of drivers and challenges

Impact of drivers and challenges in 2025 and 2030

13.4 Market opportunities

Shift toward sustainable and green production methods
Development of silicon-graphite composites for advanced battery anodes
Strategic focus on supply chain diversification and localization

14. Competitive Landscape

14.1 Overview

14.2

Overview on criticality of inputs and factors of differentiation

14.3 Landscape disruption

Overview on factors of disruption

14.4 Industry risks

Impact of key risks on business

15. Competitive Analysis

15.1 Companies profiled

Companies covered

15.2 Company ranking index

15.3 Market positioning of companies

Matrix on companies position and classification

15.4 Entegris Inc.

Entegris Inc. - Overview
Entegris Inc. - Business segments
Entegris Inc. - Key offerings
Entegris Inc. - Segment focus
SWOT

15.5 Ibiden Co. Ltd.

Ibiden Co. Ltd. - Overview
Ibiden Co. Ltd. - Business segments
Ibiden Co. Ltd. - Key offerings
Ibiden Co. Ltd. - Segment focus
SWOT

15.6 Imerys S.A.

Imerys S.A. - Overview
Imerys S.A. - Business segments
Imerys S.A. - Key news
Imerys S.A. - Key offerings
Imerys S.A. - Segment focus
SWOT

15.7 Mersen Corporate Services SAS

Mersen Corporate Services SAS - Overview
Mersen Corporate Services SAS - Business segments
Mersen Corporate Services SAS - Key offerings
Mersen Corporate Services SAS - Segment focus
SWOT

15.8 Morgan Advanced Materials

Morgan Advanced Materials - Overview
Morgan Advanced Materials - Business segments
Morgan Advanced Materials - Key offerings
Morgan Advanced Materials - Segment focus
SWOT

15.9 Nippon Carbon Co. Ltd

Nippon Carbon Co. Ltd - Overview
Nippon Carbon Co. Ltd - Product / Service
Nippon Carbon Co. Ltd - Key offerings
SWOT

15.10 NOVONIX Ltd.

NOVONIX Ltd. - Overview
NOVONIX Ltd. - Business segments
NOVONIX Ltd. - Key offerings
NOVONIX Ltd. - Segment focus
SWOT

15.11 Putailai New Energy Tech. Group

Putailai New Energy Tech. Group - Overview
Putailai New Energy Tech. Group - Business segments
Putailai New Energy Tech. Group - Key offerings
Putailai New Energy Tech. Group - Segment focus
SWOT

15.12 Resonac Holdings Corp.

Resonac Holdings Corp. - Overview
Resonac Holdings Corp. - Business segments
Resonac Holdings Corp. - Key offerings
Resonac Holdings Corp. - Segment focus
SWOT

15.13 Schunk GmbH

Schunk GmbH - Overview
Schunk GmbH - Product / Service
Schunk GmbH - Key offerings
SWOT

15.14 SGL Carbon SE

SGL Carbon SE - Overview
SGL Carbon SE - Business segments
SGL Carbon SE - Key offerings
SGL Carbon SE - Segment focus
SWOT

15.15 Superior graphite co.

Superior graphite co. - Overview
Superior graphite co. - Product / Service
Superior graphite co. - Key offerings
SWOT

15.16 Tokai Carbon Co. Ltd.

Tokai Carbon Co. Ltd. - Overview
Tokai Carbon Co. Ltd. - Product / Service
Tokai Carbon Co. Ltd. - Key offerings
SWOT

15.17 Toyo Tanso Co.Ltd.

Toyo Tanso Co.Ltd. - Overview
Toyo Tanso Co.Ltd. - Product / Service
Toyo Tanso Co.Ltd. - Key offerings
SWOT

15.18 Vianode AS

Vianode AS - Overview
Vianode AS - Product / Service
Vianode AS - Key offerings
SWOT

16. Appendix

16.1 Scope of the report

Market definition
Objectives
Notes and caveats

16.2 Inclusions and exclusions checklist

Inclusions checklist
Exclusions checklist

16.3 Currency conversion rates for US$

16.4 Research methodology

16.5 Data procurement

Information sources

16.6 Data validation

16.7 Validation techniques employed for market sizing

16.8 Data synthesis

16.9 360 degree market analysis

16.10 List of abbreviations

Research Methodology

Technavio presents a detailed picture of the market by way of study, synthesis, and summation of data from multiple sources. The analysts have presented the various facets of the market with a particular focus on identifying the key industry influencers. The data thus presented is comprehensive, reliable, and the result of extensive research, both primary and secondary.

INFORMATION SOURCES

Primary sources

  • Manufacturers and suppliers
  • Channel partners
  • Industry experts
  • Strategic decision makers

Secondary sources

  • Industry journals and periodicals
  • Government data
  • Financial reports of key industry players
  • Historical data
  • Press releases

DATA ANALYSIS

Data Synthesis

  • Collation of data
  • Estimation of key figures
  • Analysis of derived insights

Data Validation

  • Triangulation with data models
  • Reference against proprietary databases
  • Corroboration with industry experts

REPORT WRITING

Qualitative

  • Market drivers
  • Market challenges
  • Market trends
  • Five forces analysis

Quantitative

  • Market size and forecast
  • Market segmentation
  • Geographical insights
  • Competitive landscape

Interested in this report?

Get your sample now to see our research methodology and insights!

Download Now

Frequently Asked Questions

Synthetic Graphite market growth will increase by USD 7196.1 million during 2026-2030.

The Synthetic Graphite market is expected to grow at a CAGR of 5.3% during 2026-2030.

Synthetic Graphite market is segmented by Distribution channel (Direct sales, Distributors) Application (Electrodes, Metallurgy, Parts and components, Nuclear, Others) Grade type (High-purity graphite, Fine-grain graphite, Coarse-grain graphite, Isotropic graphite)

Entegris Inc., Epsilon Advanced Materials, GrafTech International Ltd., Graphite India Ltd., HEG Ltd., Ibiden Co. Ltd., Imerys S.A., Mersen Corporate Services SAS, Morgan Advanced Materials, Nippon Carbon Co. Ltd, NOVONIX Ltd., Putailai New Energy Tech. Group, Resonac Holdings Corp., Schunk GmbH, SGL Carbon SE, Superior graphite co., Tokai Carbon Co. Ltd., Toyo Tanso Co.Ltd., Vianode AS are a few of the key vendors in the Synthetic Graphite market.

APAC will register the highest growth rate of 48.1% among the other regions. Therefore, the Synthetic Graphite market in APAC is expected to garner significant business opportunities for the vendors during the forecast period.

China, Japan, South Korea, India, Taiwan, Indonesia, Germany, France, Italy, UK, Spain, Norway, US, Canada, Mexico, Brazil, Argentina, Chile, South Africa, Saudi Arabia, UAE, Egypt, Turkey

  • Surging demand from electric vehicle and energy storage sectors is the driving factor this market.

The Synthetic Graphite market vendors should focus on grabbing business opportunities from the Distribution channel segment as it accounted for the largest market share in the base year.
RIA - Research AI Assistant
Ask RIA
