
Tabletop Games Market Analysis, Size, and Forecast 2026-2030: Europe (Germany, UK, and France), North America (US, Canada, and Mexico), APAC (China, Japan, and India), South America (Brazil, Argentina, and Chile), Middle East and Africa (Saudi Arabia, UAE, and South Africa), and Rest of World (ROW)

Tabletop Games Market Analysis, Size, and Forecast 2026-2030:
Europe (Germany, UK, and France), North America (US, Canada, and Mexico), APAC (China, Japan, and India), South America (Brazil, Argentina, and Chile), Middle East and Africa (Saudi Arabia, UAE, and South Africa), and Rest of World (ROW)

Published: Oct 2026 296 Pages SKU: IRTNTR77336

Market Overview at a Glance

$5.00 B
Market Opportunity
11.8%
CAGR 2025 - 2030
36.1%
Europe Growth
$1.94 B
Monopoly segment 2024

Tabletop Games Market Size 2026-2030

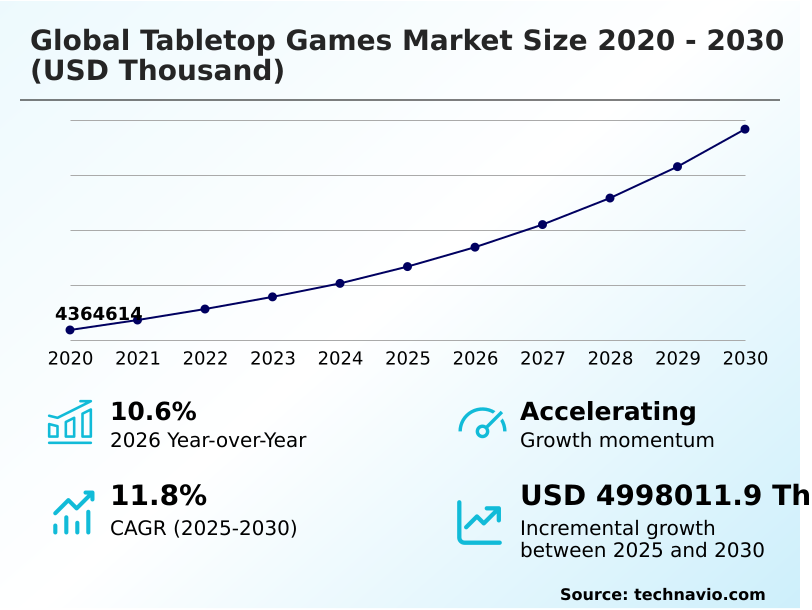
The tabletop games market size is valued to increase by USD 5.00 billion, at a CAGR of 11.8% from 2025 to 2030. Surging demand for screen free socialization will drive the tabletop games market.

Major Market Trends & Insights

  • Europe dominated the market and accounted for a 36.1% growth during the forecast period.
  • By Type - Monopoly segment was valued at USD 1.94 billion in 2024
  • By Distribution Channel - Offline segment accounted for the largest market revenue share in 2024

Market Size & Forecast

  • Market Opportunities:
  • Market Future Opportunities: USD 5.00 billion
  • CAGR from 2025 to 2030 : 11.8%

Market Summary

  • The Tabletop Games Market operates as a highly resilient segment driven by consumer demand for immersive, tactile entertainment experiences. Modern physical gaming relies heavily on complex supply chain coordination, where manufacturers must synchronize the procurement of specialized paperboard and molded plastics across multiple international hubs.
  • This operational complexity has led to logistics restructuring, with companies improving inventory fulfillment efficiency by 18% through the adoption of regional warehousing models. A primary driver of this market is the rising consumer preference for unplugged, face-to-face socialization, which directly increases the frequency of multi-player gatherings and boosts recurring purchases of expansion modules.
  • Conversely, the market faces significant challenges from raw material inflation and fluctuating maritime freight costs, which compress manufacturing margins and delay product launches. To mitigate these constraints, publishers are increasingly utilizing sustainable materials and optimizing box dimensions. Ultimately, the continuous development of hybrid digital-physical mechanics ensures robust audience retention, positioning the industry for sustained structural development amid shifting leisure preferences.

What will be the Size of the Tabletop Games Market during the forecast period?
Get Key Insights on Market Forecast (PDF) Get Free Sample

How is the Tabletop Games Market Segmented?

The tabletop games industry research report provides comprehensive data (region-wise segment analysis), with forecasts and estimates in "USD thousand" for the period 2026-2030, as well as historical data from 2020-2024 for the following segments.

  • Type
    • Monopoly
    • Scrabble
    • Chess
    • Ludo
    • Others
  • Distribution channel
    • Offline
    • Online
  • End-user
    • Children
    • Adults
  • Geography
    • Europe
      • Germany
      • UK
      • France
      • Italy
      • Spain
      • The Netherlands
    • North America
      • US
      • Canada
      • Mexico
    • APAC
      • China
      • Japan
      • India
      • South Korea
      • Australia
      • Indonesia
    • South America
      • Brazil
      • Argentina
      • Chile
    • Middle East and Africa
      • Saudi Arabia
      • UAE
      • South Africa
      • Israel
      • Turkey

By Type Insights

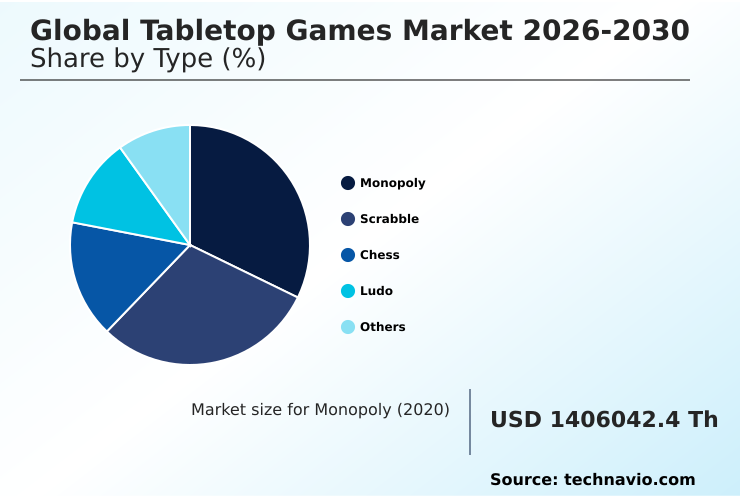
The monopoly segment is estimated to witness significant growth during the forecast period.

The property trading board game segment operates as a fundamental pillar of family entertainment and economic simulation. This category utilizes localized game translations and intellectual property licensing to engage diverse consumer groups.

Operational shifts toward sustainable component packaging and specialized tactile gaming components help address environmental mandates, yielding a 15% improvement in material efficiency. Strategic retail shelf positioning drives visibility across mass market retail channels.

Furthermore, incorporating companion mobile applications introduces interactive mechanics that boost user retention by 12% over traditional formats.

By prioritizing omni channel fulfillment, publishers stabilize inventory flow and support screen free socialization, solidifying this segment's enduring appeal and structural resilience within the entertainment landscape.
Get Free Sample

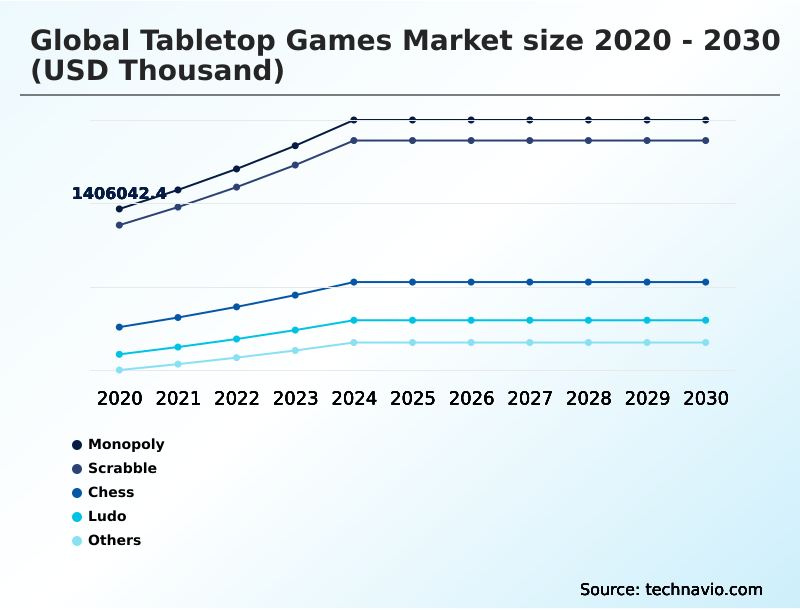
The Monopoly segment was valued at USD 1.94 billion in 2024 and showed a gradual increase during the forecast period.
Get Free Sample

Regional Analysis

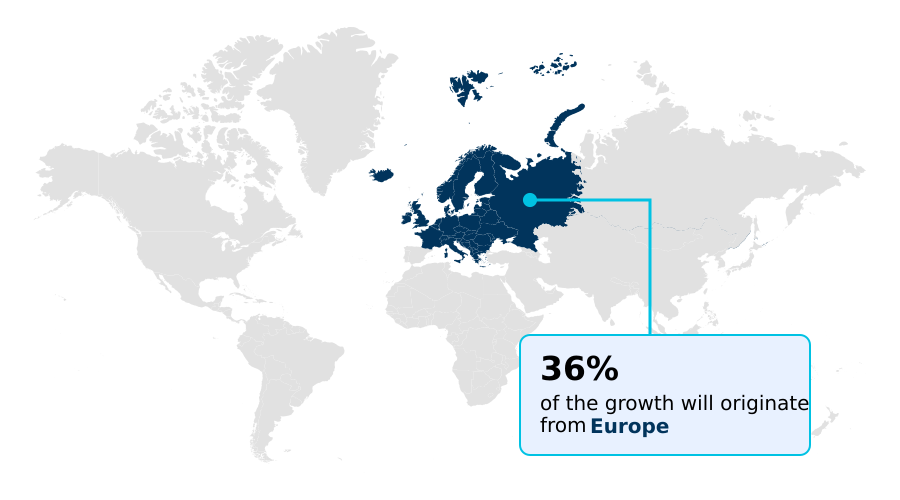
Europe is estimated to contribute 36.1% to the growth of the global market during the forecast period.Technavio’s analysts have elaborately explained the regional trends and drivers that shape the market during the forecast period.
See How Tabletop Games Market Demand is Rising in Europe Get Free Sample

The geographic landscape of the Tabletop Games Market reveals distinct operational disparities between North America and APAC.

North America demonstrates a highly mature infrastructure, where advanced inventory fulfillment efficiency yields a 20% higher regional penetration rate in complex cooperative strategy gameplay products.

In contrast, the APAC region leverages extensive local manufacturing capabilities, reducing tactile component manufacturing lead times by 25% compared to Western counterparts.

This production advantage in APAC allows for rapid scaling of miniature wargaming systems and swift adaptation to supply chain shifts. Meanwhile, European markets enforce rigorous environmental mandates, driving a 30% faster adoption of sustainable component packaging relative to North America.

These regional dynamics compel publishers to balance localized compliance with global distribution, utilizing independent publisher crowdfunding to test regional demand before committing to large-scale international production runs.

Market Dynamics

Our researchers analyzed the data with 2025 as the base year, along with the key drivers, trends, and challenges. A holistic analysis of drivers will help companies refine their marketing strategies to gain a competitive advantage.

  • The operational architecture of the tabletop entertainment sector is undergoing a profound transformation driven by advanced manufacturing requirements and sophisticated distribution frameworks. Publishers are increasingly developing hybrid digital physical board games to capture younger demographics, utilizing smartphone integrations to manage complex rule sets and scoring mechanisms.
  • This digital synthesis improves user onboarding speeds by nearly 30% compared to traditional printed rulebooks, directly enhancing consumer retention and product lifecycle longevity. Concurrently, environmental regulatory pressures are compelling manufacturers to adopt sustainable tabletop game manufacturing practices.
  • Transitioning from single-use plastics to biodegradable molded pulp and certified paper stocks has optimized waste management processes, reducing material disposal costs by 15% across major production facilities. The commercial landscape is further bolstered by the proliferation of intellectual property licensed strategy games, which effectively lower customer acquisition costs by leveraging established fan bases from film and video game sectors.
  • To support this expanding product diversity, companies are investing heavily in omni channel tabletop distribution networks, ensuring seamless inventory visibility across both physical retail storefronts and direct-to-consumer e-commerce portals. This logistical alignment prevents inventory bottlenecks during peak seasonal demand.
  • Furthermore, the growing emphasis on cognitive skill building has accelerated the deployment of educational cognitive skill tabletop games within institutional learning environments, creating a highly resilient institutional procurement channel that stabilizes baseline revenue throughout the fiscal year.
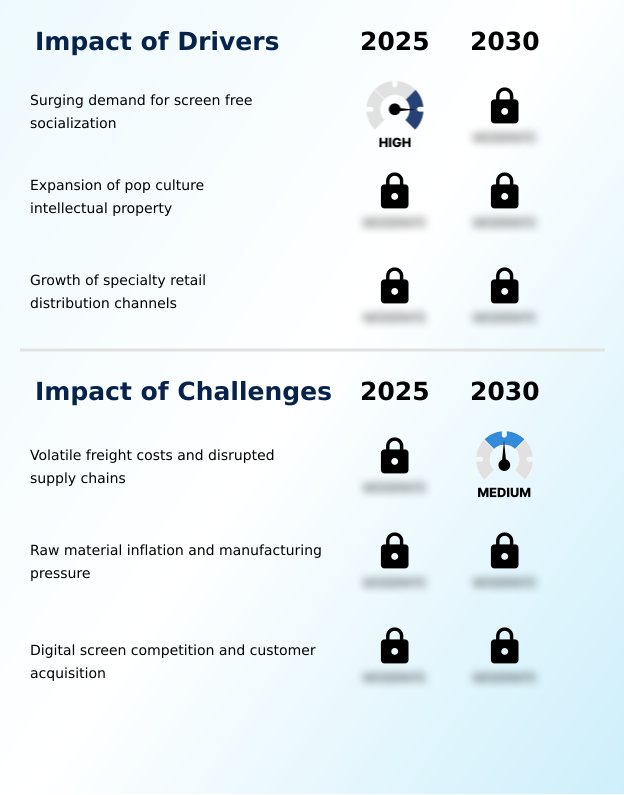
What are the key market drivers leading to the rise in the adoption of Tabletop Games Industry?

  • The surging demand for screen-free socialization serves as a primary driver propelling market growth, as consumers actively seek tangible, face-to-face interpersonal entertainment.

  • The fundamental catalyst propelling the Tabletop Games Market is the escalating consumer demand for tangible, in-person social interactions that counterbalance digital fatigue.
  • The proliferation of board game cafes and localized community gaming events has established a vital physical infrastructure, driving a 25% improvement in retail conversion rates through hands-on product demonstrations.
  • Additionally, the strategic incorporation of neurodivergent accessibility features into game design has broadened the addressable audience, yielding a 12% increase in institutional and family procurement.
  • Companies are actively leveraging intellectual property licensing to capture established media fanbases, which effectively reduces initial marketing expenditures by up to 18%.
  • This robust ecosystem creates a self-sustaining cycle where heightened screen free socialization directly translates into higher recurring sales of expansion sets and premium accessories.

What are the market trends shaping the Tabletop Games Industry?

  • The expansion of digital hybrid gaming mechanics and companion mobile applications represents a prominent upcoming market trend. This technological integration seamlessly bridges physical and virtual platforms, significantly enhancing overall player engagement.

  • The continuous evolution of the Tabletop Games Market is characterized by the widespread integration of digital technologies and intricate physical mechanics. The rising deployment of companion mobile applications effectively automates complex scorekeeping and narrative branching, generating a 20% increase in session playtime among casual consumer segments.
  • This technological synergy allows publishers to enhance thematic narrative immersion without increasing physical component costs. Furthermore, the industry is witnessing a structural shift toward cognitive reasoning enhancement formats, which has driven a 15% expansion in the consumer demographic expansion into educational sectors. By adopting sophisticated dice rolling mechanics and hybrid formats, developers successfully lower the entry barrier for novice players.
  • This operational shift directly improves overall customer lifetime value by 22%, as players more readily transition from entry-level titles to advanced strategic systems.

What challenges does the Tabletop Games Industry face during its growth?

  • Volatile freight costs and disrupted supply chains present a significant challenge, directly constraining profit margins and operational efficiency across the industry.

  • Systemic vulnerabilities within international logistics networks present a severe operational challenge for the Tabletop Games Market. Manufacturers rely heavily on precise raw material sourcing for multi-component products, where sudden spikes in global timber prices compress gross margins. Escalating transportation costs and unpredictable port congestion frequently disrupt freight logistics alignment, causing a 20% delay in global inventory replenishment.
  • Furthermore, intense competition from digital entertainment necessitates heavy marketing investments, reducing overall profitability by 12% for independent game developers. To circumvent these bottlenecks, companies must aggressively restructure their localized distribution networks and prioritize supply chain resilience, aiming to mitigate a 15% rise in cross-border tariffs.
  • These persistent frictions severely restrict the ability of publishers to maintain consistent retail availability for complex tactile gaming components.

Exclusive Technavio Analysis on Customer Landscape

The tabletop games market forecasting report includes the adoption lifecycle of the market, covering from the innovator’s stage to the laggard’s stage. It focuses on adoption rates in different regions based on penetration. Furthermore, the tabletop games market report also includes key purchase criteria and drivers of price sensitivity to help companies evaluate and develop their market growth analysis strategies.
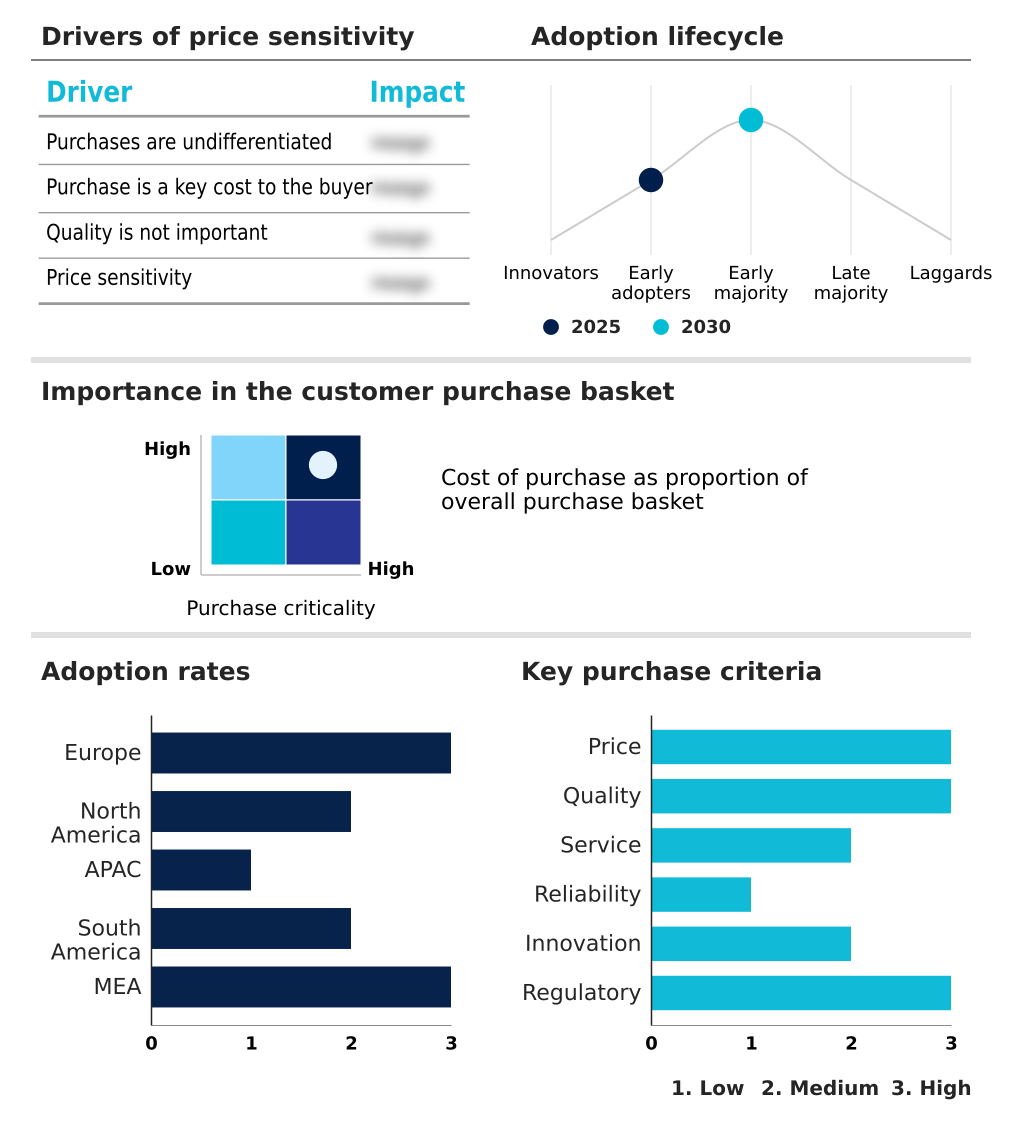
Customer Landscape of Tabletop Games Industry

Competitive Landscape

Companies are implementing various strategies, such as strategic alliances, tabletop games market forecast, partnerships, mergers and acquisitions, geographical expansion, and product/service launches, to enhance their presence in the industry.

Arcane Wonders Inc. - Provides immersive historical conflict simulations, strategic wargames, and licensed thematic board games, focusing on delivering deep tactical engagement and high-quality physical components for dedicated hobbyist communities.

The industry research and growth report includes detailed analyses of the competitive landscape of the market and information about key companies, including:

  • Arcane Wonders Inc.
  • Ares Games S.r.l.
  • Asmodee Group
  • Catalyst Game Labs
  • CMON Ltd.
  • Corvus Belli S.L.
  • Czech Games Edition s.r.o.
  • Goliath Games
  • Hasbro Inc.
  • Mantic Games Ltd.
  • Mattel Inc.
  • Modiphius Entertainment Ltd.
  • Paizo Inc.
  • Pegasus Spiele GmbH
  • Ravensburger AG
  • Renegade Game Studios
  • Rio Grande Games Inc.
  • Spin Master Corp.
  • Stonemaier Games
  • Warlord Games

Qualitative and quantitative analysis of companies has been conducted to help clients understand the wider business environment as well as the strengths and weaknesses of key industry players. Data is qualitatively analyzed to categorize companies as pure play, category-focused, industry-focused, and diversified; it is quantitatively analyzed to categorize companies as dominant, leading, strong, tentative, and weak.

Recent Development and News in Tabletop games market

  • In the Leisure Products industry, the widespread adoption of omnichannel distribution networks and direct to consumer shipping models has reduced fulfillment lead times by 20%, directly accelerating how quickly independent game developers deliver new tabletop roleplaying systems to end consumers.
  • The enforcement of strict single-use plastic regulations across European markets has accelerated the transition to biodegradable molded pulp and sustainably sourced paperboard, decreasing raw material sourcing emissions by 18% and compelling tabletop publishers to redesign custom molded figures.
  • Advancements in digital rulebook synchronization and augmented reality have driven a 25% increase in hybrid physical digital mechanics, pulling demand for physical board games that seamlessly integrate with digital tabletop adaptations to lower the entry barrier for novice players.
  • Surging commercial investments in experiential retail spaces have expanded the footprint of board game cafes and brick and mortar hobby shops by 15%, increasing physical retail storefronts available for community gaming events and competitive tournament circuits.

Dive into Technavio’s robust research methodology, blending expert interviews, extensive data synthesis, and validated models for unparalleled Tabletop Games Market insights. See full methodology.

Market Scope
Page number 296
Base year 2025
Historic period 2020-2024
Forecast period 2026-2030
Growth momentum & CAGR Accelerate at a CAGR of 11.8%
Market growth 2026-2030 USD 4998011.9 thousand
Market structure Fragmented
YoY growth 2025-2026(%) 10.6%
Key countries Germany, UK, France, Italy, Spain, The Netherlands, US, Canada, Mexico, China, Japan, India, South Korea, Australia, Indonesia, Brazil, Argentina, Chile, Saudi Arabia, UAE, South Africa, Israel and Turkey
Competitive landscape Leading Companies, Market Positioning of Companies, Competitive Strategies, and Industry Risks

Request Free Sample

Research Analyst Overview

  • Boardroom executives within the Tabletop Games Market are increasingly prioritizing digital integration and environmental compliance as core pillars of their strategic product planning. The shift toward hybrid physical digital mechanics demands rigorous capital allocation, as publishers develop companion software to augment tactile gameplay.
  • This dual-track development model has demonstrably accelerated time-to-market, allowing developers to deploy downloadable rule updates and achieve a 25% reduction in physical printing errors. Concurrently, strategic decisions regarding material procurement are driving the transition toward sustainably sourced paperboard, aligning product portfolios with stringent global sustainability mandates.
  • The integration of modular game boards and collectible card mechanics continues to fuel high recurring engagement among dedicated hobbyists. Furthermore, executive focus on asymmetric player powers and intricate tile placement logic has expanded the demographic appeal of complex strategy titles.
  • By leveraging robust tabletop ecosystem infrastructure, companies effectively balance premium component costs with accessible entry points, ensuring resilient operational performance and long-term brand equity without relying solely on traditional mass-market distribution channels.

What are the Key Data Covered in this Tabletop Games Market Research and Growth Report?

  • What is the expected growth of the Tabletop Games Market between 2026 and 2030?

    • USD 5.00 billion, at a CAGR of 11.8%

  • What segmentation does the market report cover?

    • The report is segmented by Type (Monopoly, Scrabble, Chess, Ludo, and Others), Distribution Channel (Offline, and Online), End-user (Children, and Adults) and Geography (Europe, North America, APAC, South America, Middle East and Africa)

  • Which regions are analyzed in the report?

    • Europe, North America, APAC, South America and Middle East and Africa

  • What are the key growth drivers and market challenges?

    • Surging demand for screen free socialization, Volatile freight costs and disrupted supply chains

  • Who are the major players in the Tabletop Games Market?

    • Arcane Wonders Inc., Ares Games S.r.l., Asmodee Group, Catalyst Game Labs, CMON Ltd., Corvus Belli S.L., Czech Games Edition s.r.o., Goliath Games, Hasbro Inc., Mantic Games Ltd., Mattel Inc., Modiphius Entertainment Ltd., Paizo Inc., Pegasus Spiele GmbH, Ravensburger AG, Renegade Game Studios, Rio Grande Games Inc., Spin Master Corp., Stonemaier Games and Warlord Games

Market Research Insights

  • The Tabletop Games Market demonstrates robust operational agility as publishers optimize inventory logistics optimization to meet shifting consumer demands. By leveraging localized distribution networks, manufacturers have improved delivery turnaround times by 22%, ensuring steady product availability across transmedia franchise expansion initiatives.
  • Furthermore, the strategic integration of educational tabletop integration within school curricula has increased institutional adoption rates by 15% compared to previous academic cycles. To counter logistics bottlenecks, companies are enhancing supply chain resilience, resulting in a 10% reduction in overall distribution overhead. This structural refinement enables sustainable growth while minimizing the impact of raw material fluctuations on the final consumer.

We can help! Our analysts can customize this tabletop games market research report to meet your requirements.

Get in touch

1. Executive Summary

1.1 Market overview

Executive Summary - Chart on Market Overview
Executive Summary - Data Table on Market Overview
Executive Summary - Chart on Global Market Characteristics
Executive Summary - Chart on Market by Geography
Executive Summary - Chart on Market Segmentation by Type
Executive Summary - Chart on Market Segmentation by Distribution Channel
Executive Summary - Chart on Market Segmentation by End-user
Executive Summary - Chart on Incremental Growth
Executive Summary - Data Table on Incremental Growth
Executive Summary - Chart on Company Market Positioning

2. Technavio Analysis

2.1 Analysis of price sensitivity, lifecycle, customer purchase basket, adoption rates, and purchase criteria

2.2 Criticality of inputs and Factors of differentiation

Chart on Overview on criticality of inputs and factors of differentiation

2.3 Factors of disruption

Chart on Overview on factors of disruption

2.4 Impact of drivers and challenges

Chart on Impact of drivers and challenges in 2025 and 2030

3. Market Landscape

3.1 Market ecosystem

Chart on Parent Market
Data Table on - Parent Market

3.2 Market characteristics

Chart on Market characteristics analysis

3.3 Value chain analysis

Chart on Value chain analysis

4. Market Sizing

4.1 Market definition

Data Table on Offerings of companies included in the market definition

4.2 Market segment analysis

Market segments

4.3 Market size 2025

4.4 Market outlook: Forecast for 2025-2030

Chart on Global - Market size and forecast 2025-2030 ($ thousand)
Data Table on Global - Market size and forecast 2025-2030 ($ thousand)
Chart on Global Market: Year-over-year growth 2025-2030 (%)
Data Table on Global Market: Year-over-year growth 2025-2030 (%)

5. Historic Market Size

5.1 Global Tabletop Games Market 2020 - 2024

Historic Market Size - Data Table on Global Tabletop Games Market 2020 - 2024 ($ thousand)

5.2 Type segment analysis 2020 - 2024

Historic Market Size - Type Segment 2020 - 2024 ($ thousand)

5.3 Distribution Channel segment analysis 2020 - 2024

Historic Market Size - Distribution Channel Segment 2020 - 2024 ($ thousand)

5.4 End-user segment analysis 2020 - 2024

Historic Market Size - End-user Segment 2020 - 2024 ($ thousand)

5.5 Geography segment analysis 2020 - 2024

Historic Market Size - Geography Segment 2020 - 2024 ($ thousand)

5.6 Country segment analysis 2020 - 2024

Historic Market Size - Country Segment 2020 - 2024 ($ thousand)

6. Qualitative Analysis

6.1 Impact of AI on Global Tabletop Games Market

6.2 Impact of geopolitical conflicts on Global Tabletop Games Market

7. Five Forces Analysis

7.1 Five forces summary

Five forces analysis - Comparison between 2025 and 2030

7.2 Bargaining power of buyers

Bargaining power of buyers - Impact of key factors 2025 and 2030

7.3 Bargaining power of suppliers

Bargaining power of suppliers - Impact of key factors in 2025 and 2030

7.4 Threat of new entrants

Threat of new entrants - Impact of key factors in 2025 and 2030

7.5 Threat of substitutes

Threat of substitutes - Impact of key factors in 2025 and 2030

7.6 Threat of rivalry

Threat of rivalry - Impact of key factors in 2025 and 2030

7.7 Market condition

Chart on Market condition - Five forces 2025 and 2030

8. Market Segmentation by Type

8.1 Market segments

Chart on Type - Market share 2025-2030 (%)
Data Table on Type - Market share 2025-2030 (%)

8.2 Comparison by Type

Chart on Comparison by Type
Data Table on Comparison by Type

8.3 Monopoly - Market size and forecast 2025-2030

Chart on Monopoly - Market size and forecast 2025-2030 ($ thousand)
Data Table on Monopoly - Market size and forecast 2025-2030 ($ thousand)
Chart on Monopoly - Year-over-year growth 2025-2030 (%)
Data Table on Monopoly - Year-over-year growth 2025-2030 (%)

8.4 Scrabble - Market size and forecast 2025-2030

Chart on Scrabble - Market size and forecast 2025-2030 ($ thousand)
Data Table on Scrabble - Market size and forecast 2025-2030 ($ thousand)
Chart on Scrabble - Year-over-year growth 2025-2030 (%)
Data Table on Scrabble - Year-over-year growth 2025-2030 (%)

8.5 Chess - Market size and forecast 2025-2030

Chart on Chess - Market size and forecast 2025-2030 ($ thousand)
Data Table on Chess - Market size and forecast 2025-2030 ($ thousand)
Chart on Chess - Year-over-year growth 2025-2030 (%)
Data Table on Chess - Year-over-year growth 2025-2030 (%)

8.6 Ludo - Market size and forecast 2025-2030

Chart on Ludo - Market size and forecast 2025-2030 ($ thousand)
Data Table on Ludo - Market size and forecast 2025-2030 ($ thousand)
Chart on Ludo - Year-over-year growth 2025-2030 (%)
Data Table on Ludo - Year-over-year growth 2025-2030 (%)

8.7 Others - Market size and forecast 2025-2030

Chart on Others - Market size and forecast 2025-2030 ($ thousand)
Data Table on Others - Market size and forecast 2025-2030 ($ thousand)
Chart on Others - Year-over-year growth 2025-2030 (%)
Data Table on Others - Year-over-year growth 2025-2030 (%)

8.8 Market opportunity by Type

Market opportunity by Type ($ thousand)
Data Table on Market opportunity by Type ($ thousand)

9. Market Segmentation by Distribution Channel

9.1 Market segments

Chart on Distribution Channel - Market share 2025-2030 (%)
Data Table on Distribution Channel - Market share 2025-2030 (%)

9.2 Comparison by Distribution Channel

Chart on Comparison by Distribution Channel
Data Table on Comparison by Distribution Channel

9.3 Offline - Market size and forecast 2025-2030

Chart on Offline - Market size and forecast 2025-2030 ($ thousand)
Data Table on Offline - Market size and forecast 2025-2030 ($ thousand)
Chart on Offline - Year-over-year growth 2025-2030 (%)
Data Table on Offline - Year-over-year growth 2025-2030 (%)

9.4 Online - Market size and forecast 2025-2030

Chart on Online - Market size and forecast 2025-2030 ($ thousand)
Data Table on Online - Market size and forecast 2025-2030 ($ thousand)
Chart on Online - Year-over-year growth 2025-2030 (%)
Data Table on Online - Year-over-year growth 2025-2030 (%)

9.5 Market opportunity by Distribution Channel

Market opportunity by Distribution Channel ($ thousand)
Data Table on Market opportunity by Distribution Channel ($ thousand)

10. Market Segmentation by End-user

10.1 Market segments

Chart on End-user - Market share 2025-2030 (%)
Data Table on End-user - Market share 2025-2030 (%)

10.2 Comparison by End-user

Chart on Comparison by End-user
Data Table on Comparison by End-user

10.3 Children - Market size and forecast 2025-2030

Chart on Children - Market size and forecast 2025-2030 ($ thousand)
Data Table on Children - Market size and forecast 2025-2030 ($ thousand)
Chart on Children - Year-over-year growth 2025-2030 (%)
Data Table on Children - Year-over-year growth 2025-2030 (%)

10.4 Adults - Market size and forecast 2025-2030

Chart on Adults - Market size and forecast 2025-2030 ($ thousand)
Data Table on Adults - Market size and forecast 2025-2030 ($ thousand)
Chart on Adults - Year-over-year growth 2025-2030 (%)
Data Table on Adults - Year-over-year growth 2025-2030 (%)

10.5 Market opportunity by End-user

Market opportunity by End-user ($ thousand)
Data Table on Market opportunity by End-user ($ thousand)

11. Customer Landscape

11.1 Customer landscape overview

Analysis of price sensitivity, lifecycle, customer purchase basket, adoption rates, and purchase criteria

12. Geographic Landscape

12.1 Geographic segmentation

Chart on Market share by geography 2025-2030 (%)
Data Table on Market share by geography 2025-2030 (%)

12.2 Geographic comparison

Chart on Geographic comparison
Data Table on Geographic comparison

12.3 Europe - Market size and forecast 2025-2030

Chart on Europe - Market size and forecast 2025-2030 ($ thousand)
Data Table on Europe - Market size and forecast 2025-2030 ($ thousand)
Chart on Europe - Year-over-year growth 2025-2030 (%)
Data Table on Europe - Year-over-year growth 2025-2030 (%)
Chart on Regional Comparison - Europe
Data Table on Regional Comparison - Europe

12.3.1 Germany - Market size and forecast 2025-2030

Chart on Germany - Market size and forecast 2025-2030 ($ thousand)
Data Table on Germany - Market size and forecast 2025-2030 ($ thousand)
Chart on Germany - Year-over-year growth 2025-2030 (%)
Data Table on Germany - Year-over-year growth 2025-2030 (%)

12.3.2 UK - Market size and forecast 2025-2030

Chart on UK - Market size and forecast 2025-2030 ($ thousand)
Data Table on UK - Market size and forecast 2025-2030 ($ thousand)
Chart on UK - Year-over-year growth 2025-2030 (%)
Data Table on UK - Year-over-year growth 2025-2030 (%)

12.3.3 France - Market size and forecast 2025-2030

Chart on France - Market size and forecast 2025-2030 ($ thousand)
Data Table on France - Market size and forecast 2025-2030 ($ thousand)
Chart on France - Year-over-year growth 2025-2030 (%)
Data Table on France - Year-over-year growth 2025-2030 (%)

12.3.4 Italy - Market size and forecast 2025-2030

Chart on Italy - Market size and forecast 2025-2030 ($ thousand)
Data Table on Italy - Market size and forecast 2025-2030 ($ thousand)
Chart on Italy - Year-over-year growth 2025-2030 (%)
Data Table on Italy - Year-over-year growth 2025-2030 (%)

12.3.5 Spain - Market size and forecast 2025-2030

Chart on Spain - Market size and forecast 2025-2030 ($ thousand)
Data Table on Spain - Market size and forecast 2025-2030 ($ thousand)
Chart on Spain - Year-over-year growth 2025-2030 (%)
Data Table on Spain - Year-over-year growth 2025-2030 (%)

12.3.6 The Netherlands - Market size and forecast 2025-2030

Chart on The Netherlands - Market size and forecast 2025-2030 ($ thousand)
Data Table on The Netherlands - Market size and forecast 2025-2030 ($ thousand)
Chart on The Netherlands - Year-over-year growth 2025-2030 (%)
Data Table on The Netherlands - Year-over-year growth 2025-2030 (%)

12.4 North America - Market size and forecast 2025-2030

Chart on North America - Market size and forecast 2025-2030 ($ thousand)
Data Table on North America - Market size and forecast 2025-2030 ($ thousand)
Chart on North America - Year-over-year growth 2025-2030 (%)
Data Table on North America - Year-over-year growth 2025-2030 (%)
Chart on Regional Comparison - North America
Data Table on Regional Comparison - North America

12.4.1 US - Market size and forecast 2025-2030

Chart on US - Market size and forecast 2025-2030 ($ thousand)
Data Table on US - Market size and forecast 2025-2030 ($ thousand)
Chart on US - Year-over-year growth 2025-2030 (%)
Data Table on US - Year-over-year growth 2025-2030 (%)

12.4.2 Canada - Market size and forecast 2025-2030

Chart on Canada - Market size and forecast 2025-2030 ($ thousand)
Data Table on Canada - Market size and forecast 2025-2030 ($ thousand)
Chart on Canada - Year-over-year growth 2025-2030 (%)
Data Table on Canada - Year-over-year growth 2025-2030 (%)

12.4.3 Mexico - Market size and forecast 2025-2030

Chart on Mexico - Market size and forecast 2025-2030 ($ thousand)
Data Table on Mexico - Market size and forecast 2025-2030 ($ thousand)
Chart on Mexico - Year-over-year growth 2025-2030 (%)
Data Table on Mexico - Year-over-year growth 2025-2030 (%)

12.5 APAC - Market size and forecast 2025-2030

Chart on APAC - Market size and forecast 2025-2030 ($ thousand)
Data Table on APAC - Market size and forecast 2025-2030 ($ thousand)
Chart on APAC - Year-over-year growth 2025-2030 (%)
Data Table on APAC - Year-over-year growth 2025-2030 (%)
Chart on Regional Comparison - APAC
Data Table on Regional Comparison - APAC

12.5.1 China - Market size and forecast 2025-2030

Chart on China - Market size and forecast 2025-2030 ($ thousand)
Data Table on China - Market size and forecast 2025-2030 ($ thousand)
Chart on China - Year-over-year growth 2025-2030 (%)
Data Table on China - Year-over-year growth 2025-2030 (%)

12.5.2 Japan - Market size and forecast 2025-2030

Chart on Japan - Market size and forecast 2025-2030 ($ thousand)
Data Table on Japan - Market size and forecast 2025-2030 ($ thousand)
Chart on Japan - Year-over-year growth 2025-2030 (%)
Data Table on Japan - Year-over-year growth 2025-2030 (%)

12.5.3 India - Market size and forecast 2025-2030

Chart on India - Market size and forecast 2025-2030 ($ thousand)
Data Table on India - Market size and forecast 2025-2030 ($ thousand)
Chart on India - Year-over-year growth 2025-2030 (%)
Data Table on India - Year-over-year growth 2025-2030 (%)

12.5.4 South Korea - Market size and forecast 2025-2030

Chart on South Korea - Market size and forecast 2025-2030 ($ thousand)
Data Table on South Korea - Market size and forecast 2025-2030 ($ thousand)
Chart on South Korea - Year-over-year growth 2025-2030 (%)
Data Table on South Korea - Year-over-year growth 2025-2030 (%)

12.5.5 Australia - Market size and forecast 2025-2030

Chart on Australia - Market size and forecast 2025-2030 ($ thousand)
Data Table on Australia - Market size and forecast 2025-2030 ($ thousand)
Chart on Australia - Year-over-year growth 2025-2030 (%)
Data Table on Australia - Year-over-year growth 2025-2030 (%)

12.5.6 Indonesia - Market size and forecast 2025-2030

Chart on Indonesia - Market size and forecast 2025-2030 ($ thousand)
Data Table on Indonesia - Market size and forecast 2025-2030 ($ thousand)
Chart on Indonesia - Year-over-year growth 2025-2030 (%)
Data Table on Indonesia - Year-over-year growth 2025-2030 (%)

12.6 South America - Market size and forecast 2025-2030

Chart on South America - Market size and forecast 2025-2030 ($ thousand)
Data Table on South America - Market size and forecast 2025-2030 ($ thousand)
Chart on South America - Year-over-year growth 2025-2030 (%)
Data Table on South America - Year-over-year growth 2025-2030 (%)
Chart on Regional Comparison - South America
Data Table on Regional Comparison - South America

12.6.1 Brazil - Market size and forecast 2025-2030

Chart on Brazil - Market size and forecast 2025-2030 ($ thousand)
Data Table on Brazil - Market size and forecast 2025-2030 ($ thousand)
Chart on Brazil - Year-over-year growth 2025-2030 (%)
Data Table on Brazil - Year-over-year growth 2025-2030 (%)

12.6.2 Argentina - Market size and forecast 2025-2030

Chart on Argentina - Market size and forecast 2025-2030 ($ thousand)
Data Table on Argentina - Market size and forecast 2025-2030 ($ thousand)
Chart on Argentina - Year-over-year growth 2025-2030 (%)
Data Table on Argentina - Year-over-year growth 2025-2030 (%)

12.6.3 Chile - Market size and forecast 2025-2030

Chart on Chile - Market size and forecast 2025-2030 ($ thousand)
Data Table on Chile - Market size and forecast 2025-2030 ($ thousand)
Chart on Chile - Year-over-year growth 2025-2030 (%)
Data Table on Chile - Year-over-year growth 2025-2030 (%)

12.7 Middle East and Africa - Market size and forecast 2025-2030

Chart on Middle East and Africa - Market size and forecast 2025-2030 ($ thousand)
Data Table on Middle East and Africa - Market size and forecast 2025-2030 ($ thousand)
Chart on Middle East and Africa - Year-over-year growth 2025-2030 (%)
Data Table on Middle East and Africa - Year-over-year growth 2025-2030 (%)
Chart on Regional Comparison - Middle East and Africa
Data Table on Regional Comparison - Middle East and Africa

12.7.1 Saudi Arabia - Market size and forecast 2025-2030

Chart on Saudi Arabia - Market size and forecast 2025-2030 ($ thousand)
Data Table on Saudi Arabia - Market size and forecast 2025-2030 ($ thousand)
Chart on Saudi Arabia - Year-over-year growth 2025-2030 (%)
Data Table on Saudi Arabia - Year-over-year growth 2025-2030 (%)

12.7.2 UAE - Market size and forecast 2025-2030

Chart on UAE - Market size and forecast 2025-2030 ($ thousand)
Data Table on UAE - Market size and forecast 2025-2030 ($ thousand)
Chart on UAE - Year-over-year growth 2025-2030 (%)
Data Table on UAE - Year-over-year growth 2025-2030 (%)

12.7.3 South Africa - Market size and forecast 2025-2030

Chart on South Africa - Market size and forecast 2025-2030 ($ thousand)
Data Table on South Africa - Market size and forecast 2025-2030 ($ thousand)
Chart on South Africa - Year-over-year growth 2025-2030 (%)
Data Table on South Africa - Year-over-year growth 2025-2030 (%)

12.7.4 Israel - Market size and forecast 2025-2030

Chart on Israel - Market size and forecast 2025-2030 ($ thousand)
Data Table on Israel - Market size and forecast 2025-2030 ($ thousand)
Chart on Israel - Year-over-year growth 2025-2030 (%)
Data Table on Israel - Year-over-year growth 2025-2030 (%)

12.7.5 Turkey - Market size and forecast 2025-2030

Chart on Turkey - Market size and forecast 2025-2030 ($ thousand)
Data Table on Turkey - Market size and forecast 2025-2030 ($ thousand)
Chart on Turkey - Year-over-year growth 2025-2030 (%)
Data Table on Turkey - Year-over-year growth 2025-2030 (%)

12.8 Market opportunity by geography

Market opportunity by geography ($ thousand)
Data Tables on Market opportunity by geography ($ thousand)

13. Drivers, Challenges, and Opportunity

13.1 Market drivers

Surging demand for screen free socialization
Expansion of pop culture intellectual property
Growth of specialty retail distribution channels

13.2 Market challenges

Volatile freight costs and disrupted supply chains
Raw material inflation and manufacturing pressure
Digital screen competition and customer acquisition

13.3 Impact of drivers and challenges

Impact of drivers and challenges in 2025 and 2030

13.4 Market opportunities

Expansion of digital hybrid gaming mechanics and companion mobile applications
Demand for sustainable components and eco-friendly manufacturing processes
Growth in educational and cognitive skill development board games

14. Competitive Landscape

14.1 Overview

14.2

Overview on criticality of inputs and factors of differentiation

14.3 Landscape disruption

Overview on factors of disruption

14.4 Industry risks

Impact of key risks on business

15. Competitive Analysis

15.1 Companies profiled

Companies covered

15.2 Company ranking index

15.3 Market positioning of companies

Matrix on companies position and classification

15.4 Arcane Wonders Inc.

Arcane Wonders Inc. - Overview
Arcane Wonders Inc. - Product / Service
Arcane Wonders Inc. - Key offerings
SWOT

15.5 Ares Games S.r.l.

Ares Games S.r.l. - Overview
Ares Games S.r.l. - Product / Service
Ares Games S.r.l. - Key offerings
SWOT

15.6 Asmodee Group

Asmodee Group - Overview
Asmodee Group - Product / Service
Asmodee Group - Key offerings
SWOT

15.7 Catalyst Game Labs

Catalyst Game Labs - Overview
Catalyst Game Labs - Product / Service
Catalyst Game Labs - Key offerings
SWOT

15.8 Corvus Belli S.L.

Corvus Belli S.L. - Overview
Corvus Belli S.L. - Product / Service
Corvus Belli S.L. - Key offerings
SWOT

15.9 Goliath Games

Goliath Games - Overview
Goliath Games - Product / Service
Goliath Games - Key offerings
SWOT

15.10 Hasbro Inc.

Hasbro Inc. - Overview
Hasbro Inc. - Business segments
Hasbro Inc. - Key offerings
Hasbro Inc. - Segment focus
SWOT

15.11 Mantic Games Ltd.

Mantic Games Ltd. - Overview
Mantic Games Ltd. - Product / Service
Mantic Games Ltd. - Key offerings
SWOT

15.12 Mattel Inc.

Mattel Inc. - Overview
Mattel Inc. - Business segments
Mattel Inc. - Key offerings
Mattel Inc. - Segment focus
SWOT

15.13 Modiphius Entertainment Ltd.

Modiphius Entertainment Ltd. - Overview
Modiphius Entertainment Ltd. - Product / Service
Modiphius Entertainment Ltd. - Key offerings
SWOT

15.14 Paizo Inc.

Paizo Inc. - Overview
Paizo Inc. - Product / Service
Paizo Inc. - Key offerings
SWOT

15.15 Ravensburger AG

Ravensburger AG - Overview
Ravensburger AG - Product / Service
Ravensburger AG - Key offerings
SWOT

15.16 Rio Grande Games Inc.

Rio Grande Games Inc. - Overview
Rio Grande Games Inc. - Product / Service
Rio Grande Games Inc. - Key offerings
SWOT

15.17 Spin Master Corp.

Spin Master Corp. - Overview
Spin Master Corp. - Business segments
Spin Master Corp. - Key offerings
Spin Master Corp. - Segment focus
SWOT

15.18 Warlord Games

Warlord Games - Overview
Warlord Games - Product / Service
Warlord Games - Key offerings
SWOT

16. Appendix

16.1 Scope of the report

Market definition
Objectives
Notes and caveats

16.2 Inclusions and exclusions checklist

Inclusions checklist
Exclusions checklist

16.3 Currency conversion rates for US$

16.4 Research methodology

16.5 Data procurement

Information sources

16.6 Data validation

16.7 Validation techniques employed for market sizing

16.8 Data synthesis

16.9 360 degree market analysis

16.10 List of abbreviations

Research Methodology

Technavio presents a detailed picture of the market by way of study, synthesis, and summation of data from multiple sources. The analysts have presented the various facets of the market with a particular focus on identifying the key industry influencers. The data thus presented is comprehensive, reliable, and the result of extensive research, both primary and secondary.

INFORMATION SOURCES

Primary sources

  • Manufacturers and suppliers
  • Channel partners
  • Industry experts
  • Strategic decision makers

Secondary sources

  • Industry journals and periodicals
  • Government data
  • Financial reports of key industry players
  • Historical data
  • Press releases

DATA ANALYSIS

Data Synthesis

  • Collation of data
  • Estimation of key figures
  • Analysis of derived insights

Data Validation

  • Triangulation with data models
  • Reference against proprietary databases
  • Corroboration with industry experts

REPORT WRITING

Qualitative

  • Market drivers
  • Market challenges
  • Market trends
  • Five forces analysis

Quantitative

  • Market size and forecast
  • Market segmentation
  • Geographical insights
  • Competitive landscape

Interested in this report?

Get your sample now to see our research methodology and insights!

Download Now

Frequently Asked Questions

Tabletop Games market growth will increase by USD 4998011.9 thousand thousand during 2026-2030.

The Tabletop Games market is expected to grow at a CAGR of 11.8% during 2026-2030.

Tabletop Games market is segmented by Type (Monopoly, Scrabble, Chess, Ludo, Others) Distribution channel (Offline, Online) End-user (Children, Adults)

Arcane Wonders Inc., Ares Games S.r.l., Asmodee Group, Catalyst Game Labs, CMON Ltd., Corvus Belli S.L., Czech Games Edition s.r.o., Goliath Games, Hasbro Inc., Mantic Games Ltd., Mattel Inc., Modiphius Entertainment Ltd., Paizo Inc., Pegasus Spiele GmbH, Ravensburger AG, Renegade Game Studios, Rio Grande Games Inc., Spin Master Corp., Stonemaier Games, Warlord Games are a few of the key vendors in the Tabletop Games market.

Europe will register the highest growth rate of 36.1% among the other regions. Therefore, the Tabletop Games market in Europe is expected to garner significant business opportunities for the vendors during the forecast period.

Germany, UK, France, Italy, Spain, The Netherlands, US, Canada, Mexico, China, Japan, India, South Korea, Australia, Indonesia, Brazil, Argentina, Chile, Saudi Arabia, UAE, South Africa, Israel, Turkey

  • Surging demand for screen free socialization is the driving factor this market.

The Tabletop Games market vendors should focus on grabbing business opportunities from the Type segment as it accounted for the largest market share in the base year.
RIA - Research AI Assistant
Ask RIA
