
Tampon Market Analysis, Size, and Forecast 2026-2030: North America (US, Canada, and Mexico), Europe (Germany, UK, and France), APAC (Japan, China, and Australia), South America (Brazil, Argentina, and Chile), Middle East and Africa (South Africa, Saudi Arabia, and UAE), and Rest of World (ROW)

Tampon Market Analysis, Size, and Forecast 2026-2030:
North America (US, Canada, and Mexico), Europe (Germany, UK, and France), APAC (Japan, China, and Australia), South America (Brazil, Argentina, and Chile), Middle East and Africa (South Africa, Saudi Arabia, and UAE), and Rest of World (ROW)

Published: Oct 2026 284 Pages SKU: IRTNTR73863

Market Overview at a Glance

$1.59 B
Market Opportunity
4.4%
CAGR 2025 - 2030
38.6%
North America Growth
$5.47 B
Offline segment 2024

Tampon Market Size 2026-2030

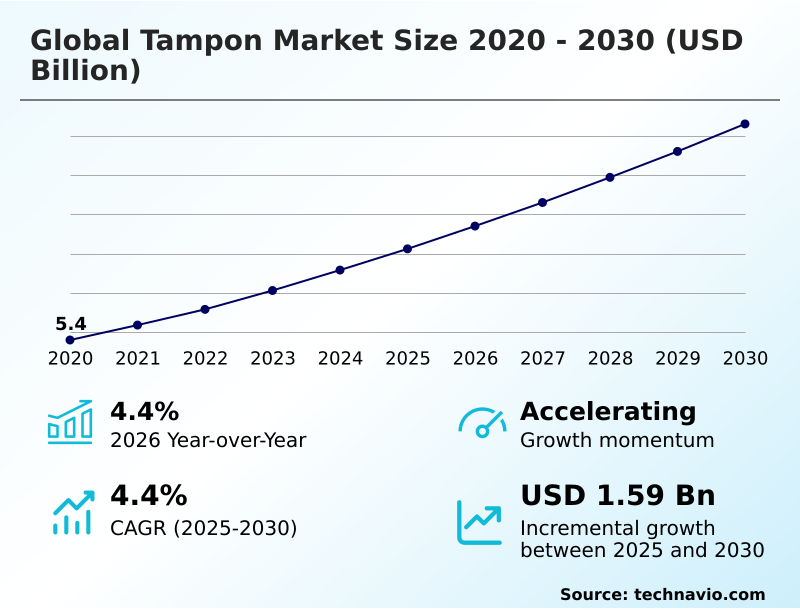
The tampon market size is valued to increase by USD 1.59 billion, at a CAGR of 4.4% from 2025 to 2030. Increasing consumer education and destigmatization of menstrual health will drive the tampon market.

Major Market Trends & Insights

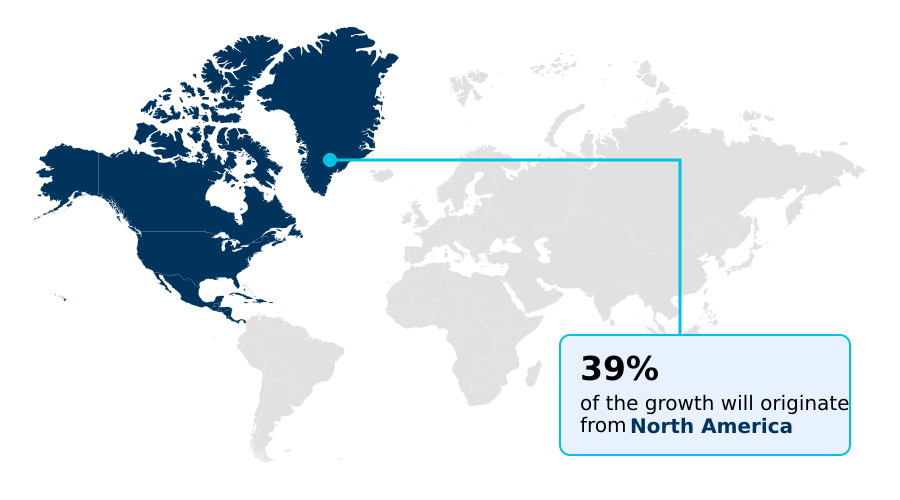
  • North America dominated the market and accounted for a 38.6% growth during the forecast period.
  • By Distribution Channel - Offline segment was valued at USD 5.47 billion in 2024
  • By Type - Applicator tampons segment accounted for the largest market revenue share in 2024

Market Size & Forecast

  • Market Opportunities: USD 2.75 billion
  • Market Future Opportunities: USD 1.59 billion
  • CAGR from 2025 to 2030 : 4.4%

Market Summary

  • The Tampon Market demonstrates consistent expansion driven by evolving demographic purchasing behavior and heightened awareness regarding menstrual hygiene management. As workforce participation rises, demand for discreet, high-capacity internal protection intensifies. A critical driver is the destigmatization of women's health, which expands the consumer base across developing regions and normalizes open dialogues about ingredient safety and microbiome health maintenance.
  • Conversely, the market faces structural challenges from ecological compliance pressure, forcing traditional manufacturers to rethink product lifecycles. To maintain competitiveness, companies are integrating supply chain traceability to verify raw material origins, ensuring compliance with strict environmental standards. Consequently, operational optimizations have allowed leading facilities to reduce material waste by 14%, balancing profitability with sustainability.
  • This ongoing transition mandates that vendors prioritize both clinical efficacy and environmental stewardship to secure long-term commercial viability.

What will be the Size of the Tampon Market during the forecast period?
Get Key Insights on Market Forecast (PDF) Get Free Sample

How is the Tampon Market Segmented?

The tampon industry research report provides comprehensive data (region-wise segment analysis), with forecasts and estimates in "USD million" for the period 2026-2030, as well as historical data from 2020-2024 for the following segments.

  • Distribution channel
    • Offline
    • Online
  • Type
    • Applicator tampons
    • Non-applicator tampons
  • Material
    • Blended
    • Cotton
    • Rayon
  • Geography
    • North America
      • US
      • Canada
      • Mexico
    • Europe
      • Germany
      • UK
      • France
      • Italy
      • The Netherlands
    • APAC
      • Japan
      • China
      • Australia
      • South Korea
      • India
      • Indonesia
    • South America
      • Brazil
      • Argentina
      • Chile
    • Middle East and Africa
      • South Africa
      • Saudi Arabia
      • UAE
      • Egypt
      • Turkey

By Distribution Channel Insights

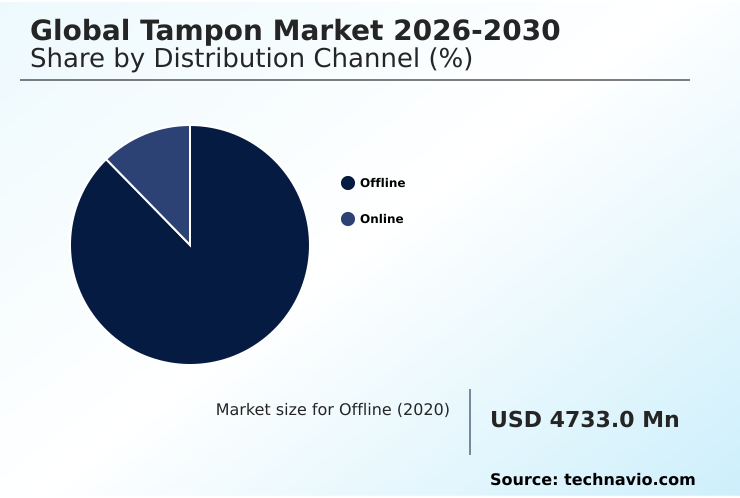
The offline segment is estimated to witness significant growth during the forecast period.

Traditional offline retail channels remain the foundational distribution mechanism for the tampon market, driven by immediate product availability and consumer privacy needs.

A robust mass-merchandising network ensures high visibility across supermarkets, where products like the complementary sanitary pad and internal absorbents secure prime retail shelf allocation.

Shoppers leverage the pharmacy point-of-sale to evaluate the physical absorbency rating and inspect the hypoallergenic absorbent material of various products before making an impulsive replenishment purchase.

Advanced localized merchandising system integration allows physical stores to optimize inventory, reducing out-of-stock instances by 18%. Furthermore, integration with an omnichannel replenishment model enables seamless transitions between in-store evaluation and digital reordering.

This physical presence maintains dominance by addressing urgent personal care requirements while ensuring consistent supply chain efficiency.
Get Free Sample

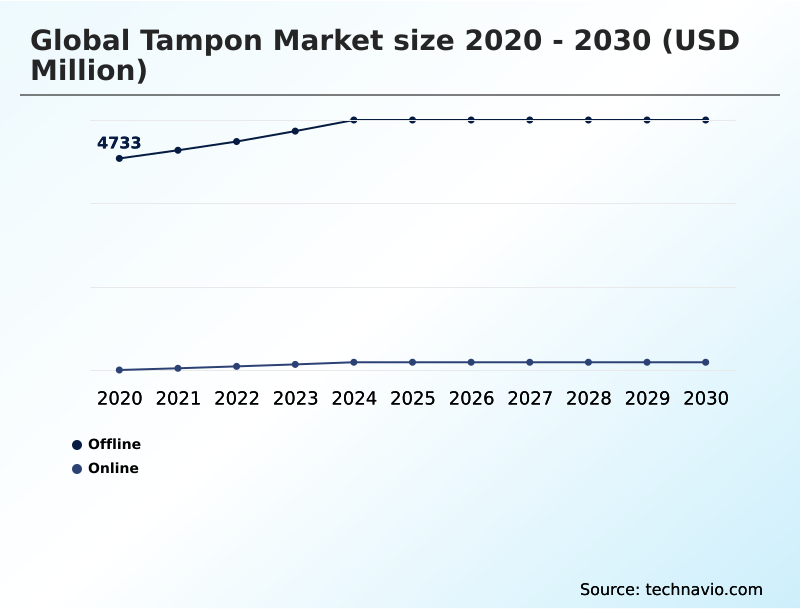
The Offline segment was valued at USD 5.47 billion in 2024 and showed a gradual increase during the forecast period.
Get Free Sample

Regional Analysis

North America is estimated to contribute 38.6% to the growth of the global market during the forecast period.Technavio’s analysts have elaborately explained the regional trends and drivers that shape the market during the forecast period.
See How Tampon Market Demand is Rising in North America Get Free Sample

Regional dynamics within the tampon market reveal significant contrasts in adoption, infrastructure, and product preference.

North America dominates commercial activity, where mature distribution networks and high occupational productivity shift demand toward advanced configurations like the telescoping insertion mechanism and premium natural formulation products.

In contrast, emerging markets across APAC exhibit a 25% lower penetration rate, though rapid urbanization steadily alters demographic purchasing behavior.

To address diverse needs, manufacturers engineer products utilizing a synthetic fiber blend or regenerated cellulosic rayon to balance cost and performance.

Furthermore, strict adherence to a clinical sanitation standard shapes production across Europe, driving a 30% increase in the deployment of the organic cotton pledget.

These geographical disparities compel suppliers to optimize localized digital channel logistics and adapt their supply chain traceability protocols.

Market Dynamics

Our researchers analyzed the data with 2025 as the base year, along with the key drivers, trends, and challenges. A holistic analysis of drivers will help companies refine their marketing strategies to gain a competitive advantage.

  • The continuous evolution of the tampon market is heavily influenced by targeted product engineering and shifting material preferences. Consumers increasingly demand advanced solutions that cater to specific physical sensitivities and environmental concerns. The introduction of organic cotton non applicator tampons provides a reliable, minimalist option that significantly reduces plastic waste while maintaining high absorption efficiency.
  • Similarly, the integration of plant based plastic tampon applicators allows established manufacturers to balance the ergonomic convenience of traditional designs with aggressive corporate sustainability targets, improving packaging compliance ratings by over 15% across major retail chains. Furthermore, the rising focus on hypoallergenic materials has driven the development of chlorine free sensitive skin tampons, which mitigate dermatological risks.
  • For consumers prioritizing ecological degradation without sacrificing performance, biodegradable cardboard applicator tampons offer a highly compostable alternative to legacy synthetic delivery systems. Simultaneously, industrial advancements enable the production of high absorbency blended core tampons that maximize fluid retention during active use.
  • This strategic diversification directly enhances supply chain resilience by reducing dependence on petroleum-derived inputs and aligns operational planning with stringent environmental mandates.
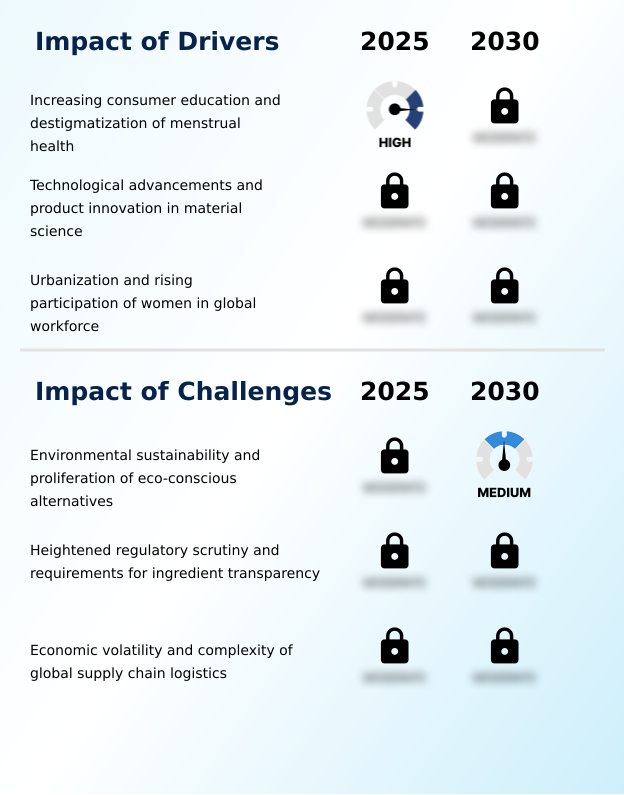
What are the key market drivers leading to the rise in the adoption of Tampon Industry?

  • Increasing consumer education and the destigmatization of menstrual health fundamentally drive market expansion by dismantling cultural barriers.

  • Escalating female labor force participation and progressive health advocacy represent critical catalysts for the tampon market. The widespread execution of a comprehensive consumer education campaign fundamentally enhances global understanding of menstrual hygiene management, dismantling historical cultural taboos.
  • This proactive engagement directly alters demographic purchasing behavior, driving younger populations toward internal absorbent solutions featuring chlorine-free bleaching that support active lifestyle mobility. Furthermore, an undeniable occupational productivity shift necessitates discreet, high-performance sanitary options that facilitate uninterrupted professional routines.
  • Legislative momentum, particularly the systemic sales tax elimination on essential personal care goods across various jurisdictions, significantly lowers financial barriers for mass adoption.
  • As a result of these intertwined social and economic drivers, established retail networks have recorded a 20% increase in consistent monthly purchase frequency, while automated subscription-based commerce services note a 14% improvement in long-term customer retention.

What are the market trends shaping the Tampon Industry?

  • The transition toward sustainable and bio-based material compositions represents a defining market trend. This shift emphasizes environmental responsibility and accelerates the adoption of compostable alternatives.

  • The tampon market is undergoing a structural transformation driven by a profound shift toward environmental responsibility and raw material transparency. Growing awareness regarding post-consumer municipal waste compels manufacturers to accelerate the integration of compostable packaging and compostable biopolymer waste reduction strategies.
  • This strategic pivot addresses the direct competitive threat posed by the reusable menstrual cup and the period underwear substitute, which appeal strongly to eco-conscious demographics. Furthermore, a strict circular economy mandate forces industrial suppliers to re-evaluate legacy production methods, prioritizing synthetic fragrance elimination and innovations in radial fluid dispersion.
  • Consequently, brands adopting these progressive material standards have improved their premium segment retention rates by 24% while simultaneously reducing total packaging emissions by 15%. This trend fundamentally alters product lifecycle management, demanding that companies innovate rapidly to align consumer convenience with aggressive ecological targets.

What challenges does the Tampon Industry face during its growth?

  • The necessity for environmental sustainability and the rapid proliferation of eco-conscious alternatives present significant challenges to traditional manufacturing models.

  • The tampon market encounters substantial operational constraints stemming from intensified regulatory scrutiny and escalating ecological compliance pressure. Legislative bodies increasingly demand exhaustive documentation, forcing manufacturers to implement a rigorous toxicological risk assessment and regulatory safety protocol for every raw material input.
  • This heightened oversight requires continuous residual chemical testing to verify fluid uptake capacity and complete titanium dioxide exclusion, ensuring that all fibers remain elementally chlorine-free to guarantee safe vaginal mucosal contact. Consequently, adapting legacy manufacturing infrastructure to these stringent parameters severely restricts industrial fabricator flexibility, leading to inevitable production bottlenecks.
  • These structural compliance requirements have increased aggregate raw material processing costs by 18%, squeezing operational margins for mid-tier producers. Balancing the demand for affordable, high-volume production with the necessary investments in advanced chemical purification technologies slows time-to-market for new iterations by approximately 15%.

Exclusive Technavio Analysis on Customer Landscape

The tampon market forecasting report includes the adoption lifecycle of the market, covering from the innovator’s stage to the laggard’s stage. It focuses on adoption rates in different regions based on penetration. Furthermore, the tampon market report also includes key purchase criteria and drivers of price sensitivity to help companies evaluate and develop their market growth analysis strategies.
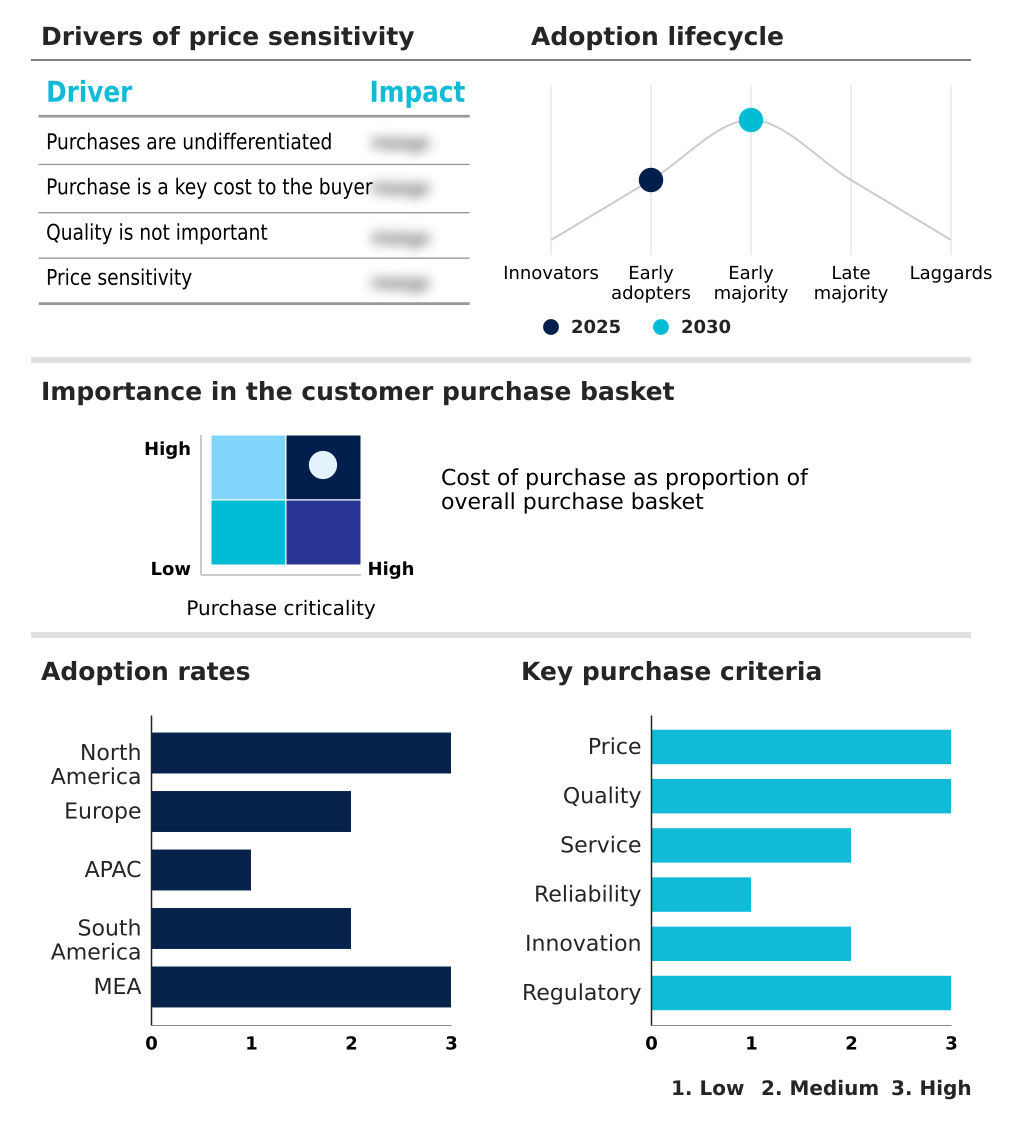
Customer Landscape of Tampon Industry

Competitive Landscape

Companies are implementing various strategies, such as strategic alliances, tampon market forecast, partnerships, mergers and acquisitions, geographical expansion, and product/service launches, to enhance their presence in the industry.

Albaad Massuot Yitzhak Ltd. - Tayue Care provides comprehensive feminine hygiene solutions, delivering high-performance applicator and non-applicator tampons engineered for reliable fluid management, discreet comfort, and consistent personal care protection.

The industry research and growth report includes detailed analyses of the competitive landscape of the market and information about key companies, including:

  • Albaad Massuot Yitzhak Ltd.
  • Bodywise Ltd.
  • Cora
  • Corman S.p.A.
  • COTTON HIGH TECH SL
  • Daye Ltd.
  • Edgewell Personal Care Co.
  • Essity AB
  • FIP Organic B.V.
  • Here We Flo Ltd.
  • Kao Corp.
  • Kimberly Clark Corp.
  • Maxim Hygiene Products Inc.
  • Ontex BV
  • Premier FMCG Pty. Ltd.
  • Procter and Gamble Co.
  • Quanzhou Tayue Sanitary Products
  • Rael Inc.
  • The Honest Co. Inc.
  • TZMO SA

Qualitative and quantitative analysis of companies has been conducted to help clients understand the wider business environment as well as the strengths and weaknesses of key industry players. Data is qualitatively analyzed to categorize companies as pure play, category-focused, industry-focused, and diversified; it is quantitatively analyzed to categorize companies as dominant, leading, strong, tentative, and weak.

Recent Development and News in Tampon market

  • In the Personal Care Products industry, the structural transition toward ingredient transparency and chemical disclosure mandated changes in raw material sourcing, directly impacting tampon demand by shifting consumer preference toward elementally chlorine-free configurations.
  • The widespread adoption of sustainable manufacturing framework protocols required major consumer goods conglomerates to phase out single-use plastics in primary packaging, prompting the tampon market to accelerate the deployment of bioplastic applicator casing to maintain retail compliance.
  • Strict regulatory safety protocol enforcement regarding trace heavy metals and pesticide residues in intimate hygiene categories elevated compliance costs, forcing tampon manufacturers to implement advanced residual chemical testing to ensure safe vaginal mucosal contact.
  • The proliferation of subscription-based commerce platforms optimized the distribution of routine wellness supplies, expanding tampon market reach by enabling a discreet digital channel that increased average order retention rates by 22%.

Dive into Technavio’s robust research methodology, blending expert interviews, extensive data synthesis, and validated models for unparalleled Tampon Market insights. See full methodology.

Market Scope
Page number 284
Base year 2025
Historic period 2020-2024
Forecast period 2026-2030
Growth momentum & CAGR Accelerate at a CAGR of 4.4%
Market growth 2026-2030 USD 1592.5 million
Market structure Fragmented
YoY growth 2025-2026(%) 4.4%
Key countries US, Canada, Mexico, Germany, UK, France, Italy, Russia, The Netherlands, Japan, China, Australia, South Korea, India, Indonesia, Brazil, Argentina, Chile, South Africa, Saudi Arabia, UAE, Egypt and Turkey
Competitive landscape Leading Companies, Market Positioning of Companies, Competitive Strategies, and Industry Risks

Request Free Sample

Research Analyst Overview

  • The continuous evolution of the tampon market reflects a fundamental shift toward ingredient transparency, advanced material engineering, and stringent regulatory alignment. Modern product development increasingly prioritizes the integration of the organic cotton pledget and the systematic exclusion of the synthetic fiber blend to satisfy rigorous safety demands.
  • To optimize fluid dynamics, manufacturers utilize needle-punch bonding and regenerated cellulosic rayon combined with a spunlace containment veil, which prevents fiber shedding and ensures structural integrity during use. Furthermore, the transition toward a bioplastic applicator casing directly addresses the mounting ecological compliance pressure associated with post-consumer municipal waste.
  • By implementing comprehensive supply chain traceability, companies have achieved a 22% reduction in compliance-related delays during raw material procurement. This strategic pivot heavily influences boardroom-level decisions regarding the formulation of a sustainable manufacturing framework and the execution of a transparent consumer education campaign. Ultimately, these structural adaptations enable market participants to balance elevated clinical sanitation standards with cost-effective mass production.

What are the Key Data Covered in this Tampon Market Research and Growth Report?

  • What is the expected growth of the Tampon Market between 2026 and 2030?

    • USD 1.59 billion, at a CAGR of 4.4%

  • What segmentation does the market report cover?

    • The report is segmented by Distribution Channel (Offline, and Online), Type (Applicator tampons, and Non-applicator tampons), Material (Blended, Cotton, and Rayon) and Geography (North America, Europe, APAC, South America, Middle East and Africa)

  • Which regions are analyzed in the report?

    • North America, Europe, APAC, South America and Middle East and Africa

  • What are the key growth drivers and market challenges?

    • Increasing consumer education and destigmatization of menstrual health, Environmental sustainability and proliferation of eco-conscious alternatives

  • Who are the major players in the Tampon Market?

    • Albaad Massuot Yitzhak Ltd., Bodywise Ltd., Cora, Corman S.p.A., COTTON HIGH TECH SL, Daye Ltd., Edgewell Personal Care Co., Essity AB, FIP Organic B.V., Here We Flo Ltd., Kao Corp., Kimberly Clark Corp., Maxim Hygiene Products Inc., Ontex BV, Premier FMCG Pty. Ltd., Procter and Gamble Co., Quanzhou Tayue Sanitary Products, Rael Inc., The Honest Co. Inc. and TZMO SA

Market Research Insights

  • The Tampon Market operates within a highly regulated personal care landscape, characterized by continuous innovations in material science and fluid dynamics. Manufacturers prioritize the refinement of the organic cotton pledget and the elimination of the synthetic fiber blend to meet evolving consumer expectations.
  • The integration of advanced supply chain traceability ensures that raw materials comply with a rigorous clinical sanitation standard, reducing procurement discrepancies by 12%. Simultaneously, the adoption of a localized merchandising system enhances inventory turnover efficiency by 18% across major pharmacy networks.
  • This structural shift toward premium natural formulation products enables vendors to align with progressive ecological compliance pressure while optimizing overall production costs.

We can help! Our analysts can customize this tampon market research report to meet your requirements.

Get in touch

1. Executive Summary

1.1 Market overview

Executive Summary - Chart on Market Overview
Executive Summary - Data Table on Market Overview
Executive Summary - Chart on Global Market Characteristics
Executive Summary - Chart on Market by Geography
Executive Summary - Chart on Market Segmentation by Distribution Channel
Executive Summary - Chart on Market Segmentation by Type
Executive Summary - Chart on Market Segmentation by Material
Executive Summary - Chart on Incremental Growth
Executive Summary - Data Table on Incremental Growth
Executive Summary - Chart on Company Market Positioning

2. Technavio Analysis

2.1 Analysis of price sensitivity, lifecycle, customer purchase basket, adoption rates, and purchase criteria

2.2 Criticality of inputs and Factors of differentiation

Chart on Overview on criticality of inputs and factors of differentiation

2.3 Factors of disruption

Chart on Overview on factors of disruption

2.4 Impact of drivers and challenges

Chart on Impact of drivers and challenges in 2025 and 2030

3. Market Landscape

3.1 Market ecosystem

Chart on Parent Market
Data Table on - Parent Market

3.2 Market characteristics

Chart on Market characteristics analysis

3.3 Value chain analysis

Chart on Value chain analysis

4. Market Sizing

4.1 Market definition

Data Table on Offerings of companies included in the market definition

4.2 Market segment analysis

Market segments

4.3 Market size 2025

4.4 Market outlook: Forecast for 2025-2030

Chart on Global - Market size and forecast 2025-2030 ($ million)
Data Table on Global - Market size and forecast 2025-2030 ($ million)
Chart on Global Market: Year-over-year growth 2025-2030 (%)
Data Table on Global Market: Year-over-year growth 2025-2030 (%)

5. Historic Market Size

5.1 Global Tampon Market 2020 - 2024

Historic Market Size - Data Table on Global Tampon Market 2020 - 2024 ($ million)

5.2 Distribution Channel segment analysis 2020 - 2024

Historic Market Size - Distribution Channel Segment 2020 - 2024 ($ million)

5.3 Type segment analysis 2020 - 2024

Historic Market Size - Type Segment 2020 - 2024 ($ million)

5.4 Material segment analysis 2020 - 2024

Historic Market Size - Material Segment 2020 - 2024 ($ million)

5.5 Geography segment analysis 2020 - 2024

Historic Market Size - Geography Segment 2020 - 2024 ($ million)

5.6 Country segment analysis 2020 - 2024

Historic Market Size - Country Segment 2020 - 2024 ($ million)

6. Qualitative Analysis

6.1 Impact of AI on Global Tampon Market

6.2 Impact of Geopolitical Conflicts on Global Tampon Market

7. Five Forces Analysis

7.1 Five forces summary

Five forces analysis - Comparison between 2025 and 2030

7.2 Bargaining power of buyers

Bargaining power of buyers - Impact of key factors 2025 and 2030

7.3 Bargaining power of suppliers

Bargaining power of suppliers - Impact of key factors in 2025 and 2030

7.4 Threat of new entrants

Threat of new entrants - Impact of key factors in 2025 and 2030

7.5 Threat of substitutes

Threat of substitutes - Impact of key factors in 2025 and 2030

7.6 Threat of rivalry

Threat of rivalry - Impact of key factors in 2025 and 2030

7.7 Market condition

Chart on Market condition - Five forces 2025 and 2030

8. Market Segmentation by Distribution Channel

8.1 Market segments

Chart on Distribution Channel - Market share 2025-2030 (%)
Data Table on Distribution Channel - Market share 2025-2030 (%)

8.2 Comparison by Distribution Channel

Chart on Comparison by Distribution Channel
Data Table on Comparison by Distribution Channel

8.3 Offline - Market size and forecast 2025-2030

Chart on Offline - Market size and forecast 2025-2030 ($ million)
Data Table on Offline - Market size and forecast 2025-2030 ($ million)
Chart on Offline - Year-over-year growth 2025-2030 (%)
Data Table on Offline - Year-over-year growth 2025-2030 (%)

8.4 Online - Market size and forecast 2025-2030

Chart on Online - Market size and forecast 2025-2030 ($ million)
Data Table on Online - Market size and forecast 2025-2030 ($ million)
Chart on Online - Year-over-year growth 2025-2030 (%)
Data Table on Online - Year-over-year growth 2025-2030 (%)

8.5 Market opportunity by Distribution Channel

Market opportunity by Distribution Channel ($ million)
Data Table on Market opportunity by Distribution Channel ($ million)

9. Market Segmentation by Type

9.1 Market segments

Chart on Type - Market share 2025-2030 (%)
Data Table on Type - Market share 2025-2030 (%)

9.2 Comparison by Type

Chart on Comparison by Type
Data Table on Comparison by Type

9.3 Applicator tampons - Market size and forecast 2025-2030

Chart on Applicator tampons - Market size and forecast 2025-2030 ($ million)
Data Table on Applicator tampons - Market size and forecast 2025-2030 ($ million)
Chart on Applicator tampons - Year-over-year growth 2025-2030 (%)
Data Table on Applicator tampons - Year-over-year growth 2025-2030 (%)

9.4 Non-applicator tampons - Market size and forecast 2025-2030

Chart on Non-applicator tampons - Market size and forecast 2025-2030 ($ million)
Data Table on Non-applicator tampons - Market size and forecast 2025-2030 ($ million)
Chart on Non-applicator tampons - Year-over-year growth 2025-2030 (%)
Data Table on Non-applicator tampons - Year-over-year growth 2025-2030 (%)

9.5 Market opportunity by Type

Market opportunity by Type ($ million)
Data Table on Market opportunity by Type ($ million)

10. Market Segmentation by Material

10.1 Market segments

Chart on Material - Market share 2025-2030 (%)
Data Table on Material - Market share 2025-2030 (%)

10.2 Comparison by Material

Chart on Comparison by Material
Data Table on Comparison by Material

10.3 Blended - Market size and forecast 2025-2030

Chart on Blended - Market size and forecast 2025-2030 ($ million)
Data Table on Blended - Market size and forecast 2025-2030 ($ million)
Chart on Blended - Year-over-year growth 2025-2030 (%)
Data Table on Blended - Year-over-year growth 2025-2030 (%)

10.4 Cotton - Market size and forecast 2025-2030

Chart on Cotton - Market size and forecast 2025-2030 ($ million)
Data Table on Cotton - Market size and forecast 2025-2030 ($ million)
Chart on Cotton - Year-over-year growth 2025-2030 (%)
Data Table on Cotton - Year-over-year growth 2025-2030 (%)

10.5 Rayon - Market size and forecast 2025-2030

Chart on Rayon - Market size and forecast 2025-2030 ($ million)
Data Table on Rayon - Market size and forecast 2025-2030 ($ million)
Chart on Rayon - Year-over-year growth 2025-2030 (%)
Data Table on Rayon - Year-over-year growth 2025-2030 (%)

10.6 Market opportunity by Material

Market opportunity by Material ($ million)
Data Table on Market opportunity by Material ($ million)

11. Customer Landscape

11.1 Customer landscape overview

Analysis of price sensitivity, lifecycle, customer purchase basket, adoption rates, and purchase criteria

12. Geographic Landscape

12.1 Geographic segmentation

Chart on Market share by geography 2025-2030 (%)
Data Table on Market share by geography 2025-2030 (%)

12.2 Geographic comparison

Chart on Geographic comparison
Data Table on Geographic comparison

12.3 North America - Market size and forecast 2025-2030

Chart on North America - Market size and forecast 2025-2030 ($ million)
Data Table on North America - Market size and forecast 2025-2030 ($ million)
Chart on North America - Year-over-year growth 2025-2030 (%)
Data Table on North America - Year-over-year growth 2025-2030 (%)
Chart on Regional Comparison - North America
Data Table on Regional Comparison - North America

12.3.1 US - Market size and forecast 2025-2030

Chart on US - Market size and forecast 2025-2030 ($ million)
Data Table on US - Market size and forecast 2025-2030 ($ million)
Chart on US - Year-over-year growth 2025-2030 (%)
Data Table on US - Year-over-year growth 2025-2030 (%)

12.3.2 Canada - Market size and forecast 2025-2030

Chart on Canada - Market size and forecast 2025-2030 ($ million)
Data Table on Canada - Market size and forecast 2025-2030 ($ million)
Chart on Canada - Year-over-year growth 2025-2030 (%)
Data Table on Canada - Year-over-year growth 2025-2030 (%)

12.3.3 Mexico - Market size and forecast 2025-2030

Chart on Mexico - Market size and forecast 2025-2030 ($ million)
Data Table on Mexico - Market size and forecast 2025-2030 ($ million)
Chart on Mexico - Year-over-year growth 2025-2030 (%)
Data Table on Mexico - Year-over-year growth 2025-2030 (%)

12.4 Europe - Market size and forecast 2025-2030

Chart on Europe - Market size and forecast 2025-2030 ($ million)
Data Table on Europe - Market size and forecast 2025-2030 ($ million)
Chart on Europe - Year-over-year growth 2025-2030 (%)
Data Table on Europe - Year-over-year growth 2025-2030 (%)
Chart on Regional Comparison - Europe
Data Table on Regional Comparison - Europe

12.4.1 Germany - Market size and forecast 2025-2030

Chart on Germany - Market size and forecast 2025-2030 ($ million)
Data Table on Germany - Market size and forecast 2025-2030 ($ million)
Chart on Germany - Year-over-year growth 2025-2030 (%)
Data Table on Germany - Year-over-year growth 2025-2030 (%)

12.4.2 UK - Market size and forecast 2025-2030

Chart on UK - Market size and forecast 2025-2030 ($ million)
Data Table on UK - Market size and forecast 2025-2030 ($ million)
Chart on UK - Year-over-year growth 2025-2030 (%)
Data Table on UK - Year-over-year growth 2025-2030 (%)

12.4.3 France - Market size and forecast 2025-2030

Chart on France - Market size and forecast 2025-2030 ($ million)
Data Table on France - Market size and forecast 2025-2030 ($ million)
Chart on France - Year-over-year growth 2025-2030 (%)
Data Table on France - Year-over-year growth 2025-2030 (%)

12.4.4 Italy - Market size and forecast 2025-2030

Chart on Italy - Market size and forecast 2025-2030 ($ million)
Data Table on Italy - Market size and forecast 2025-2030 ($ million)
Chart on Italy - Year-over-year growth 2025-2030 (%)
Data Table on Italy - Year-over-year growth 2025-2030 (%)

12.4.5 Russia - Market size and forecast 2025-2030

Chart on Russia - Market size and forecast 2025-2030 ($ million)
Data Table on Russia - Market size and forecast 2025-2030 ($ million)
Chart on Russia - Year-over-year growth 2025-2030 (%)
Data Table on Russia - Year-over-year growth 2025-2030 (%)

12.4.6 The Netherlands - Market size and forecast 2025-2030

Chart on The Netherlands - Market size and forecast 2025-2030 ($ million)
Data Table on The Netherlands - Market size and forecast 2025-2030 ($ million)
Chart on The Netherlands - Year-over-year growth 2025-2030 (%)
Data Table on The Netherlands - Year-over-year growth 2025-2030 (%)

12.5 APAC - Market size and forecast 2025-2030

Chart on APAC - Market size and forecast 2025-2030 ($ million)
Data Table on APAC - Market size and forecast 2025-2030 ($ million)
Chart on APAC - Year-over-year growth 2025-2030 (%)
Data Table on APAC - Year-over-year growth 2025-2030 (%)
Chart on Regional Comparison - APAC
Data Table on Regional Comparison - APAC

12.5.1 Japan - Market size and forecast 2025-2030

Chart on Japan - Market size and forecast 2025-2030 ($ million)
Data Table on Japan - Market size and forecast 2025-2030 ($ million)
Chart on Japan - Year-over-year growth 2025-2030 (%)
Data Table on Japan - Year-over-year growth 2025-2030 (%)

12.5.2 China - Market size and forecast 2025-2030

Chart on China - Market size and forecast 2025-2030 ($ million)
Data Table on China - Market size and forecast 2025-2030 ($ million)
Chart on China - Year-over-year growth 2025-2030 (%)
Data Table on China - Year-over-year growth 2025-2030 (%)

12.5.3 Australia - Market size and forecast 2025-2030

Chart on Australia - Market size and forecast 2025-2030 ($ million)
Data Table on Australia - Market size and forecast 2025-2030 ($ million)
Chart on Australia - Year-over-year growth 2025-2030 (%)
Data Table on Australia - Year-over-year growth 2025-2030 (%)

12.5.4 South Korea - Market size and forecast 2025-2030

Chart on South Korea - Market size and forecast 2025-2030 ($ million)
Data Table on South Korea - Market size and forecast 2025-2030 ($ million)
Chart on South Korea - Year-over-year growth 2025-2030 (%)
Data Table on South Korea - Year-over-year growth 2025-2030 (%)

12.5.5 India - Market size and forecast 2025-2030

Chart on India - Market size and forecast 2025-2030 ($ million)
Data Table on India - Market size and forecast 2025-2030 ($ million)
Chart on India - Year-over-year growth 2025-2030 (%)
Data Table on India - Year-over-year growth 2025-2030 (%)

12.5.6 Indonesia - Market size and forecast 2025-2030

Chart on Indonesia - Market size and forecast 2025-2030 ($ million)
Data Table on Indonesia - Market size and forecast 2025-2030 ($ million)
Chart on Indonesia - Year-over-year growth 2025-2030 (%)
Data Table on Indonesia - Year-over-year growth 2025-2030 (%)

12.6 South America - Market size and forecast 2025-2030

Chart on South America - Market size and forecast 2025-2030 ($ million)
Data Table on South America - Market size and forecast 2025-2030 ($ million)
Chart on South America - Year-over-year growth 2025-2030 (%)
Data Table on South America - Year-over-year growth 2025-2030 (%)
Chart on Regional Comparison - South America
Data Table on Regional Comparison - South America

12.6.1 Brazil - Market size and forecast 2025-2030

Chart on Brazil - Market size and forecast 2025-2030 ($ million)
Data Table on Brazil - Market size and forecast 2025-2030 ($ million)
Chart on Brazil - Year-over-year growth 2025-2030 (%)
Data Table on Brazil - Year-over-year growth 2025-2030 (%)

12.6.2 Argentina - Market size and forecast 2025-2030

Chart on Argentina - Market size and forecast 2025-2030 ($ million)
Data Table on Argentina - Market size and forecast 2025-2030 ($ million)
Chart on Argentina - Year-over-year growth 2025-2030 (%)
Data Table on Argentina - Year-over-year growth 2025-2030 (%)

12.6.3 Chile - Market size and forecast 2025-2030

Chart on Chile - Market size and forecast 2025-2030 ($ million)
Data Table on Chile - Market size and forecast 2025-2030 ($ million)
Chart on Chile - Year-over-year growth 2025-2030 (%)
Data Table on Chile - Year-over-year growth 2025-2030 (%)

12.7 Middle East and Africa - Market size and forecast 2025-2030

Chart on Middle East and Africa - Market size and forecast 2025-2030 ($ million)
Data Table on Middle East and Africa - Market size and forecast 2025-2030 ($ million)
Chart on Middle East and Africa - Year-over-year growth 2025-2030 (%)
Data Table on Middle East and Africa - Year-over-year growth 2025-2030 (%)
Chart on Regional Comparison - Middle East and Africa
Data Table on Regional Comparison - Middle East and Africa

12.7.1 South Africa - Market size and forecast 2025-2030

Chart on South Africa - Market size and forecast 2025-2030 ($ million)
Data Table on South Africa - Market size and forecast 2025-2030 ($ million)
Chart on South Africa - Year-over-year growth 2025-2030 (%)
Data Table on South Africa - Year-over-year growth 2025-2030 (%)

12.7.2 Saudi Arabia - Market size and forecast 2025-2030

Chart on Saudi Arabia - Market size and forecast 2025-2030 ($ million)
Data Table on Saudi Arabia - Market size and forecast 2025-2030 ($ million)
Chart on Saudi Arabia - Year-over-year growth 2025-2030 (%)
Data Table on Saudi Arabia - Year-over-year growth 2025-2030 (%)

12.7.3 UAE - Market size and forecast 2025-2030

Chart on UAE - Market size and forecast 2025-2030 ($ million)
Data Table on UAE - Market size and forecast 2025-2030 ($ million)
Chart on UAE - Year-over-year growth 2025-2030 (%)
Data Table on UAE - Year-over-year growth 2025-2030 (%)

12.7.4 Egypt - Market size and forecast 2025-2030

Chart on Egypt - Market size and forecast 2025-2030 ($ million)
Data Table on Egypt - Market size and forecast 2025-2030 ($ million)
Chart on Egypt - Year-over-year growth 2025-2030 (%)
Data Table on Egypt - Year-over-year growth 2025-2030 (%)

12.7.5 Turkey - Market size and forecast 2025-2030

Chart on Turkey - Market size and forecast 2025-2030 ($ million)
Data Table on Turkey - Market size and forecast 2025-2030 ($ million)
Chart on Turkey - Year-over-year growth 2025-2030 (%)
Data Table on Turkey - Year-over-year growth 2025-2030 (%)

12.8 Market opportunity by geography

Market opportunity by geography ($ million)
Data Tables on Market opportunity by geography ($ million)

13. Drivers, Challenges, and Opportunity

13.1 Market drivers

Increasing consumer education and destigmatization of menstrual health
Technological advancements and product innovation in material science
Urbanization and rising participation of women in global workforce

13.2 Market challenges

Environmental sustainability and proliferation of eco-conscious alternatives
Heightened regulatory scrutiny and requirements for ingredient transparency
Economic volatility and complexity of global supply chain logistics

13.3 Impact of drivers and challenges

Impact of drivers and challenges in 2025 and 2030

13.4 Market opportunities

Transition toward sustainable and bio-based material compositions
Proliferation of D2C channels and subscription-based commerce
Holistic health integration and advanced product ergonomics

14. Competitive Landscape

14.1 Overview

14.2

Overview on criticality of inputs and factors of differentiation

14.3 Landscape disruption

Overview on factors of disruption

14.4 Industry risks

Impact of key risks on business

15. Competitive Analysis

15.1 Companies profiled

Companies covered

15.2 Company ranking index

15.3 Market positioning of companies

Matrix on companies position and classification

15.4 Albaad Massuot Yitzhak Ltd.

Albaad Massuot Yitzhak Ltd. - Overview
Albaad Massuot Yitzhak Ltd. - Product / Service
Albaad Massuot Yitzhak Ltd. - Key offerings
SWOT

15.5 Cora

Cora - Overview
Cora - Product / Service
Cora - Key offerings
SWOT

15.6 Corman S.p.A.

Corman S.p.A. - Overview
Corman S.p.A. - Product / Service
Corman S.p.A. - Key offerings
SWOT

15.7 COTTON HIGH TECH SL

COTTON HIGH TECH SL - Overview
COTTON HIGH TECH SL - Product / Service
COTTON HIGH TECH SL - Key offerings
SWOT

15.8 Edgewell Personal Care Co.

Edgewell Personal Care Co. - Overview
Edgewell Personal Care Co. - Business segments
Edgewell Personal Care Co. - Key offerings
Edgewell Personal Care Co. - Segment focus
SWOT

15.9 Essity AB

Essity AB - Overview
Essity AB - Business segments
Essity AB - Key news
Essity AB - Key offerings
Essity AB - Segment focus
SWOT

15.10 Here We Flo Ltd.

Here We Flo Ltd. - Overview
Here We Flo Ltd. - Product / Service
Here We Flo Ltd. - Key offerings
SWOT

15.11 Kao Corp.

Kao Corp. - Overview
Kao Corp. - Business segments
Kao Corp. - Key news
Kao Corp. - Key offerings
Kao Corp. - Segment focus
SWOT

15.12 Kimberly Clark Corp.

Kimberly Clark Corp. - Overview
Kimberly Clark Corp. - Business segments
Kimberly Clark Corp. - Key news
Kimberly Clark Corp. - Key offerings
Kimberly Clark Corp. - Segment focus
SWOT

15.13 Ontex BV

Ontex BV - Overview
Ontex BV - Business segments
Ontex BV - Key offerings
Ontex BV - Segment focus
SWOT

15.14 Premier FMCG Pty. Ltd.

Premier FMCG Pty. Ltd. - Overview
Premier FMCG Pty. Ltd. - Product / Service
Premier FMCG Pty. Ltd. - Key offerings
SWOT

15.15 Procter and Gamble Co.

Procter and Gamble Co. - Overview
Procter and Gamble Co. - Business segments
Procter and Gamble Co. - Key news
Procter and Gamble Co. - Key offerings
Procter and Gamble Co. - Segment focus
SWOT

15.16 Rael Inc.

Rael Inc. - Overview
Rael Inc. - Product / Service
Rael Inc. - Key offerings
SWOT

15.17 The Honest Co. Inc.

The Honest Co. Inc. - Overview
The Honest Co. Inc. - Business segments
The Honest Co. Inc. - Key offerings
The Honest Co. Inc. - Segment focus
SWOT

15.18 TZMO SA

TZMO SA - Overview
TZMO SA - Product / Service
TZMO SA - Key offerings
SWOT

16. Appendix

16.1 Scope of the report

Market definition
Objectives
Notes and caveats

16.2 Inclusions and exclusions checklist

Inclusions checklist
Exclusions checklist

16.3 Currency conversion rates for US$

16.4 Research methodology

16.5 Data procurement

Information sources

16.6 Data validation

16.7 Validation techniques employed for market sizing

16.8 Data synthesis

16.9 360 degree market analysis

16.10 List of abbreviations

Research Methodology

Technavio presents a detailed picture of the market by way of study, synthesis, and summation of data from multiple sources. The analysts have presented the various facets of the market with a particular focus on identifying the key industry influencers. The data thus presented is comprehensive, reliable, and the result of extensive research, both primary and secondary.

INFORMATION SOURCES

Primary sources

  • Manufacturers and suppliers
  • Channel partners
  • Industry experts
  • Strategic decision makers

Secondary sources

  • Industry journals and periodicals
  • Government data
  • Financial reports of key industry players
  • Historical data
  • Press releases

DATA ANALYSIS

Data Synthesis

  • Collation of data
  • Estimation of key figures
  • Analysis of derived insights

Data Validation

  • Triangulation with data models
  • Reference against proprietary databases
  • Corroboration with industry experts

REPORT WRITING

Qualitative

  • Market drivers
  • Market challenges
  • Market trends
  • Five forces analysis

Quantitative

  • Market size and forecast
  • Market segmentation
  • Geographical insights
  • Competitive landscape

Interested in this report?

Get your sample now to see our research methodology and insights!

Download Now

Frequently Asked Questions

Tampon market growth will increase by USD 1592.5 million during 2026-2030.

The Tampon market is expected to grow at a CAGR of 4.4% during 2026-2030.

Tampon market is segmented by Distribution channel (Offline, Online) Type (Applicator tampons, Non-applicator tampons) Material (Blended, Cotton, Rayon)

Albaad Massuot Yitzhak Ltd., Bodywise Ltd., Cora, Corman S.p.A., COTTON HIGH TECH SL, Daye Ltd., Edgewell Personal Care Co., Essity AB, FIP Organic B.V., Here We Flo Ltd., Kao Corp., Kimberly Clark Corp., Maxim Hygiene Products Inc., Ontex BV, Premier FMCG Pty. Ltd., Procter and Gamble Co., Quanzhou Tayue Sanitary Products, Rael Inc., The Honest Co. Inc., TZMO SA are a few of the key vendors in the Tampon market.

North America will register the highest growth rate of 38.6% among the other regions. Therefore, the Tampon market in North America is expected to garner significant business opportunities for the vendors during the forecast period.

US, Canada, Mexico, Germany, UK, France, Italy, Russia, The Netherlands, Japan, China, Australia, South Korea, India, Indonesia, Brazil, Argentina, Chile, South Africa, Saudi Arabia, UAE, Egypt, Turkey

  • Increasing consumer education and destigmatization of menstrual health is the driving factor this market.

The Tampon market vendors should focus on grabbing business opportunities from the Distribution channel segment as it accounted for the largest market share in the base year.
RIA - Research AI Assistant
Ask RIA
