Ticket Market Analysis, Size, and Forecast 2026-2030: North America (US, Canada, and Mexico), Europe (Germany, UK, and France), APAC (China, India, and Japan), South America (Brazil and Argentina), Middle East and Africa (Saudi Arabia, UAE, and South Africa), and Rest of World (ROW)

Ticket Market Analysis, Size, and Forecast 2026-2030:
North America (US, Canada, and Mexico), Europe (Germany, UK, and France), APAC (China, India, and Japan), South America (Brazil and Argentina), Middle East and Africa (Saudi Arabia, UAE, and South Africa), and Rest of World (ROW)

Published: Apr 2026 287 Pages SKU: IRTNTR40014

Market Overview at a Glance

$702.99 B
Market Opportunity
30%
CAGR 2025 - 2030
36.5%
North America Growth
$158.81 B
Primary segment 2024

Ticket Market Size 2026-2030

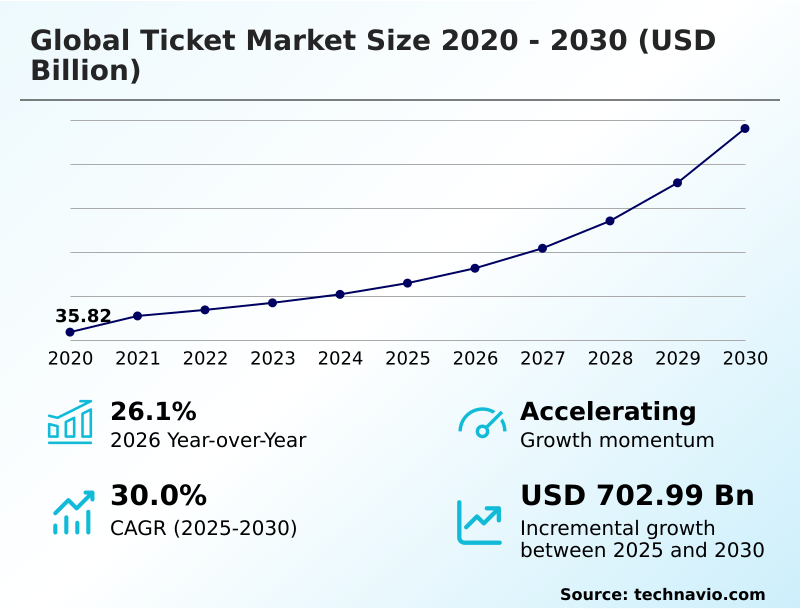
The ticket market size is valued to increase by USD 702.99 billion, at a CAGR of 30% from 2025 to 2030. Elevation of experience economy and shifting consumer spending priorities will drive the ticket market.

Major Market Trends & Insights

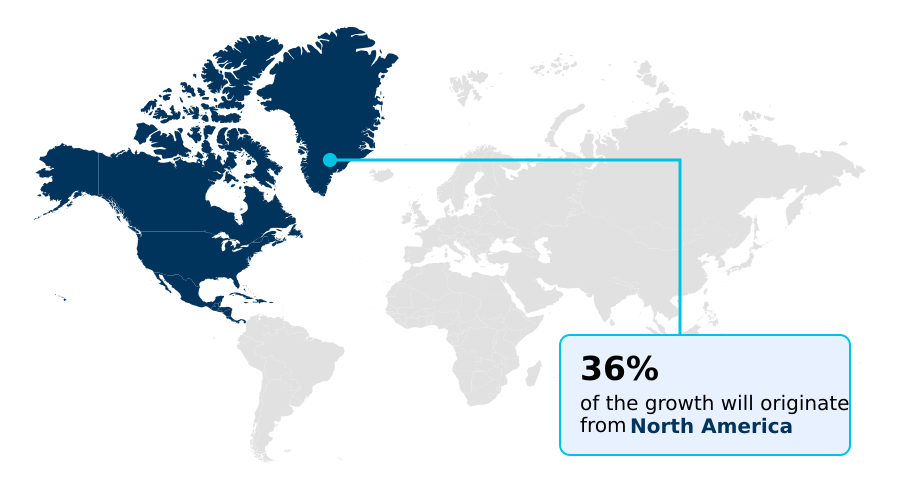
  • North America dominated the market and accounted for a 36.5% growth during the forecast period.
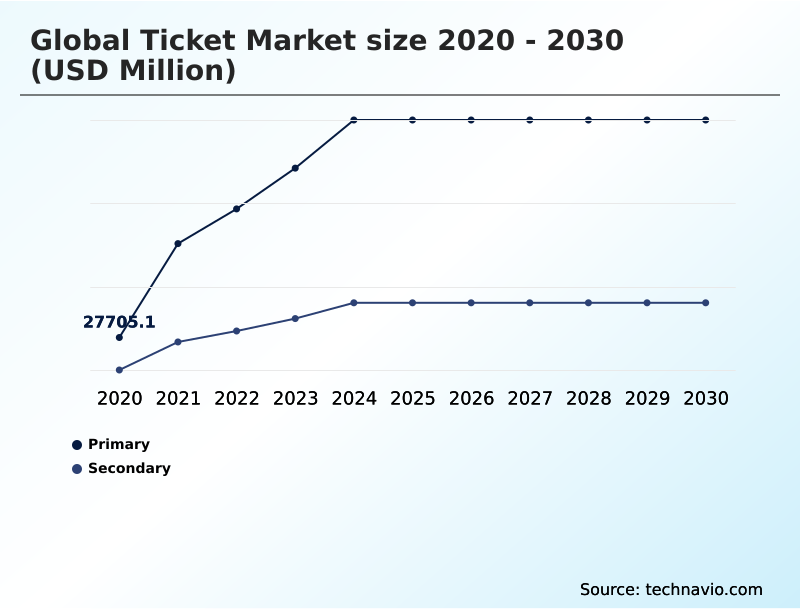
  • By Source - Primary segment was valued at USD 158.81 billion in 2024
  • By Type - Sporting events segment accounted for the largest market revenue share in 2024

Market Size & Forecast

  • Market Opportunities: USD 925.69 billion
  • Market Future Opportunities: USD 702.99 billion
  • CAGR from 2025 to 2030 : 30%

Market Summary

  • The ticket market is undergoing a significant transformation driven by technological innovation and evolving consumer expectations. Core to this shift is the move from physical vouchers to secure digital assets, managed through sophisticated event management software and online ticketing platforms. This digital transition enables advanced live event revenue management and operational efficiencies.
  • A key driver is the consumer-led demand for seamless experiences, compelling providers to adopt mobile wallet integration and contactless entry systems. For instance, a major sports league can leverage a customer data platform to offer personalized promotions and upgrade opportunities in real time, enhancing the fan experience and maximizing per-attendee revenue.
  • However, this digitalization brings challenges, including the need for robust bot mitigation technology to ensure fair primary ticket sales and prevent inventory exhaustion. The industry is also shaped by the expansion of secondary segment platforms, which, while providing liquidity, introduce complexities around pricing and regulation that organizers must navigate.
  • The market continues to evolve toward a more data-centric and fan-focused model.

What will be the Size of the Ticket Market during the forecast period?

Get Key Insights on Market Forecast (PDF) Request Free Sample

How is the Ticket Market Segmented?

The ticket industry research report provides comprehensive data (region-wise segment analysis), with forecasts and estimates in "USD million" for the period 2026-2030, as well as historical data from 2020-2024 for the following segments.

  • Source
    • Primary
    • Secondary
  • Type
    • Sporting events
    • Movies
    • Concerts
    • Performing arts
  • Distribution channel
    • Online
    • Offline
  • Geography
    • North America
      • US
      • Canada
      • Mexico
    • Europe
      • Germany
      • UK
      • France
    • APAC
      • China
      • India
      • Japan
    • South America
      • Brazil
      • Argentina
    • Middle East and Africa
      • Saudi Arabia
      • UAE
      • South Africa
    • Rest of World (ROW)

By Source Insights

The primary segment is estimated to witness significant growth during the forecast period.

The primary segment is the foundational layer of the ticket market, covering the initial, officially sanctioned sale of tickets. This domain has evolved beyond static pricing, with event organizers now using dynamic pricing algorithms and API-driven ticketing to manage sales.

The transition to digital ticketing is nearly complete, with mobile-first ticketing and secure ticket tokenization becoming standard, enhancing data-driven fan engagement.

This digital shift, with digital adoption surpassing 74% in some developed regions, offers benefits like reduced fraud and the capture of valuable consumer data for customer relationship management.

Operators utilize tiered presale access and invest in bot mitigation technology to ensure fair access and protect the integrity of the primary sales channel integrity. Centralized booking engines and real-time sales tracking are now fundamental.

However, challenges in attendee identity verification persist.

Request Free Sample

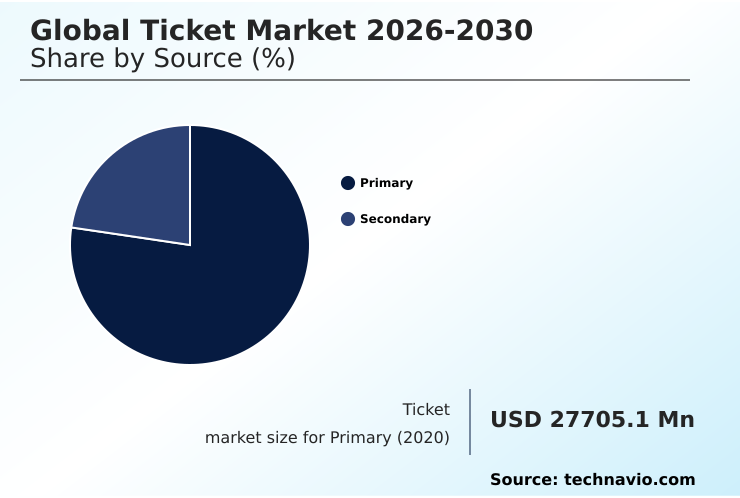
The Primary segment was valued at USD 158.81 billion in 2024 and showed a gradual increase during the forecast period.

Request Free Sample

Regional Analysis

North America is estimated to contribute 36.5% to the growth of the global market during the forecast period.Technavio’s analysts have elaborately explained the regional trends and drivers that shape the market during the forecast period.

See How Ticket Market Demand is Rising in North America Request Free Sample

The geographic landscape of the ticket market is characterized by varying levels of digital maturity and regulatory focus.

In North America and Europe, where digital ticket adoption has surpassed 70%, the focus is on refining the user experience with loyalty program integration and advanced customer relationship management. These regions see high adoption of box office management software.

In contrast, the APAC region is defined by the dominance of super-apps, which integrate event discovery platforms and demand forecasting models for a seamless user journey.

South America is seeing rapid growth in online ticketing platforms, though it requires flexible payment options.

The Middle East is a key growth area, driven by government investment in state-of-the-art venues that require sophisticated access control hardware and biometric verification systems. This global diversification necessitates adaptable multi-channel distribution strategies.

Attendee registration systems and seamless payment processing are becoming global standards.

Market Dynamics

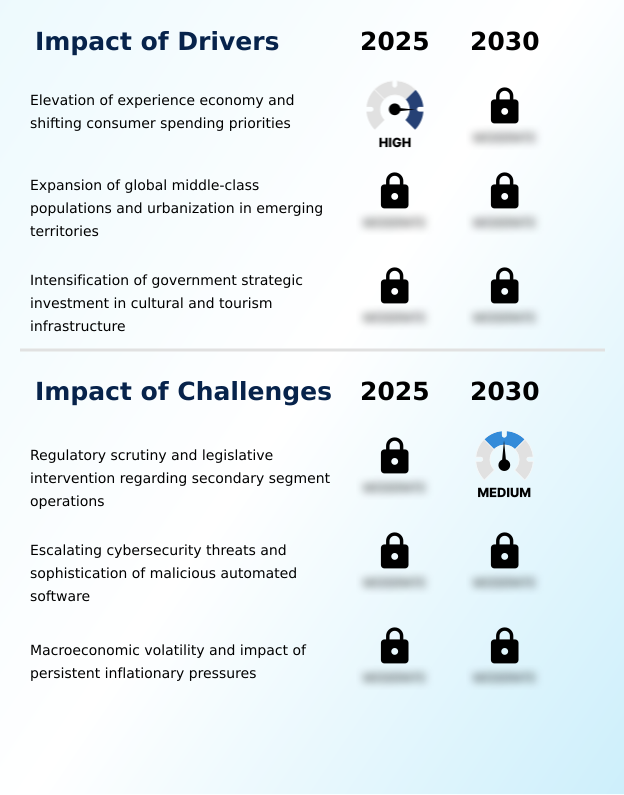
Our researchers analyzed the data with 2025 as the base year, along with the key drivers, trends, and challenges. A holistic analysis of drivers will help companies refine their marketing strategies to gain a competitive advantage.

  • The future of the ticket market is being shaped by the convergence of several advanced technologies aimed at solving long-standing industry challenges. A key area of innovation is integrating ticketing with super-app ecosystems, particularly in rapidly growing mobile-first economies.
  • For security and transparency, many are turning to blockchain technology for secondary ticket markets, which can virtually eliminate fraud and give organizers control over resale terms. Parallel to this is the use of AI-powered dynamic pricing for sporting events, which optimizes revenue by adjusting prices based on real-time variables.
  • This data-centric approach extends to using data analytics to predict event sell-outs. To enhance fan engagement with NFT collectibles, the ticket itself is becoming a digital asset, unlocking exclusive content and experiences. A major operational focus is on cybersecurity measures for online ticketing platforms and developing effective bot mitigation strategies for high-demand onsales to ensure fair access.
  • The user experience is also being improved, with mobile wallet integration for contactless venue entry and biometric verification to reduce ticket fraud becoming more common. The industry is also addressing consumer concerns through the impact of all-in pricing on consumer behavior and by implementing flexible payment options for tickets.
  • For promoters, yield management techniques for concert tours and managing ticket inventory for music festivals are being refined through better software and analytics. The role of CRM in performing arts subscriptions and the rise of subscription-based models for cinema ticketing show a move toward building long-term customer relationships.
  • Technologically, API integrations for third-party ticket distribution are expanding reach, while a focus on improving user experience on ticket resale platforms and leveraging social media for event discovery is crucial for growth.
  • Regulatory compliance for cross-border ticket resale remains a complex but critical area, with platforms using advanced analytics to measure ROI of digital marketing in ticketing, reporting improvements over 20% compared to traditional methods.

What are the key market drivers leading to the rise in the adoption of Ticket Industry?

  • A key driver for the market is the elevation of the experience economy, which is reflected in shifting consumer spending priorities toward live events and memorable engagements.

  • Market expansion is significantly propelled by the rise of the experience economy and the rapid growth of the middle class in developing regions, which has expanded the consumer base by over 30% in key emerging markets.
  • This demographic shift supports higher demand for event registration services and digital ticket marketplaces.
  • Concurrently, strategic government investments in cultural and tourism infrastructure, such as state-of-the-art arenas, have reduced operational barriers for promoters and improved the attendee experience, boosting ticket sales by an average of 15% for events in newly constructed venues.
  • This public sector support creates a stable environment for long-term planning, encouraging the adoption of modern technologies like subscription-based ticketing and advanced box office software solutions.
  • These factors collectively ensure a sustained upward trajectory for the industry, supported by a growing global appetite for live entertainment.

What are the market trends shaping the Ticket Industry?

  • The proliferation of mobile-first digital infrastructure is a defining market trend. This is complemented by the widespread adoption of contactless transactions for enhanced security and user convenience.

  • The ticket market is increasingly shaped by the adoption of mobile-first digital infrastructure and contactless transactions, with digital ticket adoption in some regions surpassing 74%. This trend is underpinned by the proliferation of NFT ticketing and blockchain-verified assets, which enhance security and enable new forms of fan engagement platforms.
  • AI is also a transformative force, with dynamic pricing algorithms optimizing revenue in real-time, leading to reported revenue increases of up to 20% for high-demand events. These systems rely on sophisticated demand forecasting models.
  • Furthermore, the evolution toward an ecosystem model where the ticket acts as a digital key is powered by loyalty program integration and peer-to-peer ticket exchange functionalities, fostering a continuous cycle of engagement that extends beyond the event itself, using both QR code verification and facial recognition entry.

What challenges does the Ticket Industry face during its growth?

  • A primary challenge affecting industry growth is the increasing regulatory scrutiny and legislative intervention aimed at governing secondary market operations and enhancing consumer transparency.

  • The ticket market confronts significant headwinds from escalating cybersecurity threats and heightened regulatory scrutiny. Sophisticated malicious bots can account for over 80% of traffic during high-demand on-sales, requiring substantial investment in advanced bot mitigation technology and anti-scalping software. This technological arms race increases operational costs by an estimated 15-20% for major platforms.
  • Concurrently, legislative mandates for all-in pricing models and transparent fee structures necessitate costly overhauls of back-end systems. Failure to comply with these regulations, alongside the constant threat of data breaches, poses a critical risk to both financial stability and consumer trust in the entire event ticketing ecosystem.
  • These challenges demand a focus on primary sales channel integrity and secure digital wallet assets, alongside proactive engagement with policymakers on the future of regulated resale markets.

Exclusive Technavio Analysis on Customer Landscape

The ticket market forecasting report includes the adoption lifecycle of the market, covering from the innovator’s stage to the laggard’s stage. It focuses on adoption rates in different regions based on penetration. Furthermore, the ticket market report also includes key purchase criteria and drivers of price sensitivity to help companies evaluate and develop their market growth analysis strategies.

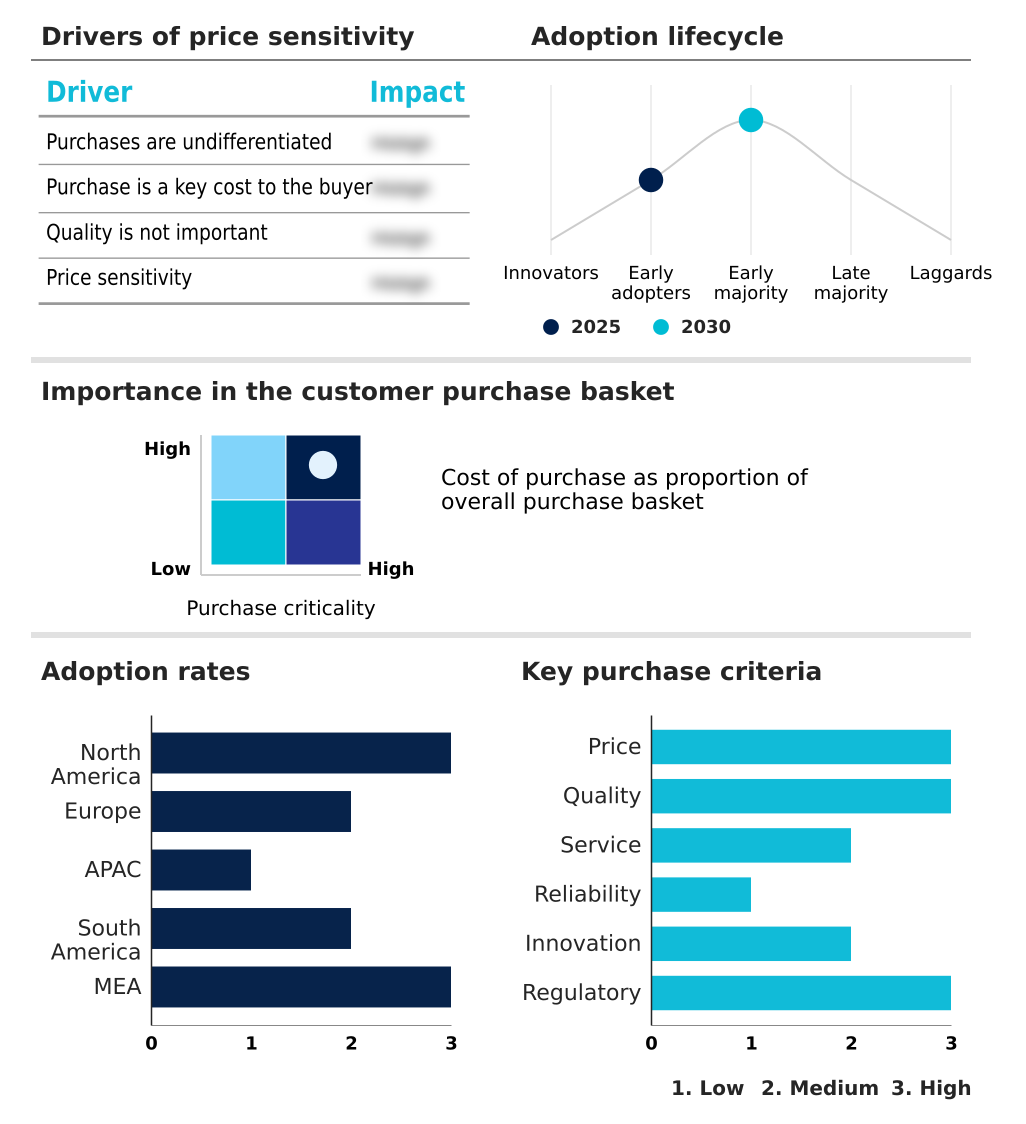
Customer Landscape of Ticket Industry

Competitive Landscape

Companies are implementing various strategies, such as strategic alliances, ticket market forecast, partnerships, mergers and acquisitions, geographical expansion, and product/service launches, to enhance their presence in the industry.

Acme Ticketing LLC - Offerings center on ticketing software and comprehensive venue ticketing solutions, addressing market demands for efficient event management and distribution.

The industry research and growth report includes detailed analyses of the competitive landscape of the market and information about key companies, including:

  • Acme Ticketing LLC
  • Active Network LLC
  • AXS Group LLC
  • Bizzabo Inc.
  • Etix Inc.
  • Eventzilla Corp.
  • Gateway Ticketing Systems Inc.
  • Globe Ticket and Label Company
  • National Ticket Company
  • Paciolan Inc.
  • RSVPify Inc.
  • Saffire LLC
  • SeatGeek Inc.
  • See Tickets
  • Spektrix Ltd.
  • ThunderTix Inc.
  • Ticket Tailor Ltd.
  • TicketLeap
  • Ticketmaster LLC
  • TicketSpice Inc.

Qualitative and quantitative analysis of companies has been conducted to help clients understand the wider business environment as well as the strengths and weaknesses of key industry players. Data is qualitatively analyzed to categorize companies as pure play, category-focused, industry-focused, and diversified; it is quantitatively analyzed to categorize companies as dominant, leading, strong, tentative, and weak.

Recent Development and News in Ticket market

  • In April, 2025, Mercado Libre announced a strategic partnership with Live Nation to introduce Mercado Fan, a novel service offering flexible, interest-free installment plans and optional event insurance for ticket purchases in Brazil, Argentina, and Mexico.
  • In March, 2025, European ticketing company CTS Eventim AG and Co. KGaA announced the acquisition of a prominent North American ticketing software company, signaling a strategic expansion and direct challenge to established players in the region.
  • In January, 2025, Zomato finalized its acquisition of Paytm's entertainment ticketing division, integrating event ticketing into its food delivery and restaurant discovery super-app to create a comprehensive lifestyle ecosystem.
  • In December, 2024, TickPick, a secondary ticket marketplace known for its all-in, no-fee pricing model, successfully secured a substantial Series C funding round to intensify competitive pressure on traditional ticketing platforms.

Dive into Technavio’s robust research methodology, blending expert interviews, extensive data synthesis, and validated models for unparalleled Ticket Market insights. See full methodology.

Market Scope
Page number 287
Base year 2025
Historic period 2020-2024
Forecast period 2026-2030
Growth momentum & CAGR Accelerate at a CAGR of 30%
Market growth 2026-2030 USD 702986.1 million
Market structure Fragmented
YoY growth 2025-2026(%) 26.1%
Key countries US, Canada, Mexico, Germany, UK, France, Italy, Spain, The Netherlands, China, India, Japan, South Korea, Australia, Indonesia, Brazil, Argentina, Chile, Saudi Arabia, UAE, South Africa, Turkey and Israel
Competitive landscape Leading Companies, Market Positioning of Companies, Competitive Strategies, and Industry Risks

Request Free Sample

Research Analyst Overview

  • The ticket market is defined by a rapid evolution toward highly integrated, data-centric operations. The industry's foundation is shifting from simple transaction processing to sophisticated data-driven fan engagement, powered by a suite of technologies. The adoption of mobile-first ticketing, coupled with mobile wallet integration, has become a baseline expectation, with digital ticket adoption surpassing 74% in mature markets.
  • This move enables the use of dynamic pricing algorithms and real-time inventory management, which are critical for maximizing revenue. For boardroom-level strategy, the most critical focus is on security and data integrity, addressed by technologies like blockchain-verified assets and robust fraud detection algorithms.
  • The implementation of bot mitigation technology is no longer optional but a required investment to maintain consumer trust. Furthermore, the integration of customer data platforms allows for unprecedented personalization, transforming the ticket from a mere proof of entry into a key component of a broader loyalty and engagement strategy.

What are the Key Data Covered in this Ticket Market Research and Growth Report?

  • What is the expected growth of the Ticket Market between 2026 and 2030?

    • USD 702.99 billion, at a CAGR of 30%

  • What segmentation does the market report cover?

    • The report is segmented by Source (Primary, and Secondary), Type (Sporting events, Movies, Concerts, and Performing arts), Distribution Channel (Online, and Offline) and Geography (North America, Europe, APAC, South America, Middle East and Africa)

  • Which regions are analyzed in the report?

    • North America, Europe, APAC, South America and Middle East and Africa

  • What are the key growth drivers and market challenges?

    • Elevation of experience economy and shifting consumer spending priorities, Regulatory scrutiny and legislative intervention regarding secondary segment operations

  • Who are the major players in the Ticket Market?

    • Acme Ticketing LLC, Active Network LLC, AXS Group LLC, Bizzabo Inc., Etix Inc., Eventzilla Corp., Gateway Ticketing Systems Inc., Globe Ticket and Label Company, National Ticket Company, Paciolan Inc., RSVPify Inc., Saffire LLC, SeatGeek Inc., See Tickets, Spektrix Ltd., ThunderTix Inc., Ticket Tailor Ltd., TicketLeap, Ticketmaster LLC and TicketSpice Inc.

Market Research Insights

  • The ticket market's dynamics are increasingly shaped by technological integration and data-driven strategies aimed at optimizing revenue and enhancing user experience. For example, the adoption of predictive analytics for events has improved demand forecasting accuracy by up to 25%, allowing for better inventory management.
  • The implementation of transparent fee structures, a direct response to regulatory pressures, has been shown to increase customer trust, improving checkout conversion rates by 10%. Furthermore, fan engagement platforms that integrate loyalty-driven ticketing models report a 15% higher rate of repeat purchases. This focus on audience segmentation strategies and personalized fan experiences is creating a more resilient and profitable ecosystem.
  • Navigating this landscape requires a sophisticated approach to omnichannel sales strategy and real-time inventory management.

We can help! Our analysts can customize this ticket market research report to meet your requirements.

Get in touch

1. Executive Summary

1.1 Market overview

Executive Summary - Chart on Market Overview
Executive Summary - Data Table on Market Overview
Executive Summary - Chart on Global Market Characteristics
Executive Summary - Chart on Market by Geography
Executive Summary - Chart on Market Segmentation by Source
Executive Summary - Chart on Market Segmentation by Type
Executive Summary - Chart on Market Segmentation by Distribution Channel
Executive Summary - Chart on Incremental Growth
Executive Summary - Data Table on Incremental Growth
Executive Summary - Chart on Company Market Positioning

2. Technavio Analysis

2.1 Analysis of price sensitivity, lifecycle, customer purchase basket, adoption rates, and purchase criteria

2.2 Criticality of inputs and Factors of differentiation

Chart on Overview on criticality of inputs and factors of differentiation

2.3 Factors of disruption

Chart on Overview on factors of disruption

2.4 Impact of drivers and challenges

Chart on Impact of drivers and challenges in 2025 and 2030

3. Market Landscape

3.1 Market ecosystem

Chart on Parent Market
Data Table on - Parent Market

3.2 Market characteristics

Chart on Market characteristics analysis

3.3 Value chain analysis

Chart on Value chain analysis

4. Market Sizing

4.1 Market definition

Data Table on Offerings of companies included in the market definition

4.2 Market segment analysis

Market segments

4.3 Market size 2025

4.4 Market outlook: Forecast for 2025-2030

Chart on Global - Market size and forecast 2025-2030 ($ million)
Data Table on Global - Market size and forecast 2025-2030 ($ million)
Chart on Global Market: Year-over-year growth 2025-2030 (%)
Data Table on Global Market: Year-over-year growth 2025-2030 (%)

5. Historic Market Size

5.1 Global Ticket Market 2020 - 2024

Historic Market Size - Data Table on Global Ticket Market 2020 - 2024 ($ million)

5.2 Source segment analysis 2020 - 2024

Historic Market Size - Source Segment 2020 - 2024 ($ million)

5.3 Type segment analysis 2020 - 2024

Historic Market Size - Type Segment 2020 - 2024 ($ million)

5.4 Distribution Channel segment analysis 2020 - 2024

Historic Market Size - Distribution Channel Segment 2020 - 2024 ($ million)

5.5 Geography segment analysis 2020 - 2024

Historic Market Size - Geography Segment 2020 - 2024 ($ million)

5.6 Country segment analysis 2020 - 2024

Historic Market Size - Country Segment 2020 - 2024 ($ million)

6. Qualitative Analysis

6.1 Impact of AI on global ticket market

6.2 Impact of geopolitical conflicts on global ticket market

7. Five Forces Analysis

7.1 Five forces summary

Five forces analysis - Comparison between 2025 and 2030

7.2 Bargaining power of buyers

Bargaining power of buyers - Impact of key factors 2025 and 2030

7.3 Bargaining power of suppliers

Bargaining power of suppliers - Impact of key factors in 2025 and 2030

7.4 Threat of new entrants

Threat of new entrants - Impact of key factors in 2025 and 2030

7.5 Threat of substitutes

Threat of substitutes - Impact of key factors in 2025 and 2030

7.6 Threat of rivalry

Threat of rivalry - Impact of key factors in 2025 and 2030

7.7 Market condition

Chart on Market condition - Five forces 2025 and 2030

8. Market Segmentation by Source

8.1 Market segments

Chart on Source - Market share 2025-2030 (%)
Data Table on Source - Market share 2025-2030 (%)

8.2 Comparison by Source

Chart on Comparison by Source
Data Table on Comparison by Source

8.3 Primary - Market size and forecast 2025-2030

Chart on Primary - Market size and forecast 2025-2030 ($ million)
Data Table on Primary - Market size and forecast 2025-2030 ($ million)
Chart on Primary - Year-over-year growth 2025-2030 (%)
Data Table on Primary - Year-over-year growth 2025-2030 (%)

8.4 Secondary - Market size and forecast 2025-2030

Chart on Secondary - Market size and forecast 2025-2030 ($ million)
Data Table on Secondary - Market size and forecast 2025-2030 ($ million)
Chart on Secondary - Year-over-year growth 2025-2030 (%)
Data Table on Secondary - Year-over-year growth 2025-2030 (%)

8.5 Market opportunity by Source

Market opportunity by Source ($ million)
Data Table on Market opportunity by Source ($ million)

9. Market Segmentation by Type

9.1 Market segments

Chart on Type - Market share 2025-2030 (%)
Data Table on Type - Market share 2025-2030 (%)

9.2 Comparison by Type

Chart on Comparison by Type
Data Table on Comparison by Type

9.3 Sporting events - Market size and forecast 2025-2030

Chart on Sporting events - Market size and forecast 2025-2030 ($ million)
Data Table on Sporting events - Market size and forecast 2025-2030 ($ million)
Chart on Sporting events - Year-over-year growth 2025-2030 (%)
Data Table on Sporting events - Year-over-year growth 2025-2030 (%)

9.4 Movies - Market size and forecast 2025-2030

Chart on Movies - Market size and forecast 2025-2030 ($ million)
Data Table on Movies - Market size and forecast 2025-2030 ($ million)
Chart on Movies - Year-over-year growth 2025-2030 (%)
Data Table on Movies - Year-over-year growth 2025-2030 (%)

9.5 Concerts - Market size and forecast 2025-2030

Chart on Concerts - Market size and forecast 2025-2030 ($ million)
Data Table on Concerts - Market size and forecast 2025-2030 ($ million)
Chart on Concerts - Year-over-year growth 2025-2030 (%)
Data Table on Concerts - Year-over-year growth 2025-2030 (%)

9.6 Performing arts - Market size and forecast 2025-2030

Chart on Performing arts - Market size and forecast 2025-2030 ($ million)
Data Table on Performing arts - Market size and forecast 2025-2030 ($ million)
Chart on Performing arts - Year-over-year growth 2025-2030 (%)
Data Table on Performing arts - Year-over-year growth 2025-2030 (%)

9.7 Market opportunity by Type

Market opportunity by Type ($ million)
Data Table on Market opportunity by Type ($ million)

10. Market Segmentation by Distribution Channel

10.1 Market segments

Chart on Distribution Channel - Market share 2025-2030 (%)
Data Table on Distribution Channel - Market share 2025-2030 (%)

10.2 Comparison by Distribution Channel

Chart on Comparison by Distribution Channel
Data Table on Comparison by Distribution Channel

10.3 Online - Market size and forecast 2025-2030

Chart on Online - Market size and forecast 2025-2030 ($ million)
Data Table on Online - Market size and forecast 2025-2030 ($ million)
Chart on Online - Year-over-year growth 2025-2030 (%)
Data Table on Online - Year-over-year growth 2025-2030 (%)

10.4 Offline - Market size and forecast 2025-2030

Chart on Offline - Market size and forecast 2025-2030 ($ million)
Data Table on Offline - Market size and forecast 2025-2030 ($ million)
Chart on Offline - Year-over-year growth 2025-2030 (%)
Data Table on Offline - Year-over-year growth 2025-2030 (%)

10.5 Market opportunity by Distribution Channel

Market opportunity by Distribution Channel ($ million)
Data Table on Market opportunity by Distribution Channel ($ million)

11. Customer Landscape

11.1 Customer landscape overview

Analysis of price sensitivity, lifecycle, customer purchase basket, adoption rates, and purchase criteria

12. Geographic Landscape

12.1 Geographic segmentation

Chart on Market share by geography 2025-2030 (%)
Data Table on Market share by geography 2025-2030 (%)

12.2 Geographic comparison

Chart on Geographic comparison
Data Table on Geographic comparison

12.3 North America - Market size and forecast 2025-2030

Chart on North America - Market size and forecast 2025-2030 ($ million)
Data Table on North America - Market size and forecast 2025-2030 ($ million)
Chart on North America - Year-over-year growth 2025-2030 (%)
Data Table on North America - Year-over-year growth 2025-2030 (%)
Chart on Regional Comparison - North America
Data Table on Regional Comparison - North America

12.3.1 US - Market size and forecast 2025-2030

Chart on US - Market size and forecast 2025-2030 ($ million)
Data Table on US - Market size and forecast 2025-2030 ($ million)
Chart on US - Year-over-year growth 2025-2030 (%)
Data Table on US - Year-over-year growth 2025-2030 (%)

12.3.2 Canada - Market size and forecast 2025-2030

Chart on Canada - Market size and forecast 2025-2030 ($ million)
Data Table on Canada - Market size and forecast 2025-2030 ($ million)
Chart on Canada - Year-over-year growth 2025-2030 (%)
Data Table on Canada - Year-over-year growth 2025-2030 (%)

12.3.3 Mexico - Market size and forecast 2025-2030

Chart on Mexico - Market size and forecast 2025-2030 ($ million)
Data Table on Mexico - Market size and forecast 2025-2030 ($ million)
Chart on Mexico - Year-over-year growth 2025-2030 (%)
Data Table on Mexico - Year-over-year growth 2025-2030 (%)

12.4 Europe - Market size and forecast 2025-2030

Chart on Europe - Market size and forecast 2025-2030 ($ million)
Data Table on Europe - Market size and forecast 2025-2030 ($ million)
Chart on Europe - Year-over-year growth 2025-2030 (%)
Data Table on Europe - Year-over-year growth 2025-2030 (%)
Chart on Regional Comparison - Europe
Data Table on Regional Comparison - Europe

12.4.1 Germany - Market size and forecast 2025-2030

Chart on Germany - Market size and forecast 2025-2030 ($ million)
Data Table on Germany - Market size and forecast 2025-2030 ($ million)
Chart on Germany - Year-over-year growth 2025-2030 (%)
Data Table on Germany - Year-over-year growth 2025-2030 (%)

12.4.2 UK - Market size and forecast 2025-2030

Chart on UK - Market size and forecast 2025-2030 ($ million)
Data Table on UK - Market size and forecast 2025-2030 ($ million)
Chart on UK - Year-over-year growth 2025-2030 (%)
Data Table on UK - Year-over-year growth 2025-2030 (%)

12.4.3 France - Market size and forecast 2025-2030

Chart on France - Market size and forecast 2025-2030 ($ million)
Data Table on France - Market size and forecast 2025-2030 ($ million)
Chart on France - Year-over-year growth 2025-2030 (%)
Data Table on France - Year-over-year growth 2025-2030 (%)

12.4.4 Italy - Market size and forecast 2025-2030

Chart on Italy - Market size and forecast 2025-2030 ($ million)
Data Table on Italy - Market size and forecast 2025-2030 ($ million)
Chart on Italy - Year-over-year growth 2025-2030 (%)
Data Table on Italy - Year-over-year growth 2025-2030 (%)

12.4.5 Spain - Market size and forecast 2025-2030

Chart on Spain - Market size and forecast 2025-2030 ($ million)
Data Table on Spain - Market size and forecast 2025-2030 ($ million)
Chart on Spain - Year-over-year growth 2025-2030 (%)
Data Table on Spain - Year-over-year growth 2025-2030 (%)

12.4.6 The Netherlands - Market size and forecast 2025-2030

Chart on The Netherlands - Market size and forecast 2025-2030 ($ million)
Data Table on The Netherlands - Market size and forecast 2025-2030 ($ million)
Chart on The Netherlands - Year-over-year growth 2025-2030 (%)
Data Table on The Netherlands - Year-over-year growth 2025-2030 (%)

12.5 APAC - Market size and forecast 2025-2030

Chart on APAC - Market size and forecast 2025-2030 ($ million)
Data Table on APAC - Market size and forecast 2025-2030 ($ million)
Chart on APAC - Year-over-year growth 2025-2030 (%)
Data Table on APAC - Year-over-year growth 2025-2030 (%)
Chart on Regional Comparison - APAC
Data Table on Regional Comparison - APAC

12.5.1 China - Market size and forecast 2025-2030

Chart on China - Market size and forecast 2025-2030 ($ million)
Data Table on China - Market size and forecast 2025-2030 ($ million)
Chart on China - Year-over-year growth 2025-2030 (%)
Data Table on China - Year-over-year growth 2025-2030 (%)

12.5.2 India - Market size and forecast 2025-2030

Chart on India - Market size and forecast 2025-2030 ($ million)
Data Table on India - Market size and forecast 2025-2030 ($ million)
Chart on India - Year-over-year growth 2025-2030 (%)
Data Table on India - Year-over-year growth 2025-2030 (%)

12.5.3 Japan - Market size and forecast 2025-2030

Chart on Japan - Market size and forecast 2025-2030 ($ million)
Data Table on Japan - Market size and forecast 2025-2030 ($ million)
Chart on Japan - Year-over-year growth 2025-2030 (%)
Data Table on Japan - Year-over-year growth 2025-2030 (%)

12.5.4 South Korea - Market size and forecast 2025-2030

Chart on South Korea - Market size and forecast 2025-2030 ($ million)
Data Table on South Korea - Market size and forecast 2025-2030 ($ million)
Chart on South Korea - Year-over-year growth 2025-2030 (%)
Data Table on South Korea - Year-over-year growth 2025-2030 (%)

12.5.5 Australia - Market size and forecast 2025-2030

Chart on Australia - Market size and forecast 2025-2030 ($ million)
Data Table on Australia - Market size and forecast 2025-2030 ($ million)
Chart on Australia - Year-over-year growth 2025-2030 (%)
Data Table on Australia - Year-over-year growth 2025-2030 (%)

12.5.6 Indonesia - Market size and forecast 2025-2030

Chart on Indonesia - Market size and forecast 2025-2030 ($ million)
Data Table on Indonesia - Market size and forecast 2025-2030 ($ million)
Chart on Indonesia - Year-over-year growth 2025-2030 (%)
Data Table on Indonesia - Year-over-year growth 2025-2030 (%)

12.6 South America - Market size and forecast 2025-2030

Chart on South America - Market size and forecast 2025-2030 ($ million)
Data Table on South America - Market size and forecast 2025-2030 ($ million)
Chart on South America - Year-over-year growth 2025-2030 (%)
Data Table on South America - Year-over-year growth 2025-2030 (%)
Chart on Regional Comparison - South America
Data Table on Regional Comparison - South America

12.6.1 Brazil - Market size and forecast 2025-2030

Chart on Brazil - Market size and forecast 2025-2030 ($ million)
Data Table on Brazil - Market size and forecast 2025-2030 ($ million)
Chart on Brazil - Year-over-year growth 2025-2030 (%)
Data Table on Brazil - Year-over-year growth 2025-2030 (%)

12.6.2 Argentina - Market size and forecast 2025-2030

Chart on Argentina - Market size and forecast 2025-2030 ($ million)
Data Table on Argentina - Market size and forecast 2025-2030 ($ million)
Chart on Argentina - Year-over-year growth 2025-2030 (%)
Data Table on Argentina - Year-over-year growth 2025-2030 (%)

12.6.3 Chile - Market size and forecast 2025-2030

Chart on Chile - Market size and forecast 2025-2030 ($ million)
Data Table on Chile - Market size and forecast 2025-2030 ($ million)
Chart on Chile - Year-over-year growth 2025-2030 (%)
Data Table on Chile - Year-over-year growth 2025-2030 (%)

12.7 Middle East and Africa - Market size and forecast 2025-2030

Chart on Middle East and Africa - Market size and forecast 2025-2030 ($ million)
Data Table on Middle East and Africa - Market size and forecast 2025-2030 ($ million)
Chart on Middle East and Africa - Year-over-year growth 2025-2030 (%)
Data Table on Middle East and Africa - Year-over-year growth 2025-2030 (%)
Chart on Regional Comparison - Middle East and Africa
Data Table on Regional Comparison - Middle East and Africa

12.7.1 Saudi Arabia - Market size and forecast 2025-2030

Chart on Saudi Arabia - Market size and forecast 2025-2030 ($ million)
Data Table on Saudi Arabia - Market size and forecast 2025-2030 ($ million)
Chart on Saudi Arabia - Year-over-year growth 2025-2030 (%)
Data Table on Saudi Arabia - Year-over-year growth 2025-2030 (%)

12.7.2 UAE - Market size and forecast 2025-2030

Chart on UAE - Market size and forecast 2025-2030 ($ million)
Data Table on UAE - Market size and forecast 2025-2030 ($ million)
Chart on UAE - Year-over-year growth 2025-2030 (%)
Data Table on UAE - Year-over-year growth 2025-2030 (%)

12.7.3 South Africa - Market size and forecast 2025-2030

Chart on South Africa - Market size and forecast 2025-2030 ($ million)
Data Table on South Africa - Market size and forecast 2025-2030 ($ million)
Chart on South Africa - Year-over-year growth 2025-2030 (%)
Data Table on South Africa - Year-over-year growth 2025-2030 (%)

12.7.4 Turkey - Market size and forecast 2025-2030

Chart on Turkey - Market size and forecast 2025-2030 ($ million)
Data Table on Turkey - Market size and forecast 2025-2030 ($ million)
Chart on Turkey - Year-over-year growth 2025-2030 (%)
Data Table on Turkey - Year-over-year growth 2025-2030 (%)

12.7.5 Israel - Market size and forecast 2025-2030

Chart on Israel - Market size and forecast 2025-2030 ($ million)
Data Table on Israel - Market size and forecast 2025-2030 ($ million)
Chart on Israel - Year-over-year growth 2025-2030 (%)
Data Table on Israel - Year-over-year growth 2025-2030 (%)

12.8 Market opportunity by geography

Market opportunity by geography ($ million)
Data Tables on Market opportunity by geography ($ million)

13. Drivers, Challenges, and Opportunity

13.1 Market drivers

Elevation of experience economy and shifting consumer spending priorities
Expansion of global middle-class populations and urbanization in emerging territories
Intensification of government strategic investment in cultural and tourism infrastructure

13.2 Market challenges

Regulatory scrutiny and legislative intervention regarding secondary segment operations
Escalating cybersecurity threats and sophistication of malicious automated software
Macroeconomic volatility and impact of persistent inflationary pressures

13.3 Impact of drivers and challenges

Impact of drivers and challenges in 2025 and 2030

13.4 Market opportunities

Proliferation of mobile-first digital infrastructure and contactless transactions
Implementation of artificial intelligence for dynamic pricing and demand forecasting
Expansion of enhanced fan engagement through blockchain and loyalty ecosystems

14. Competitive Landscape

14.1 Overview

14.2

Overview on criticality of inputs and factors of differentiation

14.3 Landscape disruption

Overview on factors of disruption

14.4 Industry risks

Impact of key risks on business

15. Competitive Analysis

15.1 Companies profiled

Companies covered

15.2 Company ranking index

15.3 Market positioning of companies

Matrix on companies position and classification

15.4 Acme Ticketing LLC

Acme Ticketing LLC - Overview
Acme Ticketing LLC - Product / Service
Acme Ticketing LLC - Key offerings
SWOT

15.5 Active Network LLC

Active Network LLC - Overview
Active Network LLC - Product / Service
Active Network LLC - Key offerings
SWOT

15.6 AXS Group LLC

AXS Group LLC - Overview
AXS Group LLC - Product / Service
AXS Group LLC - Key offerings
SWOT

15.7 Bizzabo Inc.

Bizzabo Inc. - Overview
Bizzabo Inc. - Product / Service
Bizzabo Inc. - Key offerings
SWOT

15.8 Etix Inc.

Etix Inc. - Overview
Etix Inc. - Product / Service
Etix Inc. - Key offerings
SWOT

15.9 Globe Ticket and Label Company

Globe Ticket and Label Company - Overview
Globe Ticket and Label Company - Product / Service
Globe Ticket and Label Company - Key offerings
SWOT

15.10 National Ticket Company

National Ticket Company - Overview
National Ticket Company - Product / Service
National Ticket Company - Key offerings
SWOT

15.11 Paciolan Inc.

Paciolan Inc. - Overview
Paciolan Inc. - Product / Service
Paciolan Inc. - Key offerings
SWOT

15.12 RSVPify Inc.

RSVPify Inc. - Overview
RSVPify Inc. - Product / Service
RSVPify Inc. - Key offerings
SWOT

15.13 Saffire LLC

Saffire LLC - Overview
Saffire LLC - Product / Service
Saffire LLC - Key offerings
SWOT

15.14 SeatGeek Inc.

SeatGeek Inc. - Overview
SeatGeek Inc. - Product / Service
SeatGeek Inc. - Key offerings
SWOT

15.15 See Tickets

See Tickets - Overview
See Tickets - Product / Service
See Tickets - Key offerings
SWOT

15.16 Spektrix Ltd.

Spektrix Ltd. - Overview
Spektrix Ltd. - Product / Service
Spektrix Ltd. - Key offerings
SWOT

15.17 ThunderTix Inc.

ThunderTix Inc. - Overview
ThunderTix Inc. - Product / Service
ThunderTix Inc. - Key offerings
SWOT

15.18 Ticketmaster LLC

Ticketmaster LLC - Overview
Ticketmaster LLC - Product / Service
Ticketmaster LLC - Key offerings
SWOT

16. Appendix

16.1 Scope of the report

Market definition
Objectives
Notes and caveats

16.2 Inclusions and exclusions checklist

Inclusions checklist
Exclusions checklist

16.3 Currency conversion rates for US$

16.4 Research methodology

16.5 Data procurement

Information sources

16.6 Data validation

16.7 Validation techniques employed for market sizing

16.8 Data synthesis

16.9 360 degree market analysis

16.10 List of abbreviations

Research Methodology

Technavio presents a detailed picture of the market by way of study, synthesis, and summation of data from multiple sources. The analysts have presented the various facets of the market with a particular focus on identifying the key industry influencers. The data thus presented is comprehensive, reliable, and the result of extensive research, both primary and secondary.

INFORMATION SOURCES

Primary sources

  • Manufacturers and suppliers
  • Channel partners
  • Industry experts
  • Strategic decision makers

Secondary sources

  • Industry journals and periodicals
  • Government data
  • Financial reports of key industry players
  • Historical data
  • Press releases

DATA ANALYSIS

Data Synthesis

  • Collation of data
  • Estimation of key figures
  • Analysis of derived insights

Data Validation

  • Triangulation with data models
  • Reference against proprietary databases
  • Corroboration with industry experts

REPORT WRITING

Qualitative

  • Market drivers
  • Market challenges
  • Market trends
  • Five forces analysis

Quantitative

  • Market size and forecast
  • Market segmentation
  • Geographical insights
  • Competitive landscape

Interested in this report?

Get your sample now to see our research methodology and insights!

Download Now

Frequently Asked Questions

Ticket market growth will increase by USD 702986.1 million during 2026-2030.

The Ticket market is expected to grow at a CAGR of 30% during 2026-2030.

Ticket market is segmented by Source (Primary, Secondary) Type (Sporting events, Movies, Concerts, Performing arts) Distribution channel (Online, Offline)

Acme Ticketing LLC, Active Network LLC, AXS Group LLC, Bizzabo Inc., Etix Inc., Eventzilla Corp., Gateway Ticketing Systems Inc., Globe Ticket and Label Company, National Ticket Company, Paciolan Inc., RSVPify Inc., Saffire LLC, SeatGeek Inc., See Tickets, Spektrix Ltd., ThunderTix Inc., Ticket Tailor Ltd., TicketLeap, Ticketmaster LLC, TicketSpice Inc. are a few of the key vendors in the Ticket market.

North America will register the highest growth rate of 36.5% among the other regions. Therefore, the Ticket market in North America is expected to garner significant business opportunities for the vendors during the forecast period.

US, Canada, Mexico, Germany, UK, France, Italy, Spain, The Netherlands, China, India, Japan, South Korea, Australia, Indonesia, Brazil, Argentina, Chile, Saudi Arabia, UAE, South Africa, Turkey, Israel

  • Elevation of experience economy and shifting consumer spending priorities is the driving factor this market.

The Ticket market vendors should focus on grabbing business opportunities from the Source segment as it accounted for the largest market share in the base year.
RIA - Research AI Assistant
Ask RIA