Tiny Homes Market Analysis, Size, and Forecast 2026-2030: North America (US, Canada, and Mexico), Europe (Germany, UK, and France), APAC (Japan, China, and India), South America (Brazil, Argentina, and Colombia), Middle East and Africa (UAE, Saudi Arabia, and South Africa), and Rest of World (ROW)

Tiny Homes Market Analysis, Size, and Forecast 2026-2030:
North America (US, Canada, and Mexico), Europe (Germany, UK, and France), APAC (Japan, China, and India), South America (Brazil, Argentina, and Colombia), Middle East and Africa (UAE, Saudi Arabia, and South Africa), and Rest of World (ROW)

Published: Apr 2026 285 Pages SKU: IRTNTR40810

Market Overview at a Glance

$4.67 B
Market Opportunity
4.8%
CAGR 2025 - 2030
51.7%
North America Growth
$11.12 B
Mobile tiny homes segment 2024

Tiny Homes Market Size 2026-2030

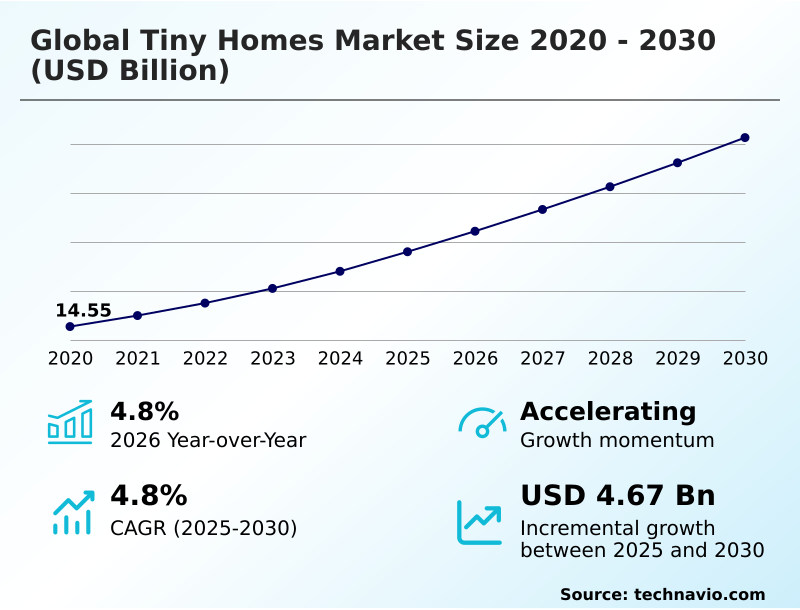
The tiny homes market size is valued to increase by USD 4.67 billion, at a CAGR of 4.8% from 2025 to 2030. Rising urban density and crisis of housing affordability will drive the tiny homes market.

Major Market Trends & Insights

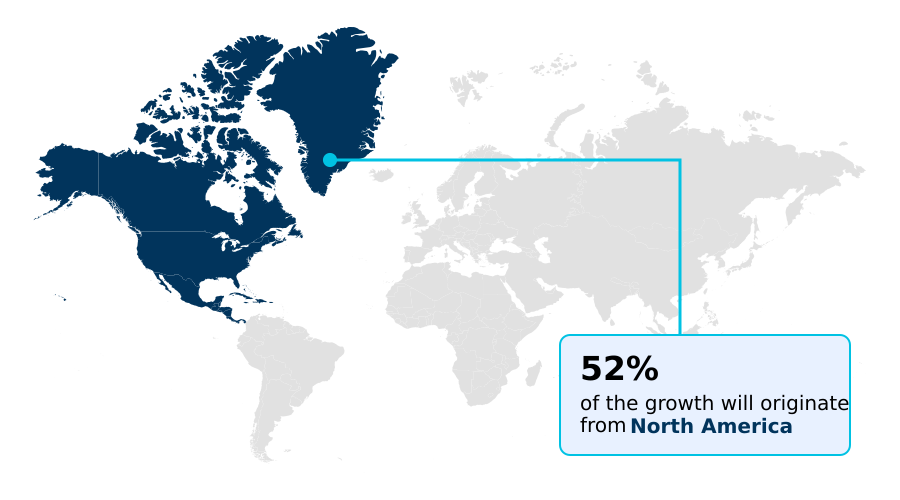
  • North America dominated the market and accounted for a 51.7% growth during the forecast period.
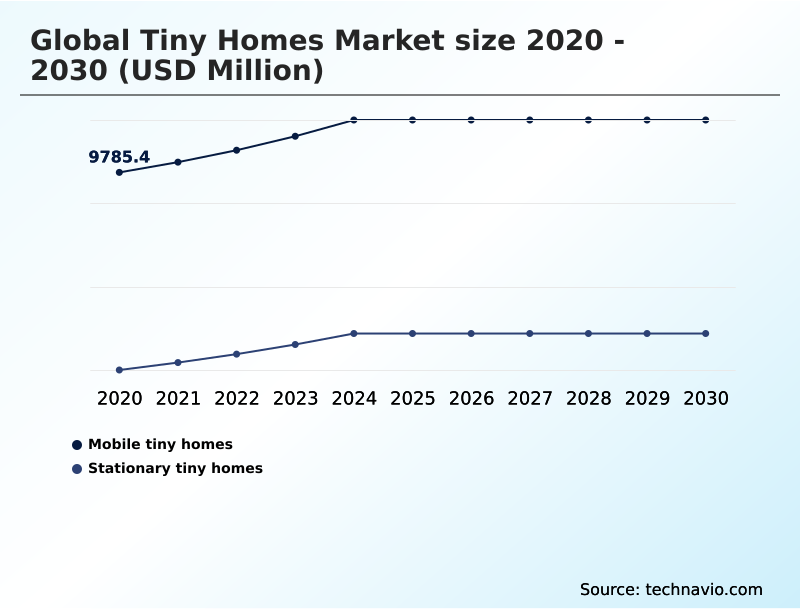
  • By Product - Mobile tiny homes segment was valued at USD 11.12 billion in 2024
  • By Application - Home use segment accounted for the largest market revenue share in 2024

Market Size & Forecast

  • Market Opportunities: USD 7.73 billion
  • Market Future Opportunities: USD 4.67 billion
  • CAGR from 2025 to 2030 : 4.8%

Market Summary

  • The tiny homes market is undergoing a significant transformation, driven by a convergence of economic, social, and technological factors. As housing affordability challenges persist in urban centers, these compact dwellings offer a viable alternative, promoting financial freedom and a minimalist living philosophy.
  • The industry is characterized by innovation in modular construction and prefabrication, which accelerates construction timelines and improves quality control. For instance, a developer focusing on urban infill projects can deploy a series of accessory dwelling units in a fraction of the time required for traditional construction, addressing housing shortages more efficiently.
  • Sustainability is also a core driver, with an increasing emphasis on energy efficiency, the use of recycled materials, and the integration of off-grid systems like solar power and rainwater harvesting. However, the market growth is tempered by challenges such as fragmented zoning regulations and difficulties in securing conventional financing.
  • As the sector matures, the focus is shifting toward creating professionalized tiny home communities with shared amenities, enhancing the appeal of this housing model for a broader demographic.

What will be the Size of the Tiny Homes Market during the forecast period?

Get Key Insights on Market Forecast (PDF) Request Free Sample

How is the Tiny Homes Market Segmented?

The tiny homes industry research report provides comprehensive data (region-wise segment analysis), with forecasts and estimates in "USD million" for the period 2026-2030, as well as historical data from 2020-2024 for the following segments.

  • Product
    • Mobile tiny homes
    • Stationary tiny homes
  • Application
    • Home use
    • Commercial use
  • Material
    • Wood
    • Metal
    • Recycled
  • Geography
    • North America
      • US
      • Canada
      • Mexico
    • Europe
      • Germany
      • UK
      • France
    • APAC
      • Japan
      • China
      • India
    • South America
      • Brazil
      • Argentina
      • Colombia
    • Middle East and Africa
      • UAE
      • Saudi Arabia
      • South Africa
    • Rest of World (ROW)

By Product Insights

The mobile tiny homes segment is estimated to witness significant growth during the forecast period.

The mobile tiny homes segment integrates residential comfort with vehicular mobility, constructed on a specialized trailer chassis to facilitate a nomad lifestyle. This market is driven by consumer demand for flexibility, allowing relocation to bypass permanent property taxes.

Engineering for these modular housing units balances weight distribution and structural integrity using lightweight materials. The regulatory landscape often aligns with recreational vehicle standards, which can simplify financing and insurance.

Design focuses on multi-functional spaces within micro-dwellings, a key aspect of minimalist living. The adoption of automated construction processes now enables a reduction in material waste by over 99%, a significant improvement in manufacturing efficiency.

This evolution showcases the shift towards high-performance materials and turnkey housing solutions, including stationary tiny homes and accessory dwelling units, which are enhanced by off-grid systems and solar integration.

Request Free Sample

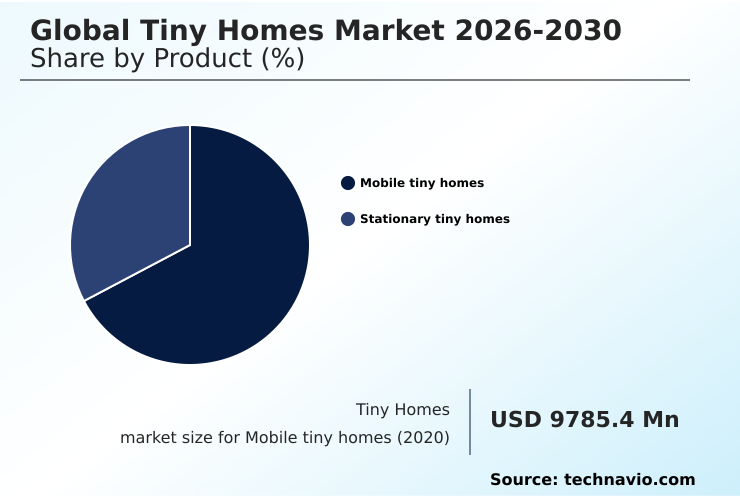
The Mobile tiny homes segment was valued at USD 11.12 billion in 2024 and showed a gradual increase during the forecast period.

Request Free Sample

Regional Analysis

North America is estimated to contribute 51.7% to the growth of the global market during the forecast period.Technavio’s analysts have elaborately explained the regional trends and drivers that shape the market during the forecast period.

See How Tiny Homes Market Demand is Rising in North America Request Free Sample

The geographic landscape of the tiny homes market is diverse, with North America representing over 51% of the market's incremental growth, driven by a mature manufacturing sector and evolving zoning compliance.

The region's focus is on scaling production for accessory dwelling unit applications and workforce housing.

In Europe, the market is defined by stringent green building standards and a push for energy efficiency, leading to innovations in low-carbon residential solutions and the use of carbon-sequestering materials.

The market in this region is expanding at a rate approximately 15% faster than in South America.

Meanwhile, the APAC region leverages its manufacturing capabilities for mass production of light-gauge steel frames and prefabricated homes, becoming a key supplier for global markets and addressing its own urban population density challenges.

This regional diversity creates distinct opportunities in social housing and eco-tourism.

Market Dynamics

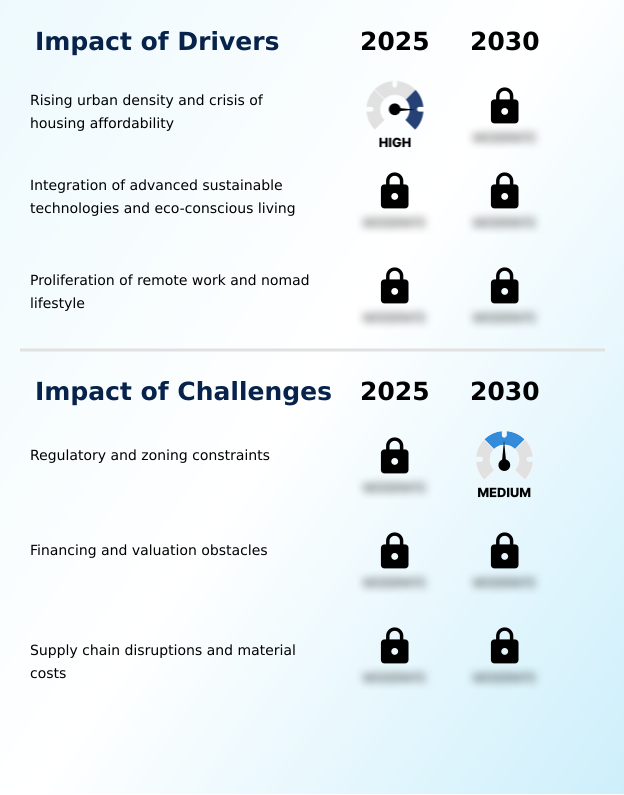
Our researchers analyzed the data with 2025 as the base year, along with the key drivers, trends, and challenges. A holistic analysis of drivers will help companies refine their marketing strategies to gain a competitive advantage.

  • The global discussion around housing is increasingly influenced by the rising urban density tiny homes market, which presents a practical solution to modern living challenges. A key focus is on sustainable technologies modern tiny homes integrate, moving beyond novelty to necessity.
  • However, the path to wider adoption is complicated by zoning regulations tiny home placement faces, creating a patchwork of legal landscapes. This directly impacts financing options for mobile tiny homes, as lenders assess risk based on legal permanence. Industry innovators are addressing this with prefabrication for affordable tiny housing, leveraging modular construction for rapid deployment.
  • This approach is ideal for enhancing off-grid capabilities for tiny home living, a feature demanded by consumers seeking autonomy. As a result, tiny home communities and shared amenities are being developed by institutional investment in tiny home villages. The financial viability of the market is influenced by material costs impacting tiny home prices and long-term valuation of tiny properties.
  • Technological advancements in tiny house design, including smart home technology integration in small spaces, are making these dwellings more appealing. These market trends for stationary vs mobile tiny homes are creating new opportunities, especially for tiny homes as accessory dwelling units.
  • Yet, builders still face supply chain challenges for tiny home builders, and buyers must navigate regulatory hurdles for tiny house owners. The movement is underpinned by a desire for eco-conscious living and minimalist lifestyle, which highlights the environmental benefits of compact living and drives architectural innovation in compact dwellings.
  • Firms adopting modular construction report build times up to 40% shorter than traditional methods, a critical advantage in operational planning.

What are the key market drivers leading to the rise in the adoption of Tiny Homes Industry?

  • Rising urban density, coupled with the crisis of housing affordability, serves as a key driver for the market.

  • The market is propelled by a convergence of economic and lifestyle shifts. The primary driver remains housing affordability, as rising urban population density makes traditional homeownership unattainable for many, promoting financial freedom.
  • This has led to a significant increase in demand for both stationary and mobile tiny homes, which offer high-quality living at a reduced cost. Environmental sustainability is another powerful driver, with a growing consumer base seeking an eco-conscious living.
  • This has spurred the development of homes with advanced off-grid capabilities, including solar integration and rainwater harvesting, which can lower utility expenses by up to 75%.
  • The proliferation of the remote workforce and the digital nomad lifestyle has also fueled demand for portable, high-tech living solutions.
  • Manufacturers are responding with turnkey housing solutions that include smart-home automation and robust connectivity, enabling a seamless work-from-anywhere experience and improving productivity by an estimated 15%.

What are the market trends shaping the Tiny Homes Industry?

  • The integration of technology and the advancement of automated construction processes are emerging as a significant market trend. This development is reshaping the industry from craft-based production to high-precision manufacturing.

  • Key market trends are centered on technological integration, sustainability, and the professionalization of the sector. The adoption of building information modeling and generative design allows for the creation of highly optimized micro-dwellings, while automated construction processes are enabling the mass production of foldable housing units with unprecedented speed. This industrialization is crucial for meeting the rising demand for social housing.
  • Concurrently, there is a strong push toward autonomous living systems, with new energy-positive tiny homes capable of generating more power than they consume. The use of carbon-sequestering materials like cross-laminated timber is becoming standard, reflecting the industry's commitment to the green building revolution. Innovations in this space have led to a 30% improvement in thermal efficiency.
  • The entry of institutional investment is leading to the rise of professionalized tiny home communities, which offer shared amenities and greater community support, transforming the market from a DIY movement to a scalable housing solution.

What challenges does the Tiny Homes Industry face during its growth?

  • Regulatory and zoning constraints present a key challenge affecting the industry's growth.

  • Despite strong drivers, the market faces significant hurdles that temper its growth trajectory. The most prominent challenge involves regulatory and zoning constraints, as many municipalities have not updated their building codes to accommodate non-stationary housing units or accessory dwelling units, creating persistent legal ambiguity.
  • This directly impacts financing and property valuation, as traditional lenders are often hesitant to provide mortgages for what they classify as recreational vehicles, leading to higher interest rates for buyers. Securing financing for these structures is reportedly 50% more difficult than for conventional homes. Furthermore, the industry is susceptible to supply chain disruptions and volatile material costs.
  • The reliance on specialized lightweight materials and components for prefabricated homes makes builders vulnerable to global trade fluctuations, which can lead to production delays and increased prices, impacting housing affordability. These operational and financial obstacles create a challenging environment for both builders and consumers.

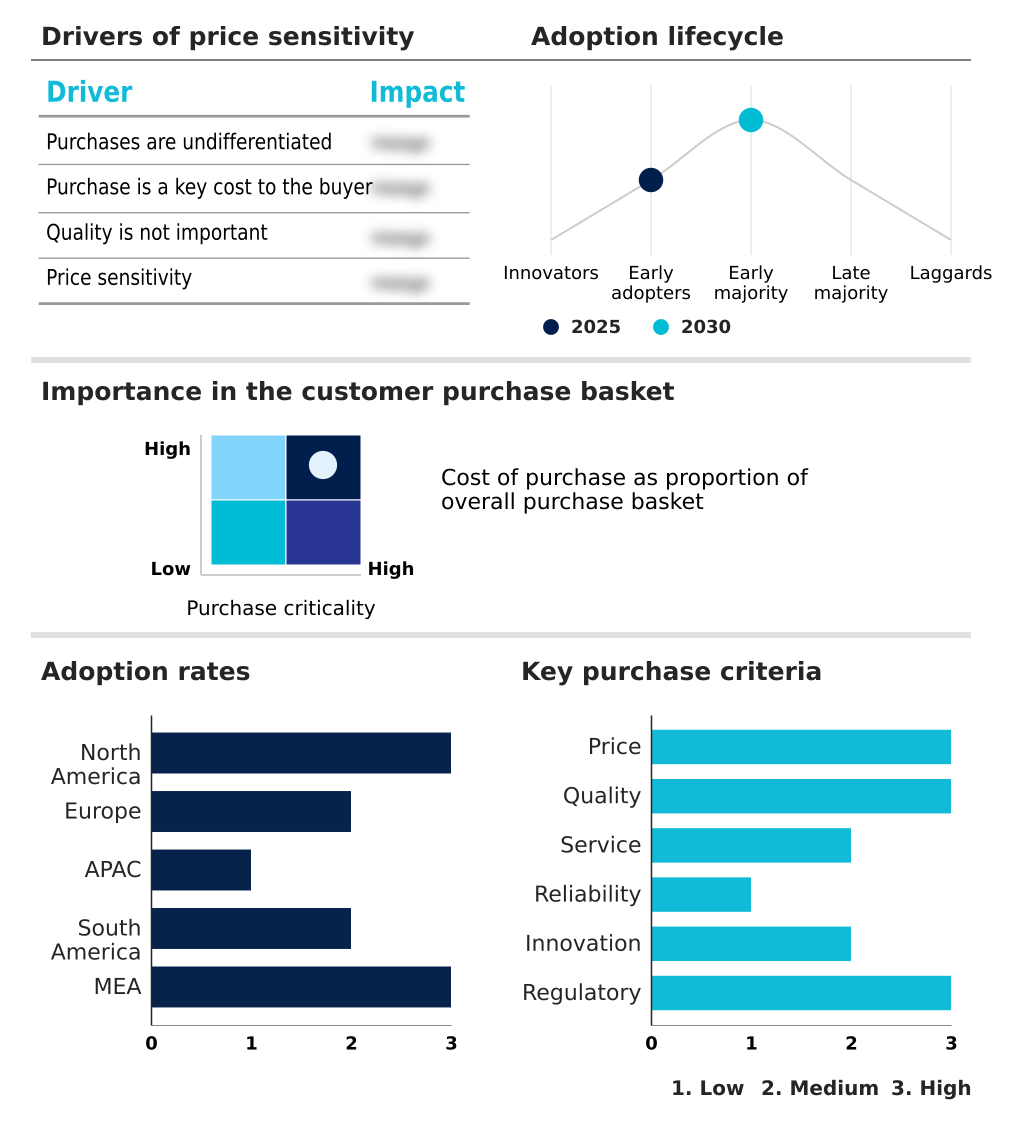
Exclusive Technavio Analysis on Customer Landscape

The tiny homes market forecasting report includes the adoption lifecycle of the market, covering from the innovator’s stage to the laggard’s stage. It focuses on adoption rates in different regions based on penetration. Furthermore, the tiny homes market report also includes key purchase criteria and drivers of price sensitivity to help companies evaluate and develop their market growth analysis strategies.

Customer Landscape of Tiny Homes Industry

Competitive Landscape

Companies are implementing various strategies, such as strategic alliances, tiny homes market forecast, partnerships, mergers and acquisitions, geographical expansion, and product/service launches, to enhance their presence in the industry.

Atlas Vans - Key offerings include factory-built prefab housing units and customizable modular houses emphasizing sustainability, efficient construction, and high-performance materials for diverse residential applications.

The industry research and growth report includes detailed analyses of the competitive landscape of the market and information about key companies, including:

  • Atlas Vans
  • Boxabl Inc.
  • CargoHome
  • Champion Homes Inc.
  • Clayton Homes Inc.
  • Connect Homes
  • Dvele Inc.
  • FabCab Inc
  • HUF HAUS GmbH and Co. KG
  • Kodasema OU
  • Manta North
  • Method Homes
  • Minimaliste Inc.
  • New Frontier Tiny Homes
  • Plant Prefab Inc.
  • The Backcountry Hut Co
  • Tiny SMART House Inc.
  • Tumbleweed Tiny House Co.
  • Vagabond Haven AB
  • WheelHaus

Qualitative and quantitative analysis of companies has been conducted to help clients understand the wider business environment as well as the strengths and weaknesses of key industry players. Data is qualitatively analyzed to categorize companies as pure play, category-focused, industry-focused, and diversified; it is quantitatively analyzed to categorize companies as dominant, leading, strong, tentative, and weak.

Recent Development and News in Tiny homes market

  • In February 2025, Boxabl commissioned a new production facility featuring fully automated assembly lines to produce foldable housing units every ninety minutes, significantly scaling its manufacturing capacity.
  • In March 2025, Haus.me launched a global line of 3D-printed composite homes, which are entirely self-sufficient, powered by integrated solar glass and advanced thermal battery systems.
  • In April 2025, Nestron introduced its Anywhere Hub series, a line of mobile tiny homes featuring integrated satellite internet hardware and standard smart-home automation to serve the remote workforce.
  • In May 2025, NVIDIA Corporation released a specialized AI framework designed to assist architects in the generative design of micro-dwellings, optimizing for factors like natural light and airflow.

Dive into Technavio’s robust research methodology, blending expert interviews, extensive data synthesis, and validated models for unparalleled Tiny Homes Market insights. See full methodology.

Market Scope
Page number 285
Base year 2025
Historic period 2020-2024
Forecast period 2026-2030
Growth momentum & CAGR Accelerate at a CAGR of 4.8%
Market growth 2026-2030 USD 4667.9 million
Market structure Fragmented
YoY growth 2025-2026(%) 4.8%
Key countries US, Canada, Mexico, Germany, UK, France, Italy, Spain, Russia, Japan, China, India, South Korea, Australia, Singapore, Brazil, Argentina, Colombia, UAE, Saudi Arabia, South Africa, Egypt and Turkey
Competitive landscape Leading Companies, Market Positioning of Companies, Competitive Strategies, and Industry Risks

Request Free Sample

Research Analyst Overview

  • The tiny homes market is evolving from a niche interest into a sophisticated sector defined by technological innovation and shifting consumer priorities. The industry is leveraging high-performance materials and modular construction to deliver turnkey housing solutions that address modern living challenges.
  • The adoption of automated construction processes, utilizing techniques like 3D-printed composite homes and building information modeling for micro-dwellings, is critical. This enables the mass production of modular housing units, including both mobile tiny homes and stationary tiny homes, at an accelerated pace; some facilities can now produce foldable housing units in just 90 minutes.
  • A key focus is on integrating smart-home automation and off-grid systems, such as advanced solar integration and satellite-based internet, to create self-sufficient, energy-positive tiny homes. Materials like cross-laminated timber and reclaimed lumber are central to creating sustainable, low-carbon residential solutions, aligning with circular economy principles.
  • The market's maturation is evident in the rise of professionalized tiny home communities, often backed by real estate investment trusts, which demand strict adherence to structural safety standards. In a strategic boardroom context, the decision to invest in developing self-healing technology for prefabricated homes versus acquiring a company specializing in light-gauge steel frames highlights the critical choices facing industry leaders.
  • Navigating challenges such as thermal bridging in structural insulated panels and the legal status of non-stationary housing units remains crucial for sustained expansion.

What are the Key Data Covered in this Tiny Homes Market Research and Growth Report?

  • What is the expected growth of the Tiny Homes Market between 2026 and 2030?

    • USD 4.67 billion, at a CAGR of 4.8%

  • What segmentation does the market report cover?

    • The report is segmented by Product (Mobile tiny homes, and Stationary tiny homes), Application (Home use, and Commercial use), Material (Wood, Metal, and Recycled) and Geography (North America, Europe, APAC, South America, Middle East and Africa)

  • Which regions are analyzed in the report?

    • North America, Europe, APAC, South America and Middle East and Africa

  • What are the key growth drivers and market challenges?

    • Rising urban density and crisis of housing affordability, Regulatory and zoning constraints

  • Who are the major players in the Tiny Homes Market?

    • Atlas Vans, Boxabl Inc., CargoHome, Champion Homes Inc., Clayton Homes Inc., Connect Homes, Dvele Inc., FabCab Inc, HUF HAUS GmbH and Co. KG, Kodasema OU, Manta North, Method Homes, Minimaliste Inc., New Frontier Tiny Homes, Plant Prefab Inc., The Backcountry Hut Co, Tiny SMART House Inc., Tumbleweed Tiny House Co., Vagabond Haven AB and WheelHaus

Market Research Insights

  • Market dynamics are shaped by a strong consumer pull toward housing affordability and environmental sustainability, which fosters eco-conscious living. This trend is particularly evident among the remote workforce and digital nomad populations, who value financial freedom and a minimalist lifestyle.
  • Developers are responding to this demand by focusing on urban infill and climate-resilient housing projects, which now represent a significant portion of new construction. The integration of sustainable technologies has led to measurable business outcomes; for example, homes with advanced autonomous living systems can reduce energy consumption by up to 60%.
  • Furthermore, the adoption of modular designs has been shown to shorten construction timelines by 40% compared to traditional methods. Despite these positive trends, challenges related to zoning constraints and property valuation persist, creating a complex operating environment for builders.

We can help! Our analysts can customize this tiny homes market research report to meet your requirements.

Get in touch

1. Executive Summary

1.1 Market overview

Executive Summary - Chart on Market Overview
Executive Summary - Data Table on Market Overview
Executive Summary - Chart on Global Market Characteristics
Executive Summary - Chart on Market by Geography
Executive Summary - Chart on Market Segmentation by Product
Executive Summary - Chart on Market Segmentation by Application
Executive Summary - Chart on Market Segmentation by Material
Executive Summary - Chart on Incremental Growth
Executive Summary - Data Table on Incremental Growth
Executive Summary - Chart on Company Market Positioning

2. Technavio Analysis

2.1 Analysis of price sensitivity, lifecycle, customer purchase basket, adoption rates, and purchase criteria

2.2 Criticality of inputs and Factors of differentiation

Chart on Overview on criticality of inputs and factors of differentiation

2.3 Factors of disruption

Chart on Overview on factors of disruption

2.4 Impact of drivers and challenges

Chart on Impact of drivers and challenges in 2025 and 2030

3. Market Landscape

3.1 Market ecosystem

Chart on Parent Market
Data Table on - Parent Market

3.2 Market characteristics

Chart on Market characteristics analysis

3.3 Value chain analysis

Chart on Value chain analysis

4. Market Sizing

4.1 Market definition

Data Table on Offerings of companies included in the market definition

4.2 Market segment analysis

Market segments

4.3 Market size 2025

4.4 Market outlook: Forecast for 2025-2030

Chart on Global - Market size and forecast 2025-2030 ($ million)
Data Table on Global - Market size and forecast 2025-2030 ($ million)
Chart on Global Market: Year-over-year growth 2025-2030 (%)
Data Table on Global Market: Year-over-year growth 2025-2030 (%)

5. Historic Market Size

5.1 Global Tiny Homes Market 2020 - 2024

Historic Market Size - Data Table on Global Tiny Homes Market 2020 - 2024 ($ million)

5.2 Product segment analysis 2020 - 2024

Historic Market Size - Product Segment 2020 - 2024 ($ million)

5.3 Application segment analysis 2020 - 2024

Historic Market Size - Application Segment 2020 - 2024 ($ million)

5.4 Material segment analysis 2020 - 2024

Historic Market Size - Material Segment 2020 - 2024 ($ million)

5.5 Geography segment analysis 2020 - 2024

Historic Market Size - Geography Segment 2020 - 2024 ($ million)

5.6 Country segment analysis 2020 - 2024

Historic Market Size - Country Segment 2020 - 2024 ($ million)

6. Qualitative Analysis

6.1 Impact of AI on Global Tiny Homes Market

6.2 Impact of Geopolitical Conflicts on Global Tiny Homes Market

7. Five Forces Analysis

7.1 Five forces summary

Five forces analysis - Comparison between 2025 and 2030

7.2 Bargaining power of buyers

Bargaining power of buyers - Impact of key factors 2025 and 2030

7.3 Bargaining power of suppliers

Bargaining power of suppliers - Impact of key factors in 2025 and 2030

7.4 Threat of new entrants

Threat of new entrants - Impact of key factors in 2025 and 2030

7.5 Threat of substitutes

Threat of substitutes - Impact of key factors in 2025 and 2030

7.6 Threat of rivalry

Threat of rivalry - Impact of key factors in 2025 and 2030

7.7 Market condition

Chart on Market condition - Five forces 2025 and 2030

8. Market Segmentation by Product

8.1 Market segments

Chart on Product - Market share 2025-2030 (%)
Data Table on Product - Market share 2025-2030 (%)

8.2 Comparison by Product

Chart on Comparison by Product
Data Table on Comparison by Product

8.3 Mobile tiny homes - Market size and forecast 2025-2030

Chart on Mobile tiny homes - Market size and forecast 2025-2030 ($ million)
Data Table on Mobile tiny homes - Market size and forecast 2025-2030 ($ million)
Chart on Mobile tiny homes - Year-over-year growth 2025-2030 (%)
Data Table on Mobile tiny homes - Year-over-year growth 2025-2030 (%)

8.4 Stationary tiny homes - Market size and forecast 2025-2030

Chart on Stationary tiny homes - Market size and forecast 2025-2030 ($ million)
Data Table on Stationary tiny homes - Market size and forecast 2025-2030 ($ million)
Chart on Stationary tiny homes - Year-over-year growth 2025-2030 (%)
Data Table on Stationary tiny homes - Year-over-year growth 2025-2030 (%)

8.5 Market opportunity by Product

Market opportunity by Product ($ million)
Data Table on Market opportunity by Product ($ million)

9. Market Segmentation by Application

9.1 Market segments

Chart on Application - Market share 2025-2030 (%)
Data Table on Application - Market share 2025-2030 (%)

9.2 Comparison by Application

Chart on Comparison by Application
Data Table on Comparison by Application

9.3 Home use - Market size and forecast 2025-2030

Chart on Home use - Market size and forecast 2025-2030 ($ million)
Data Table on Home use - Market size and forecast 2025-2030 ($ million)
Chart on Home use - Year-over-year growth 2025-2030 (%)
Data Table on Home use - Year-over-year growth 2025-2030 (%)

9.4 Commercial use - Market size and forecast 2025-2030

Chart on Commercial use - Market size and forecast 2025-2030 ($ million)
Data Table on Commercial use - Market size and forecast 2025-2030 ($ million)
Chart on Commercial use - Year-over-year growth 2025-2030 (%)
Data Table on Commercial use - Year-over-year growth 2025-2030 (%)

9.5 Market opportunity by Application

Market opportunity by Application ($ million)
Data Table on Market opportunity by Application ($ million)

10. Market Segmentation by Material

10.1 Market segments

Chart on Material - Market share 2025-2030 (%)
Data Table on Material - Market share 2025-2030 (%)

10.2 Comparison by Material

Chart on Comparison by Material
Data Table on Comparison by Material

10.3 Wood - Market size and forecast 2025-2030

Chart on Wood - Market size and forecast 2025-2030 ($ million)
Data Table on Wood - Market size and forecast 2025-2030 ($ million)
Chart on Wood - Year-over-year growth 2025-2030 (%)
Data Table on Wood - Year-over-year growth 2025-2030 (%)

10.4 Metal - Market size and forecast 2025-2030

Chart on Metal - Market size and forecast 2025-2030 ($ million)
Data Table on Metal - Market size and forecast 2025-2030 ($ million)
Chart on Metal - Year-over-year growth 2025-2030 (%)
Data Table on Metal - Year-over-year growth 2025-2030 (%)

10.5 Recycled - Market size and forecast 2025-2030

Chart on Recycled - Market size and forecast 2025-2030 ($ million)
Data Table on Recycled - Market size and forecast 2025-2030 ($ million)
Chart on Recycled - Year-over-year growth 2025-2030 (%)
Data Table on Recycled - Year-over-year growth 2025-2030 (%)

10.6 Market opportunity by Material

Market opportunity by Material ($ million)
Data Table on Market opportunity by Material ($ million)

11. Customer Landscape

11.1 Customer landscape overview

Analysis of price sensitivity, lifecycle, customer purchase basket, adoption rates, and purchase criteria

12. Geographic Landscape

12.1 Geographic segmentation

Chart on Market share by geography 2025-2030 (%)
Data Table on Market share by geography 2025-2030 (%)

12.2 Geographic comparison

Chart on Geographic comparison
Data Table on Geographic comparison

12.3 North America - Market size and forecast 2025-2030

Chart on North America - Market size and forecast 2025-2030 ($ million)
Data Table on North America - Market size and forecast 2025-2030 ($ million)
Chart on North America - Year-over-year growth 2025-2030 (%)
Data Table on North America - Year-over-year growth 2025-2030 (%)
Chart on Regional Comparison - North America
Data Table on Regional Comparison - North America

12.3.1 US - Market size and forecast 2025-2030

Chart on US - Market size and forecast 2025-2030 ($ million)
Data Table on US - Market size and forecast 2025-2030 ($ million)
Chart on US - Year-over-year growth 2025-2030 (%)
Data Table on US - Year-over-year growth 2025-2030 (%)

12.3.2 Canada - Market size and forecast 2025-2030

Chart on Canada - Market size and forecast 2025-2030 ($ million)
Data Table on Canada - Market size and forecast 2025-2030 ($ million)
Chart on Canada - Year-over-year growth 2025-2030 (%)
Data Table on Canada - Year-over-year growth 2025-2030 (%)

12.3.3 Mexico - Market size and forecast 2025-2030

Chart on Mexico - Market size and forecast 2025-2030 ($ million)
Data Table on Mexico - Market size and forecast 2025-2030 ($ million)
Chart on Mexico - Year-over-year growth 2025-2030 (%)
Data Table on Mexico - Year-over-year growth 2025-2030 (%)

12.4 Europe - Market size and forecast 2025-2030

Chart on Europe - Market size and forecast 2025-2030 ($ million)
Data Table on Europe - Market size and forecast 2025-2030 ($ million)
Chart on Europe - Year-over-year growth 2025-2030 (%)
Data Table on Europe - Year-over-year growth 2025-2030 (%)
Chart on Regional Comparison - Europe
Data Table on Regional Comparison - Europe

12.4.1 Germany - Market size and forecast 2025-2030

Chart on Germany - Market size and forecast 2025-2030 ($ million)
Data Table on Germany - Market size and forecast 2025-2030 ($ million)
Chart on Germany - Year-over-year growth 2025-2030 (%)
Data Table on Germany - Year-over-year growth 2025-2030 (%)

12.4.2 UK - Market size and forecast 2025-2030

Chart on UK - Market size and forecast 2025-2030 ($ million)
Data Table on UK - Market size and forecast 2025-2030 ($ million)
Chart on UK - Year-over-year growth 2025-2030 (%)
Data Table on UK - Year-over-year growth 2025-2030 (%)

12.4.3 France - Market size and forecast 2025-2030

Chart on France - Market size and forecast 2025-2030 ($ million)
Data Table on France - Market size and forecast 2025-2030 ($ million)
Chart on France - Year-over-year growth 2025-2030 (%)
Data Table on France - Year-over-year growth 2025-2030 (%)

12.4.4 Italy - Market size and forecast 2025-2030

Chart on Italy - Market size and forecast 2025-2030 ($ million)
Data Table on Italy - Market size and forecast 2025-2030 ($ million)
Chart on Italy - Year-over-year growth 2025-2030 (%)
Data Table on Italy - Year-over-year growth 2025-2030 (%)

12.4.5 Spain - Market size and forecast 2025-2030

Chart on Spain - Market size and forecast 2025-2030 ($ million)
Data Table on Spain - Market size and forecast 2025-2030 ($ million)
Chart on Spain - Year-over-year growth 2025-2030 (%)
Data Table on Spain - Year-over-year growth 2025-2030 (%)

12.4.6 Russia - Market size and forecast 2025-2030

Chart on Russia - Market size and forecast 2025-2030 ($ million)
Data Table on Russia - Market size and forecast 2025-2030 ($ million)
Chart on Russia - Year-over-year growth 2025-2030 (%)
Data Table on Russia - Year-over-year growth 2025-2030 (%)

12.5 APAC - Market size and forecast 2025-2030

Chart on APAC - Market size and forecast 2025-2030 ($ million)
Data Table on APAC - Market size and forecast 2025-2030 ($ million)
Chart on APAC - Year-over-year growth 2025-2030 (%)
Data Table on APAC - Year-over-year growth 2025-2030 (%)
Chart on Regional Comparison - APAC
Data Table on Regional Comparison - APAC

12.5.1 Japan - Market size and forecast 2025-2030

Chart on Japan - Market size and forecast 2025-2030 ($ million)
Data Table on Japan - Market size and forecast 2025-2030 ($ million)
Chart on Japan - Year-over-year growth 2025-2030 (%)
Data Table on Japan - Year-over-year growth 2025-2030 (%)

12.5.2 China - Market size and forecast 2025-2030

Chart on China - Market size and forecast 2025-2030 ($ million)
Data Table on China - Market size and forecast 2025-2030 ($ million)
Chart on China - Year-over-year growth 2025-2030 (%)
Data Table on China - Year-over-year growth 2025-2030 (%)

12.5.3 India - Market size and forecast 2025-2030

Chart on India - Market size and forecast 2025-2030 ($ million)
Data Table on India - Market size and forecast 2025-2030 ($ million)
Chart on India - Year-over-year growth 2025-2030 (%)
Data Table on India - Year-over-year growth 2025-2030 (%)

12.5.4 South Korea - Market size and forecast 2025-2030

Chart on South Korea - Market size and forecast 2025-2030 ($ million)
Data Table on South Korea - Market size and forecast 2025-2030 ($ million)
Chart on South Korea - Year-over-year growth 2025-2030 (%)
Data Table on South Korea - Year-over-year growth 2025-2030 (%)

12.5.5 Australia - Market size and forecast 2025-2030

Chart on Australia - Market size and forecast 2025-2030 ($ million)
Data Table on Australia - Market size and forecast 2025-2030 ($ million)
Chart on Australia - Year-over-year growth 2025-2030 (%)
Data Table on Australia - Year-over-year growth 2025-2030 (%)

12.5.6 Singapore - Market size and forecast 2025-2030

Chart on Singapore - Market size and forecast 2025-2030 ($ million)
Data Table on Singapore - Market size and forecast 2025-2030 ($ million)
Chart on Singapore - Year-over-year growth 2025-2030 (%)
Data Table on Singapore - Year-over-year growth 2025-2030 (%)

12.6 South America - Market size and forecast 2025-2030

Chart on South America - Market size and forecast 2025-2030 ($ million)
Data Table on South America - Market size and forecast 2025-2030 ($ million)
Chart on South America - Year-over-year growth 2025-2030 (%)
Data Table on South America - Year-over-year growth 2025-2030 (%)
Chart on Regional Comparison - South America
Data Table on Regional Comparison - South America

12.6.1 Brazil - Market size and forecast 2025-2030

Chart on Brazil - Market size and forecast 2025-2030 ($ million)
Data Table on Brazil - Market size and forecast 2025-2030 ($ million)
Chart on Brazil - Year-over-year growth 2025-2030 (%)
Data Table on Brazil - Year-over-year growth 2025-2030 (%)

12.6.2 Argentina - Market size and forecast 2025-2030

Chart on Argentina - Market size and forecast 2025-2030 ($ million)
Data Table on Argentina - Market size and forecast 2025-2030 ($ million)
Chart on Argentina - Year-over-year growth 2025-2030 (%)
Data Table on Argentina - Year-over-year growth 2025-2030 (%)

12.6.3 Colombia - Market size and forecast 2025-2030

Chart on Colombia - Market size and forecast 2025-2030 ($ million)
Data Table on Colombia - Market size and forecast 2025-2030 ($ million)
Chart on Colombia - Year-over-year growth 2025-2030 (%)
Data Table on Colombia - Year-over-year growth 2025-2030 (%)

12.7 Middle East and Africa - Market size and forecast 2025-2030

Chart on Middle East and Africa - Market size and forecast 2025-2030 ($ million)
Data Table on Middle East and Africa - Market size and forecast 2025-2030 ($ million)
Chart on Middle East and Africa - Year-over-year growth 2025-2030 (%)
Data Table on Middle East and Africa - Year-over-year growth 2025-2030 (%)
Chart on Regional Comparison - Middle East and Africa
Data Table on Regional Comparison - Middle East and Africa

12.7.1 UAE - Market size and forecast 2025-2030

Chart on UAE - Market size and forecast 2025-2030 ($ million)
Data Table on UAE - Market size and forecast 2025-2030 ($ million)
Chart on UAE - Year-over-year growth 2025-2030 (%)
Data Table on UAE - Year-over-year growth 2025-2030 (%)

12.7.2 Saudi Arabia - Market size and forecast 2025-2030

Chart on Saudi Arabia - Market size and forecast 2025-2030 ($ million)
Data Table on Saudi Arabia - Market size and forecast 2025-2030 ($ million)
Chart on Saudi Arabia - Year-over-year growth 2025-2030 (%)
Data Table on Saudi Arabia - Year-over-year growth 2025-2030 (%)

12.7.3 South Africa - Market size and forecast 2025-2030

Chart on South Africa - Market size and forecast 2025-2030 ($ million)
Data Table on South Africa - Market size and forecast 2025-2030 ($ million)
Chart on South Africa - Year-over-year growth 2025-2030 (%)
Data Table on South Africa - Year-over-year growth 2025-2030 (%)

12.7.4 Egypt - Market size and forecast 2025-2030

Chart on Egypt - Market size and forecast 2025-2030 ($ million)
Data Table on Egypt - Market size and forecast 2025-2030 ($ million)
Chart on Egypt - Year-over-year growth 2025-2030 (%)
Data Table on Egypt - Year-over-year growth 2025-2030 (%)

12.7.5 Turkey - Market size and forecast 2025-2030

Chart on Turkey - Market size and forecast 2025-2030 ($ million)
Data Table on Turkey - Market size and forecast 2025-2030 ($ million)
Chart on Turkey - Year-over-year growth 2025-2030 (%)
Data Table on Turkey - Year-over-year growth 2025-2030 (%)

12.8 Market opportunity by geography

Market opportunity by geography ($ million)
Data Tables on Market opportunity by geography ($ million)

13. Drivers, Challenges, and Opportunity

13.1 Market drivers

Rising urban density and crisis of housing affordability
Integration of advanced sustainable technologies and eco-conscious living
Proliferation of remote work and nomad lifestyle

13.2 Market challenges

Regulatory and zoning constraints
Financing and valuation obstacles
Supply chain disruptions and material costs

13.3 Impact of drivers and challenges

Impact of drivers and challenges in 2025 and 2030

13.4 Market opportunities

Technological integration and advancement of automated construction processes
Environmental sustainability and evolution of autonomous living systems
Institutional investment and rise of professionalized tiny home communities

14. Competitive Landscape

14.1 Overview

14.2

Overview on criticality of inputs and factors of differentiation

14.3 Landscape disruption

Overview on factors of disruption

14.4 Industry risks

Impact of key risks on business

15. Competitive Analysis

15.1 Companies profiled

Companies covered

15.2 Company ranking index

15.3 Market positioning of companies

Matrix on companies position and classification

15.4 Atlas Vans

Atlas Vans - Overview
Atlas Vans - Product / Service
Atlas Vans - Key offerings
SWOT

15.5 Boxabl Inc.

Boxabl Inc. - Overview
Boxabl Inc. - Product / Service
Boxabl Inc. - Key offerings
SWOT

15.6 Champion Homes Inc.

Champion Homes Inc. - Overview
Champion Homes Inc. - Business segments
Champion Homes Inc. - Key offerings
Champion Homes Inc. - Segment focus
SWOT

15.7 Clayton Homes Inc.

Clayton Homes Inc. - Overview
Clayton Homes Inc. - Product / Service
Clayton Homes Inc. - Key offerings
SWOT

15.8 Connect Homes

Connect Homes - Overview
Connect Homes - Product / Service
Connect Homes - Key offerings
SWOT

15.9 Dvele Inc.

Dvele Inc. - Overview
Dvele Inc. - Product / Service
Dvele Inc. - Key offerings
SWOT

15.10 FabCab Inc

FabCab Inc - Overview
FabCab Inc - Product / Service
FabCab Inc - Key offerings
SWOT

15.11 HUF HAUS GmbH and Co. KG

HUF HAUS GmbH and Co. KG - Overview
HUF HAUS GmbH and Co. KG - Product / Service
HUF HAUS GmbH and Co. KG - Key offerings
SWOT

15.12 Method Homes

Method Homes - Overview
Method Homes - Product / Service
Method Homes - Key offerings
SWOT

15.13 New Frontier Tiny Homes

New Frontier Tiny Homes - Overview
New Frontier Tiny Homes - Product / Service
New Frontier Tiny Homes - Key offerings
SWOT

15.14 Plant Prefab Inc.

Plant Prefab Inc. - Overview
Plant Prefab Inc. - Product / Service
Plant Prefab Inc. - Key offerings
SWOT

15.15 The Backcountry Hut Co

The Backcountry Hut Co - Overview
The Backcountry Hut Co - Product / Service
The Backcountry Hut Co - Key offerings
SWOT

15.16 Tiny SMART House Inc.

Tiny SMART House Inc. - Overview
Tiny SMART House Inc. - Product / Service
Tiny SMART House Inc. - Key offerings
SWOT

15.17 Tumbleweed Tiny House Co.

Tumbleweed Tiny House Co. - Overview
Tumbleweed Tiny House Co. - Product / Service
Tumbleweed Tiny House Co. - Key offerings
SWOT

15.18 Vagabond Haven AB

Vagabond Haven AB - Overview
Vagabond Haven AB - Product / Service
Vagabond Haven AB - Key offerings
SWOT

16. Appendix

16.1 Scope of the report

Market definition
Objectives
Notes and caveats

16.2 Inclusions and exclusions checklist

Inclusions checklist
Exclusions checklist

16.3 Currency conversion rates for US$

16.4 Research methodology

16.5 Data procurement

Information sources

16.6 Data validation

16.7 Validation techniques employed for market sizing

16.8 Data synthesis

16.9 360 degree market analysis

16.10 List of abbreviations

Research Methodology

Technavio presents a detailed picture of the market by way of study, synthesis, and summation of data from multiple sources. The analysts have presented the various facets of the market with a particular focus on identifying the key industry influencers. The data thus presented is comprehensive, reliable, and the result of extensive research, both primary and secondary.

INFORMATION SOURCES

Primary sources

  • Manufacturers and suppliers
  • Channel partners
  • Industry experts
  • Strategic decision makers

Secondary sources

  • Industry journals and periodicals
  • Government data
  • Financial reports of key industry players
  • Historical data
  • Press releases

DATA ANALYSIS

Data Synthesis

  • Collation of data
  • Estimation of key figures
  • Analysis of derived insights

Data Validation

  • Triangulation with data models
  • Reference against proprietary databases
  • Corroboration with industry experts

REPORT WRITING

Qualitative

  • Market drivers
  • Market challenges
  • Market trends
  • Five forces analysis

Quantitative

  • Market size and forecast
  • Market segmentation
  • Geographical insights
  • Competitive landscape

Interested in this report?

Get your sample now to see our research methodology and insights!

Download Now

Frequently Asked Questions

Tiny Homes market growth will increase by USD 4667.9 million during 2026-2030.

The Tiny Homes market is expected to grow at a CAGR of 4.8% during 2026-2030.

Tiny Homes market is segmented by Product (Mobile tiny homes, Stationary tiny homes) Application (Home use, Commercial use) Material (Wood, Metal, Recycled)

Atlas Vans, Boxabl Inc., CargoHome, Champion Homes Inc., Clayton Homes Inc., Connect Homes, Dvele Inc., FabCab Inc, HUF HAUS GmbH and Co. KG, Kodasema OU, Manta North, Method Homes, Minimaliste Inc., New Frontier Tiny Homes, Plant Prefab Inc., The Backcountry Hut Co, Tiny SMART House Inc., Tumbleweed Tiny House Co., Vagabond Haven AB, WheelHaus are a few of the key vendors in the Tiny Homes market.

North America will register the highest growth rate of 51.7% among the other regions. Therefore, the Tiny Homes market in North America is expected to garner significant business opportunities for the vendors during the forecast period.

US, Canada, Mexico, Germany, UK, France, Italy, Spain, Russia, Japan, China, India, South Korea, Australia, Singapore, Brazil, Argentina, Colombia, UAE, Saudi Arabia, South Africa, Egypt, Turkey

  • Rising urban density and crisis of housing affordability is the driving factor this market.

The Tiny Homes market vendors should focus on grabbing business opportunities from the Product segment as it accounted for the largest market share in the base year.
RIA - Research AI Assistant
Ask RIA