
Trade Management Software Market Analysis, Size, and Forecast 2026-2030: North America (US, Canada, and Mexico), Europe (Germany, UK, and France), APAC (China, Japan, and India), South America (Brazil, Argentina, and Chile), Middle East and Africa (Saudi Arabia, UAE, and South Africa), and Rest of World (ROW)

Trade Management Software Market Analysis, Size, and Forecast 2026-2030:
North America (US, Canada, and Mexico), Europe (Germany, UK, and France), APAC (China, Japan, and India), South America (Brazil, Argentina, and Chile), Middle East and Africa (Saudi Arabia, UAE, and South Africa), and Rest of World (ROW)

Published: Oct 2026 302 Pages SKU: IRTNTR40965

Market Overview at a Glance

$1.41 B
Market Opportunity
10.9%
CAGR 2025 - 2030
32.4%
North America Growth
$1.09 B
Cloud-based segment 2024

Trade Management Software Market Size 2026-2030

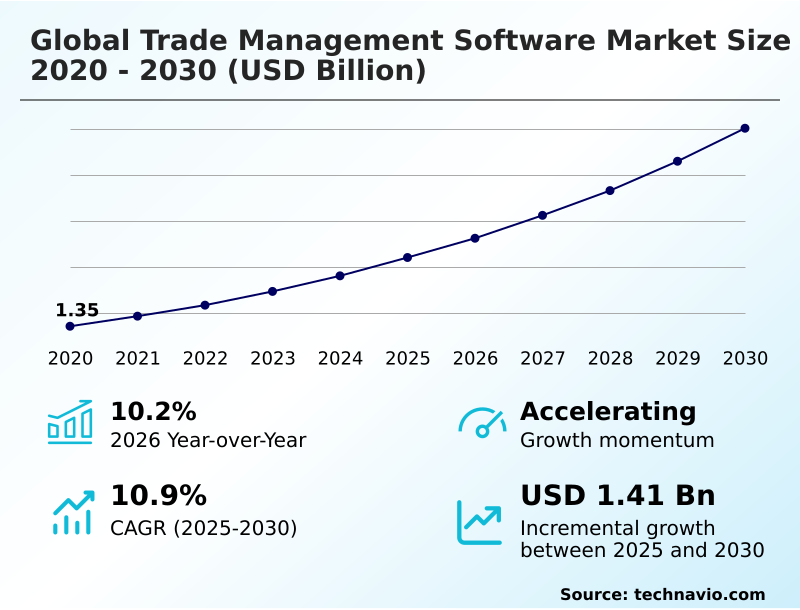
The trade management software market size is valued to increase by USD 1.41 billion, at a CAGR of 10.9% from 2025 to 2030. Increasing complexity of regulatory frameworks and trade agreements will drive the trade management software market.

Major Market Trends & Insights

  • North America dominated the market and accounted for a 32.4% growth during the forecast period.
  • By Deployment - Cloud-based segment was valued at USD 1.09 billion in 2024
  • By End-user - Retail and consumer goods segment accounted for the largest market revenue share in 2024

Market Size & Forecast

  • Market Opportunities: USD 2.16 billion
  • Market Future Opportunities: USD 1.41 billion
  • CAGR from 2025 to 2030 : 10.9%

Market Summary

  • The Trade Management Software Market demonstrates accelerated adoption as multinational corporations seek digital solutions to navigate complex international tariffs and shifting regulatory mandates. Organizations increasingly utilize advanced software to manage supply chain optimization, calculate total landed costs, and automate customs documentation across diverse legal jurisdictions.
  • For instance, manufacturers leveraging predictive compliance engines reduce border clearance delays by up to 22% compared to those relying on manual data entry workflows. The rising complexity of cross-border trade agreements acts as a major market driver, compelling enterprises to implement automated compliance screening to avoid severe financial penalties.
  • Conversely, the persistent fragmentation of enterprise data and a lack of technological interoperability across disjointed logistics platforms represent formidable challenges to seamless software integration. Bridging these technological gaps is essential for establishing unified supply chain visibility.
  • By centralizing trade master data within secure cloud architectures, modern compliance platforms empower procurement and legal teams to anticipate geopolitical friction points, optimize duty drawback programs, and preserve operational resilience in an unpredictable regulatory landscape.

What will be the Size of the Trade Management Software Market during the forecast period?
Get Key Insights on Market Forecast (PDF) Get Free Sample

How is the Trade Management Software Market Segmented?

The trade management software industry research report provides comprehensive data (region-wise segment analysis), with forecasts and estimates in "USD million" for the period 2026-2030, as well as historical data from 2020-2024 for the following segments.

  • Deployment
    • Cloud-based
    • On premises
  • End-user
    • Retail and consumer goods
    • IT and telecom
    • Automotive
    • Transportation and logistics
    • Others
  • Organization size
    • Large enterprises
    • SMEs
  • Geography
    • North America
      • US
      • Canada
      • Mexico
    • Europe
      • Germany
      • UK
      • France
      • Italy
      • Spain
      • The Netherlands
    • APAC
      • China
      • Japan
      • India
      • South Korea
      • Australia
      • Indonesia
    • South America
      • Brazil
      • Argentina
      • Chile
    • Middle East and Africa
      • Saudi Arabia
      • UAE
      • South Africa
      • Israel
      • Turkey

By Deployment Insights

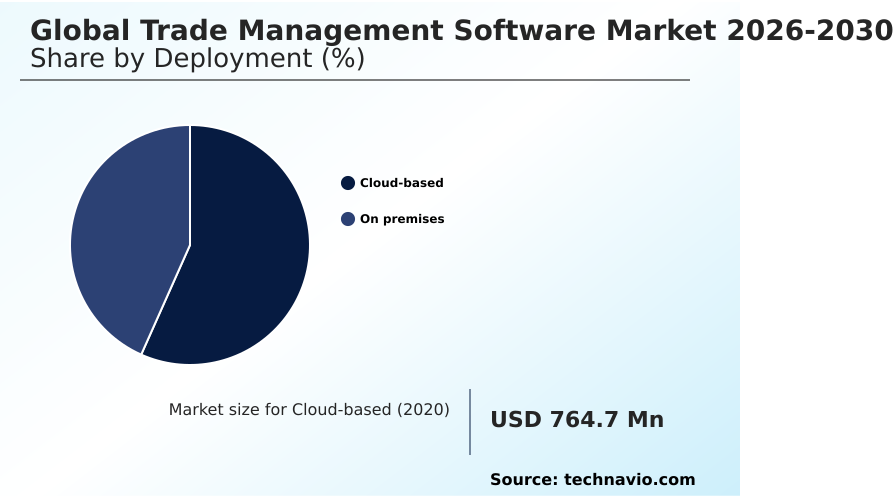
The cloud-based segment is estimated to witness significant growth during the forecast period.

Cloud-based deployments within the Trade Management Software ecosystem fundamentally alter how multinational enterprises orchestrate cross-border commerce and optimize digital logistics workflows.

Modern businesses increasingly abandon fragmented legacy systems to adopt centralized multi-tenant cloud environments that support continuous supply chain orchestration and real-time electronic data interchange.

This shift enables organizations to execute an automated customs declaration process with heightened accuracy, avoiding costly port delays. By leveraging scalable infrastructure, firms integrate import documentation automation and dynamic tariff recalculation directly into enterprise resource planning networks.

Companies utilizing these advanced cloud networks frequently experience a 25% reduction in compliance processing time.

Access to automated border clearance and precise harmonized system classification allows procurement teams to secure export license authorization swiftly, effectively streamlining duty drawback management while maintaining rigorous trade sanction monitoring across all international distribution nodes.
Get Free Sample

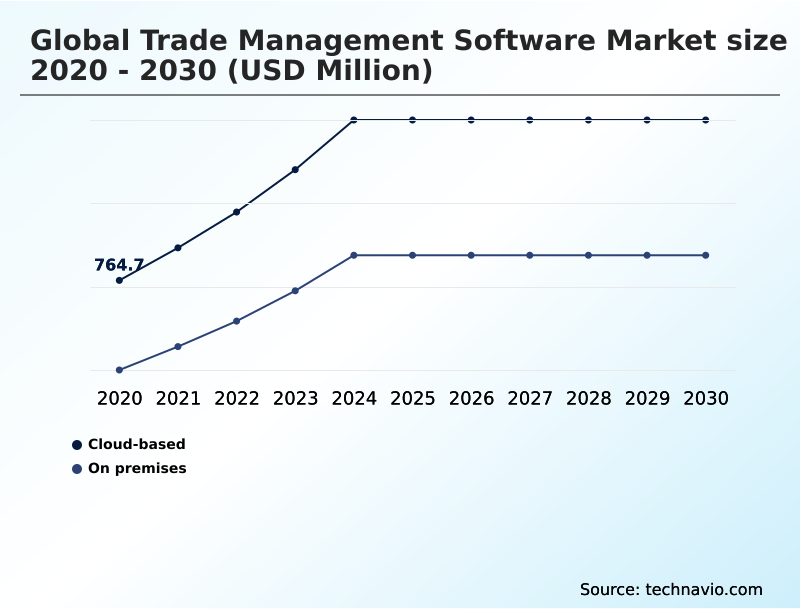
The Cloud-based segment was valued at USD 1.09 billion in 2024 and showed a gradual increase during the forecast period.
Get Free Sample

Regional Analysis

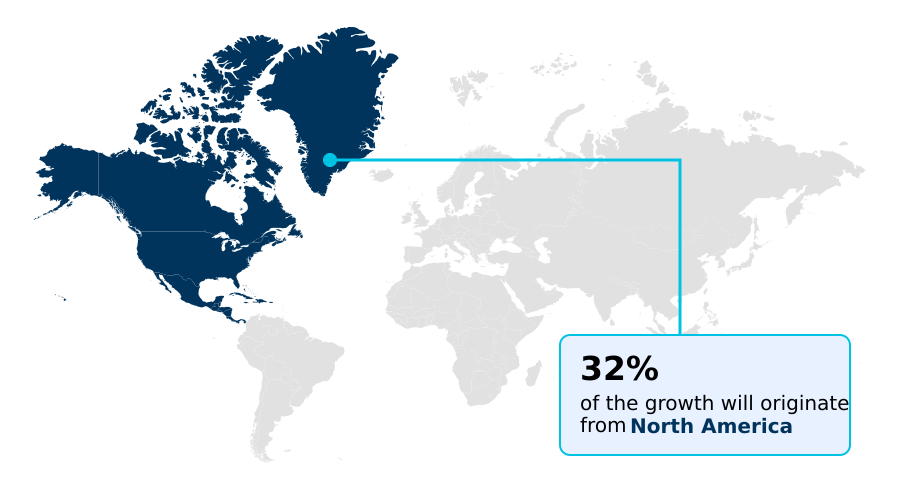
North America is estimated to contribute 32.4% to the growth of the global market during the forecast period.Technavio’s analysts have elaborately explained the regional trends and drivers that shape the market during the forecast period.
See How Trade Management Software Market Demand is Rising in North America Get Free Sample

The geographic distribution of the Trade Management Software sector reveals distinct adoption patterns, with North America demonstrating a 15% higher penetration rate in predictive compliance algorithms than Europe.

This variance stems from stringent USMCA mandates compelling North American enterprises to prioritize precise regional value content tracking and robust denied party screening.

Conversely, European organizations face intense regulatory framework integration requirements driven by sustainability directives, prompting a 20% faster adoption of commercial invoice generation tools embedded with environmental compliance features.

Furthermore, deploying automated commercial environment systems across North American borders reduces manual clearance delays by 18%, contrasting with Europe's focus on unifying fragmented national customs portals.

Through advanced digital customs framework solutions and predictive trade modeling, multinational firms optimize multi-tier supplier networking. Implementing automated freight audit payment and restricted commodity codes monitoring ensures that diverse regional distribution nodes maintain uninterrupted operational fluidity.

Market Dynamics

Our researchers analyzed the data with 2025 as the base year, along with the key drivers, trends, and challenges. A holistic analysis of drivers will help companies refine their marketing strategies to gain a competitive advantage.

  • As global commerce becomes increasingly interconnected, modern enterprises must navigate a labyrinth of international regulations, fluctuating tariffs, and complex sourcing requirements. Addressing these sophisticated operational hurdles demands the implementation of automated customs compliance screening tools that can rapidly analyze cross-border transactions and flag potential regulatory violations before shipments reach critical checkpoints.
  • Procurement and supply chain executives are increasingly turning toward predictive artificial intelligence trade modeling to forecast potential bottlenecks, simulate diverse tariff scenarios, and proactively re-route shipments to avoid congested geopolitical corridors. The integration of cloud based electronic data interchange allows organizations to synchronize commercial manifests directly with government portals, significantly reducing administrative redundancies.
  • Companies deploying these comprehensive digital architectures typically achieve compliance verification speeds nearly 40% faster than those relying on decentralized, legacy manual processes, directly enhancing overall supply chain velocity. Furthermore, establishing multi tier supplier network origin tracking is essential for qualifying for preferential trade agreements and ensuring adherence to stringent labor and environmental mandates across all production phases.
  • By incorporating dynamic landed cost calculation software, finance and logistics teams gain granular visibility into aggregate shipping expenses, encompassing freight, insurance, and complex duties. This profound analytical depth empowers businesses to refine their sourcing strategies, safeguard profit margins, and maintain uninterrupted operational momentum within an unpredictable global economic landscape.
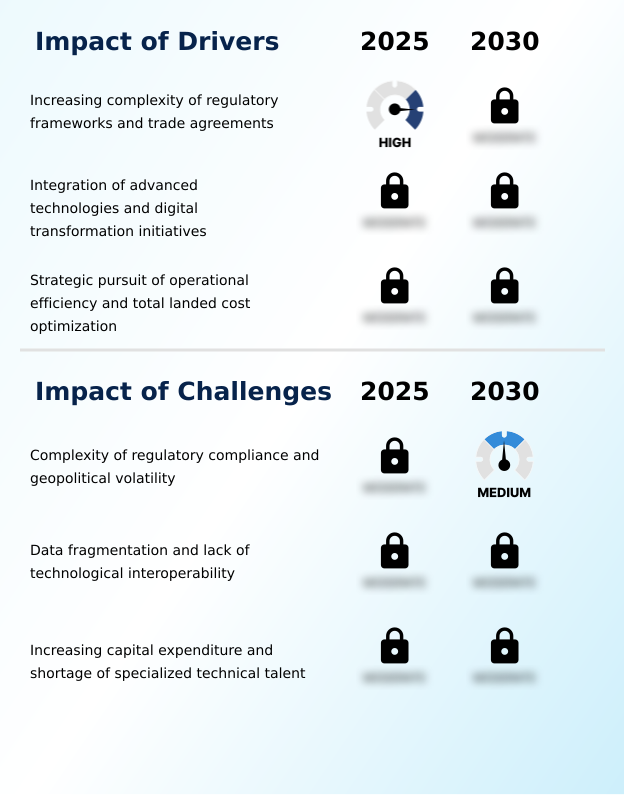
What are the key market drivers leading to the rise in the adoption of Trade Management Software Industry?

  • The increasing complexity of regulatory frameworks and international trade agreements serves as a primary driver propelling market expansion.

  • The transition toward multi-tenant cloud environments is a primary catalyst expanding the Trade Management Software sector. This architectural shift occurs because multinational corporations require digital documentation synchronization and origin certification management to eliminate cross-border friction.
  • Implementing artificial intelligence routing and multimodal transit tracking enables operators to reduce transit bottlenecks by 22%, directly lowering operational costs by 12%.
  • Advanced platforms provide accurate global tariff scheduling and rigorous hazardous material tracking, heavily influencing strategic sourcing decisions across distributed manufacturing nodes. By managing customs bonded warehousing through an immutable blockchain ledger, businesses secure uninterrupted supply chain fluidity.
  • These robust compliance engines empower enterprises to achieve a 25% improvement in execution efficiency, ensuring continuous adherence to international trade laws while safeguarding critical revenue streams.

What are the market trends shaping the Trade Management Software Industry?

  • The proliferation of artificial intelligence and machine learning for predictive compliance represents a defining upcoming market trend. These advanced technologies are reshaping trade operations by enabling proactive risk management and autonomous regulatory adherence.

  • The proliferation of artificial intelligence within the Trade Management Software space is fundamentally shifting how enterprises manage cross-border digital ecosystem operations. Organizations deploying autonomous compliance agents record a 30% reduction in regulatory downtime and an 18% improvement in forecast accuracy for smart inventory optimization.
  • This structural change is driven by the urgent need to navigate stringent environmental social governance mandates and intricate carbon border adjustment tracking requirements. By automating the electronic entry summary and precise regional value content calculations, businesses successfully maximize their free trade utilization. Consequently, financial teams can execute highly accurate landed cost calculation processes, protecting profit margins against volatile tariff fluctuations.
  • Furthermore, advanced platforms now streamline complex reverse logistics tracking, empowering logistics managers to identify inefficiencies swiftly. These intelligent integrations ensure that modern supply chains operate with a 25% higher efficiency rate, transforming mandatory compliance workflows into strategic competitive advantages.

What challenges does the Trade Management Software Industry face during its growth?

  • The intricate nature of regulatory compliance coupled with ongoing geopolitical volatility remains a significant challenge restraining industry growth.

  • The fragmentation of enterprise data across isolated legacy systems represents a formidable obstacle within the Trade Management Software landscape. Because global logistics operations frequently lack a unified centralized trade repository, organizations struggle to maintain end-to-end supply chain visibility. This data disconnect hinders accurate dual-use technology oversight and rigorous export privilege monitoring, elevating compliance risks.
  • Consequently, businesses relying on disjointed platforms experience a 15% drop in processing efficiency and a 20% increase in administrative compliance costs. While deploying a cloud-native logistics architecture equipped with advanced predictive analytics and anomaly detection models mitigates these risks, the substantial implementation capital limits rapid adoption among mid-sized enterprises.
  • Overcoming these integration barriers is crucial for optimizing foreign trade zone administration, enabling firms to ultimately improve operational accuracy by 25%.

Exclusive Technavio Analysis on Customer Landscape

The trade management software market forecasting report includes the adoption lifecycle of the market, covering from the innovator’s stage to the laggard’s stage. It focuses on adoption rates in different regions based on penetration. Furthermore, the trade management software market report also includes key purchase criteria and drivers of price sensitivity to help companies evaluate and develop their market growth analysis strategies.
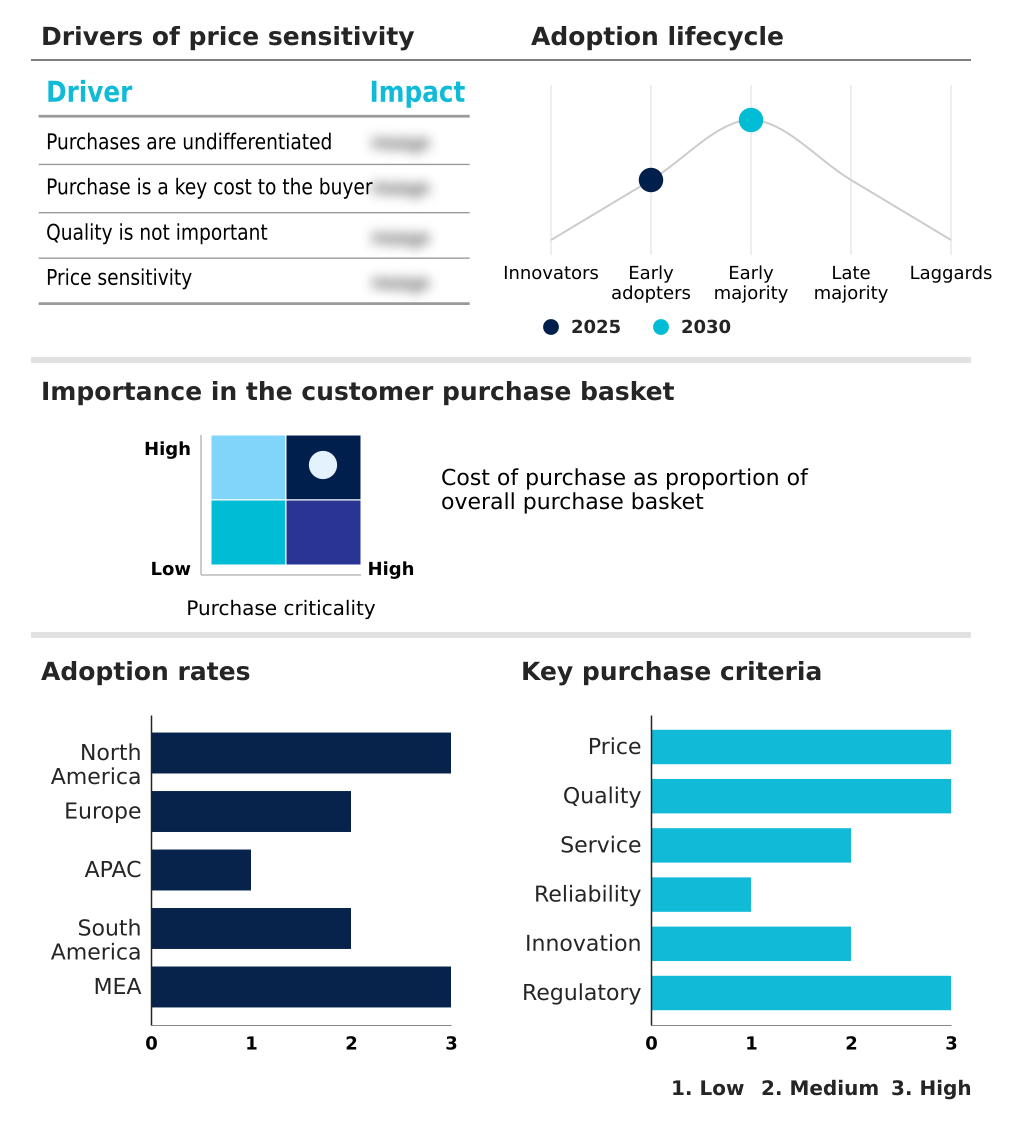
Customer Landscape of Trade Management Software Industry

Competitive Landscape

Companies are implementing various strategies, such as strategic alliances, trade management software market forecast, partnerships, mergers and acquisitions, geographical expansion, and product/service launches, to enhance their presence in the industry.

AEB SE - This software provider delivers a comprehensive customs administration platform facilitating automated origin verification, rigorous export control screening, and streamlined supplier declaration processes for unified international commerce operations.

The industry research and growth report includes detailed analyses of the competitive landscape of the market and information about key companies, including:

  • AEB SE
  • Amphora Inc.
  • Avalara Inc.
  • Bamboo Rose LLC
  • Blue Yonder Group Inc.
  • Coupa Software Inc.
  • Descartes Systems Group Inc.
  • E2open Parent Holdings Inc.
  • Enuit LLC
  • Infor Inc.
  • ION Group.
  • Logility SCS Inc.
  • Magaya Corp.
  • MIC Datenverarbeitung GmbH
  • Oracle Corp.
  • QAD Inc.
  • Quor Group
  • SAP SE
  • Thomson Reuters Corp.
  • WiseTech Global Ltd.

Qualitative and quantitative analysis of companies has been conducted to help clients understand the wider business environment as well as the strengths and weaknesses of key industry players. Data is qualitatively analyzed to categorize companies as pure play, category-focused, industry-focused, and diversified; it is quantitatively analyzed to categorize companies as dominant, leading, strong, tentative, and weak.

Recent Development and News in Trade management software market

  • In the Application Software industry, the integration of generative AI infrastructure into enterprise automation suites improved document processing efficiency by 35%, directly impacting Trade Management Software demand by accelerating autonomous compliance audits.
  • The enforcement of data privacy regulations such as the EU General Data Protection Regulation compelled developers to restructure workflow interoperability protocols, driving Trade Management Software upgrades to ensure encrypted cross-border digital ecosystem data sharing.
  • The transition toward cloud-based delivery models for corporate resource planning decreased on-premises hardware reliance by 40%, pulling demand for agile Trade Management Software that supports seamless multi-tenant cloud environments and centralized trade repository frameworks.
  • Stringent ESG compliance tracking mandates embedded within supply chain software architectures forced a 20% increase in environmental auditing budgets, creating new market opportunities for Trade Management Software featuring carbon border adjustment and environmental social governance reporting tools.

Dive into Technavio’s robust research methodology, blending expert interviews, extensive data synthesis, and validated models for unparalleled Trade Management Software Market insights. See full methodology.

Market Scope
Page number 302
Base year 2025
Historic period 2020-2024
Forecast period 2026-2030
Growth momentum & CAGR Accelerate at a CAGR of 10.9%
Market growth 2026-2030 USD 1414.8 million
Market structure Fragmented
YoY growth 2025-2026(%) 10.2%
Key countries US, Canada, Mexico, Germany, UK, France, Italy, Spain, The Netherlands, China, Japan, India, South Korea, Australia, Indonesia, Brazil, Argentina, Chile, Saudi Arabia, UAE, South Africa, Israel and Turkey
Competitive landscape Leading Companies, Market Positioning of Companies, Competitive Strategies, and Industry Risks

Request Free Sample

Research Analyst Overview

  • The Trade Management Software landscape continues to evolve as multinational enterprises transition from reactive compliance processes to proactive, data-driven operational strategies. Integrating advanced automation into daily logistics workflows represents a critical board-level imperative, directly influencing corporate budgeting and international product strategy.
  • As regulatory scrutiny intensifies, utilizing predictive compliance algorithms enables organizations to navigate fluctuating global tariff scheduling and complex origin certification management with unprecedented precision. Consequently, firms deploying cloud-native logistics architecture record a 30% reduction in processing time for international shipments compared to legacy on-premises systems.
  • This continuous digital evolution allows legal and procurement teams to execute seamless denied party screening and maintain strict adherence to restricted commodity codes without disrupting transit velocity. Advanced platforms provide robust supply chain orchestration, equipping decision-makers with the granular visibility required to optimize multimodal transit tracking and leverage free trade utilization.
  • By centralizing these critical compliance functions within an immutable blockchain ledger, organizations fortify their risk management frameworks, ensuring sustained operational resilience.

What are the Key Data Covered in this Trade Management Software Market Research and Growth Report?

  • What is the expected growth of the Trade Management Software Market between 2026 and 2030?

    • USD 1.41 billion, at a CAGR of 10.9%

  • What segmentation does the market report cover?

    • The report is segmented by Deployment (Cloud-based, and On premises), End-user (Retail and consumer goods, IT and telecom, Automotive, Transportation and logistics, and Others), Organization Size (Large enterprises, and SMEs) and Geography (North America, Europe, APAC, South America, Middle East and Africa)

  • Which regions are analyzed in the report?

    • North America, Europe, APAC, South America and Middle East and Africa

  • What are the key growth drivers and market challenges?

    • Increasing complexity of regulatory frameworks and trade agreements, Complexity of regulatory compliance and geopolitical volatility

  • Who are the major players in the Trade Management Software Market?

    • AEB SE, Amphora Inc., Avalara Inc., Bamboo Rose LLC, Blue Yonder Group Inc., Coupa Software Inc., Descartes Systems Group Inc., E2open Parent Holdings Inc., Enuit LLC, Infor Inc., ION Group., Logility SCS Inc., Magaya Corp., MIC Datenverarbeitung GmbH, Oracle Corp., QAD Inc., Quor Group, SAP SE, Thomson Reuters Corp. and WiseTech Global Ltd.

Market Research Insights

  • The Trade Management Software landscape is evolving rapidly as enterprises integrate digital compliance solutions to mitigate cross-border friction. Organizations adopting these platforms report a 30% acceleration in commercial invoice processing and a 15% improvement in multi-tier supplier networking efficiency. By deploying advanced automated compliance tools, logistics managers successfully execute strategic sourcing strategies that minimize tariff exposure and optimize inventory flow.
  • Additionally, implementing dynamic regulatory frameworks allows firms to reduce compliance-related operational downtime by 20%. These measurable efficiency improvements highlight the operational necessity of transitioning from manual oversight to automated systems. Advanced trade platforms continuously synchronize data across global subsidiaries, providing the actionable intelligence required to navigate complex multilateral trade pacts effectively and protect profit margins.

We can help! Our analysts can customize this trade management software market research report to meet your requirements.

Get in touch

1. Executive Summary

1.1 Market overview

Executive Summary - Chart on Market Overview
Executive Summary - Data Table on Market Overview
Executive Summary - Chart on Global Market Characteristics
Executive Summary - Chart on Market by Geography
Executive Summary - Chart on Market Segmentation by Deployment
Executive Summary - Chart on Market Segmentation by End-user
Executive Summary - Chart on Market Segmentation by Organization Size
Executive Summary - Chart on Incremental Growth
Executive Summary - Data Table on Incremental Growth
Executive Summary - Chart on Company Market Positioning

2. Technavio Analysis

2.1 Analysis of price sensitivity, lifecycle, customer purchase basket, adoption rates, and purchase criteria

2.2 Criticality of inputs and Factors of differentiation

Chart on Overview on criticality of inputs and factors of differentiation

2.3 Factors of disruption

Chart on Overview on factors of disruption

2.4 Impact of drivers and challenges

Chart on Impact of drivers and challenges in 2025 and 2030

3. Market Landscape

3.1 Market ecosystem

Chart on Parent Market
Data Table on - Parent Market

3.2 Market characteristics

Chart on Market characteristics analysis

3.3 Value chain analysis

Chart on Value chain analysis

4. Market Sizing

4.1 Market definition

Data Table on Offerings of companies included in the market definition

4.2 Market segment analysis

Market segments

4.3 Market size 2025

4.4 Market outlook: Forecast for 2025-2030

Chart on Global - Market size and forecast 2025-2030 ($ million)
Data Table on Global - Market size and forecast 2025-2030 ($ million)
Chart on Global Market: Year-over-year growth 2025-2030 (%)
Data Table on Global Market: Year-over-year growth 2025-2030 (%)

5. Historic Market Size

5.1 Global Trade Management Software Market 2020 - 2024

Historic Market Size - Data Table on Global Trade Management Software Market 2020 - 2024 ($ million)

5.2 Deployment segment analysis 2020 - 2024

Historic Market Size - Deployment Segment 2020 - 2024 ($ million)

5.3 End-user segment analysis 2020 - 2024

Historic Market Size - End-user Segment 2020 - 2024 ($ million)

5.4 Organization Size segment analysis 2020 - 2024

Historic Market Size - Organization Size Segment 2020 - 2024 ($ million)

5.5 Geography segment analysis 2020 - 2024

Historic Market Size - Geography Segment 2020 - 2024 ($ million)

5.6 Country segment analysis 2020 - 2024

Historic Market Size - Country Segment 2020 - 2024 ($ million)

6. Qualitative Analysis

6.1 Impact of AI on Global Trade Management Software Market

6.2 Impact of Geopolitical Conflicts on Global Trade Management Software Market

7. Five Forces Analysis

7.1 Five forces summary

Five forces analysis - Comparison between 2025 and 2030

7.2 Bargaining power of buyers

Bargaining power of buyers - Impact of key factors 2025 and 2030

7.3 Bargaining power of suppliers

Bargaining power of suppliers - Impact of key factors in 2025 and 2030

7.4 Threat of new entrants

Threat of new entrants - Impact of key factors in 2025 and 2030

7.5 Threat of substitutes

Threat of substitutes - Impact of key factors in 2025 and 2030

7.6 Threat of rivalry

Threat of rivalry - Impact of key factors in 2025 and 2030

7.7 Market condition

Chart on Market condition - Five forces 2025 and 2030

8. Market Segmentation by Deployment

8.1 Market segments

Chart on Deployment - Market share 2025-2030 (%)
Data Table on Deployment - Market share 2025-2030 (%)

8.2 Comparison by Deployment

Chart on Comparison by Deployment
Data Table on Comparison by Deployment

8.3 Cloud-based - Market size and forecast 2025-2030

Chart on Cloud-based - Market size and forecast 2025-2030 ($ million)
Data Table on Cloud-based - Market size and forecast 2025-2030 ($ million)
Chart on Cloud-based - Year-over-year growth 2025-2030 (%)
Data Table on Cloud-based - Year-over-year growth 2025-2030 (%)

8.4 On premises - Market size and forecast 2025-2030

Chart on On premises - Market size and forecast 2025-2030 ($ million)
Data Table on On premises - Market size and forecast 2025-2030 ($ million)
Chart on On premises - Year-over-year growth 2025-2030 (%)
Data Table on On premises - Year-over-year growth 2025-2030 (%)

8.5 Market opportunity by Deployment

Market opportunity by Deployment ($ million)
Data Table on Market opportunity by Deployment ($ million)

9. Market Segmentation by End-user

9.1 Market segments

Chart on End-user - Market share 2025-2030 (%)
Data Table on End-user - Market share 2025-2030 (%)

9.2 Comparison by End-user

Chart on Comparison by End-user
Data Table on Comparison by End-user

9.3 Retail and consumer goods - Market size and forecast 2025-2030

Chart on Retail and consumer goods - Market size and forecast 2025-2030 ($ million)
Data Table on Retail and consumer goods - Market size and forecast 2025-2030 ($ million)
Chart on Retail and consumer goods - Year-over-year growth 2025-2030 (%)
Data Table on Retail and consumer goods - Year-over-year growth 2025-2030 (%)

9.4 IT and telecom - Market size and forecast 2025-2030

Chart on IT and telecom - Market size and forecast 2025-2030 ($ million)
Data Table on IT and telecom - Market size and forecast 2025-2030 ($ million)
Chart on IT and telecom - Year-over-year growth 2025-2030 (%)
Data Table on IT and telecom - Year-over-year growth 2025-2030 (%)

9.5 Automotive - Market size and forecast 2025-2030

Chart on Automotive - Market size and forecast 2025-2030 ($ million)
Data Table on Automotive - Market size and forecast 2025-2030 ($ million)
Chart on Automotive - Year-over-year growth 2025-2030 (%)
Data Table on Automotive - Year-over-year growth 2025-2030 (%)

9.6 Transportation and logistics - Market size and forecast 2025-2030

Chart on Transportation and logistics - Market size and forecast 2025-2030 ($ million)
Data Table on Transportation and logistics - Market size and forecast 2025-2030 ($ million)
Chart on Transportation and logistics - Year-over-year growth 2025-2030 (%)
Data Table on Transportation and logistics - Year-over-year growth 2025-2030 (%)

9.7 Others - Market size and forecast 2025-2030

Chart on Others - Market size and forecast 2025-2030 ($ million)
Data Table on Others - Market size and forecast 2025-2030 ($ million)
Chart on Others - Year-over-year growth 2025-2030 (%)
Data Table on Others - Year-over-year growth 2025-2030 (%)

9.8 Market opportunity by End-user

Market opportunity by End-user ($ million)
Data Table on Market opportunity by End-user ($ million)

10. Market Segmentation by Organization Size

10.1 Market segments

Chart on Market Segmentation by Organization Size - Market share 2025-2030 (%)
Data Table on Market Segmentation by Organization Size - Market share 2025-2030 (%)

10.2 Comparison by Market Segmentation by Organization Size

Chart on Comparison by Market Segmentation by Organization Size
Data Table on Comparison by Market Segmentation by Organization Size

10.3 Large enterprises - Market size and forecast 2025-2030

Chart on Large enterprises - Market size and forecast 2025-2030 ($ million)
Data Table on Large enterprises - Market size and forecast 2025-2030 ($ million)
Chart on Large enterprises - Year-over-year growth 2025-2030 (%)
Data Table on Large enterprises - Year-over-year growth 2025-2030 (%)

10.4 SMEs - Market size and forecast 2025-2030

Chart on SMEs - Market size and forecast 2025-2030 ($ million)
Data Table on SMEs - Market size and forecast 2025-2030 ($ million)
Chart on SMEs - Year-over-year growth 2025-2030 (%)
Data Table on SMEs - Year-over-year growth 2025-2030 (%)

10.5 Market opportunity by Market Segmentation by Organization Size

Market opportunity by Market Segmentation by Organization Size ($ million)
Data Table on Market opportunity by Market Segmentation by Organization Size ($ million)

11. Customer Landscape

11.1 Customer landscape overview

Analysis of price sensitivity, lifecycle, customer purchase basket, adoption rates, and purchase criteria

12. Geographic Landscape

12.1 Geographic segmentation

Chart on Market share by geography 2025-2030 (%)
Data Table on Market share by geography 2025-2030 (%)

12.2 Geographic comparison

Chart on Geographic comparison
Data Table on Geographic comparison

12.3 North America - Market size and forecast 2025-2030

Chart on North America - Market size and forecast 2025-2030 ($ million)
Data Table on North America - Market size and forecast 2025-2030 ($ million)
Chart on North America - Year-over-year growth 2025-2030 (%)
Data Table on North America - Year-over-year growth 2025-2030 (%)
Chart on Regional Comparison - North America
Data Table on Regional Comparison - North America

12.3.1 US - Market size and forecast 2025-2030

Chart on US - Market size and forecast 2025-2030 ($ million)
Data Table on US - Market size and forecast 2025-2030 ($ million)
Chart on US - Year-over-year growth 2025-2030 (%)
Data Table on US - Year-over-year growth 2025-2030 (%)

12.3.2 Canada - Market size and forecast 2025-2030

Chart on Canada - Market size and forecast 2025-2030 ($ million)
Data Table on Canada - Market size and forecast 2025-2030 ($ million)
Chart on Canada - Year-over-year growth 2025-2030 (%)
Data Table on Canada - Year-over-year growth 2025-2030 (%)

12.3.3 Mexico - Market size and forecast 2025-2030

Chart on Mexico - Market size and forecast 2025-2030 ($ million)
Data Table on Mexico - Market size and forecast 2025-2030 ($ million)
Chart on Mexico - Year-over-year growth 2025-2030 (%)
Data Table on Mexico - Year-over-year growth 2025-2030 (%)

12.4 Europe - Market size and forecast 2025-2030

Chart on Europe - Market size and forecast 2025-2030 ($ million)
Data Table on Europe - Market size and forecast 2025-2030 ($ million)
Chart on Europe - Year-over-year growth 2025-2030 (%)
Data Table on Europe - Year-over-year growth 2025-2030 (%)
Chart on Regional Comparison - Europe
Data Table on Regional Comparison - Europe

12.4.1 Germany - Market size and forecast 2025-2030

Chart on Germany - Market size and forecast 2025-2030 ($ million)
Data Table on Germany - Market size and forecast 2025-2030 ($ million)
Chart on Germany - Year-over-year growth 2025-2030 (%)
Data Table on Germany - Year-over-year growth 2025-2030 (%)

12.4.2 UK - Market size and forecast 2025-2030

Chart on UK - Market size and forecast 2025-2030 ($ million)
Data Table on UK - Market size and forecast 2025-2030 ($ million)
Chart on UK - Year-over-year growth 2025-2030 (%)
Data Table on UK - Year-over-year growth 2025-2030 (%)

12.4.3 France - Market size and forecast 2025-2030

Chart on France - Market size and forecast 2025-2030 ($ million)
Data Table on France - Market size and forecast 2025-2030 ($ million)
Chart on France - Year-over-year growth 2025-2030 (%)
Data Table on France - Year-over-year growth 2025-2030 (%)

12.4.4 Italy - Market size and forecast 2025-2030

Chart on Italy - Market size and forecast 2025-2030 ($ million)
Data Table on Italy - Market size and forecast 2025-2030 ($ million)
Chart on Italy - Year-over-year growth 2025-2030 (%)
Data Table on Italy - Year-over-year growth 2025-2030 (%)

12.4.5 Spain - Market size and forecast 2025-2030

Chart on Spain - Market size and forecast 2025-2030 ($ million)
Data Table on Spain - Market size and forecast 2025-2030 ($ million)
Chart on Spain - Year-over-year growth 2025-2030 (%)
Data Table on Spain - Year-over-year growth 2025-2030 (%)

12.4.6 The Netherlands - Market size and forecast 2025-2030

Chart on The Netherlands - Market size and forecast 2025-2030 ($ million)
Data Table on The Netherlands - Market size and forecast 2025-2030 ($ million)
Chart on The Netherlands - Year-over-year growth 2025-2030 (%)
Data Table on The Netherlands - Year-over-year growth 2025-2030 (%)

12.5 APAC - Market size and forecast 2025-2030

Chart on APAC - Market size and forecast 2025-2030 ($ million)
Data Table on APAC - Market size and forecast 2025-2030 ($ million)
Chart on APAC - Year-over-year growth 2025-2030 (%)
Data Table on APAC - Year-over-year growth 2025-2030 (%)
Chart on Regional Comparison - APAC
Data Table on Regional Comparison - APAC

12.5.1 China - Market size and forecast 2025-2030

Chart on China - Market size and forecast 2025-2030 ($ million)
Data Table on China - Market size and forecast 2025-2030 ($ million)
Chart on China - Year-over-year growth 2025-2030 (%)
Data Table on China - Year-over-year growth 2025-2030 (%)

12.5.2 Japan - Market size and forecast 2025-2030

Chart on Japan - Market size and forecast 2025-2030 ($ million)
Data Table on Japan - Market size and forecast 2025-2030 ($ million)
Chart on Japan - Year-over-year growth 2025-2030 (%)
Data Table on Japan - Year-over-year growth 2025-2030 (%)

12.5.3 India - Market size and forecast 2025-2030

Chart on India - Market size and forecast 2025-2030 ($ million)
Data Table on India - Market size and forecast 2025-2030 ($ million)
Chart on India - Year-over-year growth 2025-2030 (%)
Data Table on India - Year-over-year growth 2025-2030 (%)

12.5.4 South Korea - Market size and forecast 2025-2030

Chart on South Korea - Market size and forecast 2025-2030 ($ million)
Data Table on South Korea - Market size and forecast 2025-2030 ($ million)
Chart on South Korea - Year-over-year growth 2025-2030 (%)
Data Table on South Korea - Year-over-year growth 2025-2030 (%)

12.5.5 Australia - Market size and forecast 2025-2030

Chart on Australia - Market size and forecast 2025-2030 ($ million)
Data Table on Australia - Market size and forecast 2025-2030 ($ million)
Chart on Australia - Year-over-year growth 2025-2030 (%)
Data Table on Australia - Year-over-year growth 2025-2030 (%)

12.5.6 Indonesia - Market size and forecast 2025-2030

Chart on Indonesia - Market size and forecast 2025-2030 ($ million)
Data Table on Indonesia - Market size and forecast 2025-2030 ($ million)
Chart on Indonesia - Year-over-year growth 2025-2030 (%)
Data Table on Indonesia - Year-over-year growth 2025-2030 (%)

12.6 South America - Market size and forecast 2025-2030

Chart on South America - Market size and forecast 2025-2030 ($ million)
Data Table on South America - Market size and forecast 2025-2030 ($ million)
Chart on South America - Year-over-year growth 2025-2030 (%)
Data Table on South America - Year-over-year growth 2025-2030 (%)
Chart on Regional Comparison - South America
Data Table on Regional Comparison - South America

12.6.1 Brazil - Market size and forecast 2025-2030

Chart on Brazil - Market size and forecast 2025-2030 ($ million)
Data Table on Brazil - Market size and forecast 2025-2030 ($ million)
Chart on Brazil - Year-over-year growth 2025-2030 (%)
Data Table on Brazil - Year-over-year growth 2025-2030 (%)

12.6.2 Argentina - Market size and forecast 2025-2030

Chart on Argentina - Market size and forecast 2025-2030 ($ million)
Data Table on Argentina - Market size and forecast 2025-2030 ($ million)
Chart on Argentina - Year-over-year growth 2025-2030 (%)
Data Table on Argentina - Year-over-year growth 2025-2030 (%)

12.6.3 Chile - Market size and forecast 2025-2030

Chart on Chile - Market size and forecast 2025-2030 ($ million)
Data Table on Chile - Market size and forecast 2025-2030 ($ million)
Chart on Chile - Year-over-year growth 2025-2030 (%)
Data Table on Chile - Year-over-year growth 2025-2030 (%)

12.7 Middle East and Africa - Market size and forecast 2025-2030

Chart on Middle East and Africa - Market size and forecast 2025-2030 ($ million)
Data Table on Middle East and Africa - Market size and forecast 2025-2030 ($ million)
Chart on Middle East and Africa - Year-over-year growth 2025-2030 (%)
Data Table on Middle East and Africa - Year-over-year growth 2025-2030 (%)
Chart on Regional Comparison - Middle East and Africa
Data Table on Regional Comparison - Middle East and Africa

12.7.1 Saudi Arabia - Market size and forecast 2025-2030

Chart on Saudi Arabia - Market size and forecast 2025-2030 ($ million)
Data Table on Saudi Arabia - Market size and forecast 2025-2030 ($ million)
Chart on Saudi Arabia - Year-over-year growth 2025-2030 (%)
Data Table on Saudi Arabia - Year-over-year growth 2025-2030 (%)

12.7.2 UAE - Market size and forecast 2025-2030

Chart on UAE - Market size and forecast 2025-2030 ($ million)
Data Table on UAE - Market size and forecast 2025-2030 ($ million)
Chart on UAE - Year-over-year growth 2025-2030 (%)
Data Table on UAE - Year-over-year growth 2025-2030 (%)

12.7.3 South Africa - Market size and forecast 2025-2030

Chart on South Africa - Market size and forecast 2025-2030 ($ million)
Data Table on South Africa - Market size and forecast 2025-2030 ($ million)
Chart on South Africa - Year-over-year growth 2025-2030 (%)
Data Table on South Africa - Year-over-year growth 2025-2030 (%)

12.7.4 Israel - Market size and forecast 2025-2030

Chart on Israel - Market size and forecast 2025-2030 ($ million)
Data Table on Israel - Market size and forecast 2025-2030 ($ million)
Chart on Israel - Year-over-year growth 2025-2030 (%)
Data Table on Israel - Year-over-year growth 2025-2030 (%)

12.7.5 Turkey - Market size and forecast 2025-2030

Chart on Turkey - Market size and forecast 2025-2030 ($ million)
Data Table on Turkey - Market size and forecast 2025-2030 ($ million)
Chart on Turkey - Year-over-year growth 2025-2030 (%)
Data Table on Turkey - Year-over-year growth 2025-2030 (%)

12.8 Market opportunity by geography

Market opportunity by geography ($ million)
Data Tables on Market opportunity by geography ($ million)

13. Drivers, Challenges, and Opportunity

13.1 Market drivers

Increasing complexity of regulatory frameworks and trade agreements
Integration of advanced technologies and digital transformation initiatives
Strategic pursuit of operational efficiency and total landed cost optimization

13.2 Market challenges

Complexity of regulatory compliance and geopolitical volatility
Data fragmentation and lack of technological interoperability
Increasing capital expenditure and shortage of specialized technical talent

13.3 Impact of drivers and challenges

Impact of drivers and challenges in 2025 and 2030

13.4 Market opportunities

Proliferation of AI and machine learning for predictive compliance
Transition toward holistic and interconnected digital trade ecosystems
Emergence of ESG standards as core component of global trade governance

14. Competitive Landscape

14.1 Overview

14.2

Overview on criticality of inputs and factors of differentiation

14.3 Landscape disruption

Overview on factors of disruption

14.4 Industry risks

Impact of key risks on business

15. Competitive Analysis

15.1 Companies profiled

Companies covered

15.2 Company ranking index

15.3 Market positioning of companies

Matrix on companies position and classification

15.4 AEB SE

AEB SE - Overview
AEB SE - Product / Service
AEB SE - Key offerings
SWOT

15.5 Avalara Inc.

Avalara Inc. - Overview
Avalara Inc. - Product / Service
Avalara Inc. - Key offerings
SWOT

15.6 Blue Yonder Group Inc.

Blue Yonder Group Inc. - Overview
Blue Yonder Group Inc. - Product / Service
Blue Yonder Group Inc. - Key offerings
SWOT

15.7 Coupa Software Inc.

Coupa Software Inc. - Overview
Coupa Software Inc. - Product / Service
Coupa Software Inc. - Key offerings
SWOT

15.8 Descartes Systems Group Inc.

Descartes Systems Group Inc. - Overview
Descartes Systems Group Inc. - Business segments
Descartes Systems Group Inc. - Key offerings
Descartes Systems Group Inc. - Segment focus
SWOT

15.9 E2open Parent Holdings Inc.

E2open Parent Holdings Inc. - Overview
E2open Parent Holdings Inc. - Product / Service
E2open Parent Holdings Inc. - Key offerings
SWOT

15.10 Enuit LLC

Enuit LLC - Overview
Enuit LLC - Product / Service
Enuit LLC - Key offerings
SWOT

15.11 Infor Inc.

Infor Inc. - Overview
Infor Inc. - Product / Service
Infor Inc. - Key offerings
SWOT

15.12 ION Group.

ION Group. - Overview
ION Group. - Product / Service
ION Group. - Key offerings
SWOT

15.13 Logility SCS Inc.

Logility SCS Inc. - Overview
Logility SCS Inc. - Product / Service
Logility SCS Inc. - Key offerings
SWOT

15.14 Oracle Corp.

Oracle Corp. - Overview
Oracle Corp. - Business segments
Oracle Corp. - Key news
Oracle Corp. - Key offerings
Oracle Corp. - Segment focus
SWOT

15.15 QAD Inc.

QAD Inc. - Overview
QAD Inc. - Product / Service
QAD Inc. - Key offerings
SWOT

15.16 SAP SE

SAP SE - Overview
SAP SE - Business segments
SAP SE - Key news
SAP SE - Key offerings
SAP SE - Segment focus
SWOT

15.17 Thomson Reuters Corp.

Thomson Reuters Corp. - Overview
Thomson Reuters Corp. - Business segments
Thomson Reuters Corp. - Key offerings
Thomson Reuters Corp. - Segment focus
SWOT

15.18 WiseTech Global Ltd.

WiseTech Global Ltd. - Overview
WiseTech Global Ltd. - Product / Service
WiseTech Global Ltd. - Key offerings
SWOT

16. Appendix

16.1 Scope of the report

Market definition
Objectives
Notes and caveats

16.2 Inclusions and exclusions checklist

Inclusions checklist
Exclusions checklist

16.3 Currency conversion rates for US$

16.4 Research methodology

16.5 Data procurement

Information sources

16.6 Data validation

16.7 Validation techniques employed for market sizing

16.8 Data synthesis

16.9 360 degree market analysis

16.10 List of abbreviations

Research Methodology

Technavio presents a detailed picture of the market by way of study, synthesis, and summation of data from multiple sources. The analysts have presented the various facets of the market with a particular focus on identifying the key industry influencers. The data thus presented is comprehensive, reliable, and the result of extensive research, both primary and secondary.

INFORMATION SOURCES

Primary sources

  • Manufacturers and suppliers
  • Channel partners
  • Industry experts
  • Strategic decision makers

Secondary sources

  • Industry journals and periodicals
  • Government data
  • Financial reports of key industry players
  • Historical data
  • Press releases

DATA ANALYSIS

Data Synthesis

  • Collation of data
  • Estimation of key figures
  • Analysis of derived insights

Data Validation

  • Triangulation with data models
  • Reference against proprietary databases
  • Corroboration with industry experts

REPORT WRITING

Qualitative

  • Market drivers
  • Market challenges
  • Market trends
  • Five forces analysis

Quantitative

  • Market size and forecast
  • Market segmentation
  • Geographical insights
  • Competitive landscape

Interested in this report?

Get your sample now to see our research methodology and insights!

Download Now

Frequently Asked Questions

Trade Management Software market growth will increase by USD 1414.8 million during 2026-2030.

The Trade Management Software market is expected to grow at a CAGR of 10.9% during 2026-2030.

Trade Management Software market is segmented by Deployment (Cloud-based, On premises) End-user (Retail and consumer goods, IT and telecom, Automotive, Transportation and logistics, Others) Organization size (Large enterprises, SMEs)

AEB SE, Amphora Inc., Avalara Inc., Bamboo Rose LLC, Blue Yonder Group Inc., Coupa Software Inc., Descartes Systems Group Inc., E2open Parent Holdings Inc., Enuit LLC, Infor Inc., ION Group., Logility SCS Inc., Magaya Corp., MIC Datenverarbeitung GmbH, Oracle Corp., QAD Inc., Quor Group, SAP SE, Thomson Reuters Corp., WiseTech Global Ltd. are a few of the key vendors in the Trade Management Software market.

North America will register the highest growth rate of 32.4% among the other regions. Therefore, the Trade Management Software market in North America is expected to garner significant business opportunities for the vendors during the forecast period.

US, Canada, Mexico, Germany, UK, France, Italy, Spain, The Netherlands, China, Japan, India, South Korea, Australia, Indonesia, Brazil, Argentina, Chile, Saudi Arabia, UAE, South Africa, Israel, Turkey

  • Increasing complexity of regulatory frameworks and trade agreements is the driving factor this market.

The Trade Management Software market vendors should focus on grabbing business opportunities from the Deployment segment as it accounted for the largest market share in the base year.
RIA - Research AI Assistant
Ask RIA
