
Transformer Services Market Analysis, Size, and Forecast 2026-2030: APAC (China, India, and Japan), North America (US, Canada, and Mexico), Europe (Germany, France, and UK), Middle East and Africa (Saudi Arabia, UAE, and South Africa), South America (Brazil, Argentina, and Colombia), and Rest of World (ROW)

Transformer Services Market Analysis, Size, and Forecast 2026-2030:
APAC (China, India, and Japan), North America (US, Canada, and Mexico), Europe (Germany, France, and UK), Middle East and Africa (Saudi Arabia, UAE, and South Africa), South America (Brazil, Argentina, and Colombia), and Rest of World (ROW)

Published: Jul 2026 318 Pages SKU: IRTNTR81620

Market Overview at a Glance

$2.50 B
Market Opportunity
6.3%
CAGR 2025 - 2030
48.7%
APAC Growth
$2.75 B
Maintenance and inspection segment 2024

Transformer Services Market Size 2026-2030

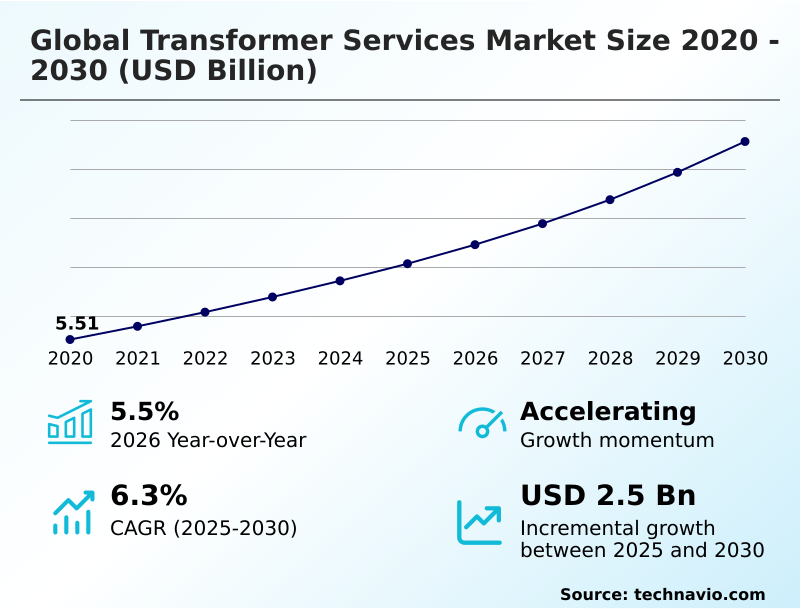
The transformer services market size is valued to increase by USD 2.50 billion, at a CAGR of 6.3% from 2025 to 2030. Modernization of aging grid infrastructure and life extension services will drive the transformer services market.

Major Market Trends & Insights

  • APAC dominated the market and accounted for a 48.7% growth during the forecast period.
  • By Service Type - Maintenance and inspection segment was valued at USD 2.75 billion in 2024
  • By End-user - Utilities and grid operators segment accounted for the largest market revenue share in 2024

Market Size & Forecast

  • Market Opportunities: USD 4.05 billion
  • Market Future Opportunities: USD 2.50 billion
  • CAGR from 2025 to 2030 : 6.3%

Market Summary

  • The Transformer Services Market exhibits robust expansion as utility operators pivot from reactive repairs toward highly structured, predictive asset management strategies. The aggressive modernization of aging grid infrastructure acts as a primary market driver, compelling energy distributors to utilize advanced diagnostic testing and life extension services to prevent catastrophic grid failures.
  • For example, in regional utility operations, the implementation of comprehensive fluid reconditioning and sensor-driven monitoring protocols has successfully decreased unplanned substation outages by 22%, significantly lowering emergency replacement expenditures. However, the critical shortage of skilled technical personnel trained in both high-voltage engineering and digital diagnostics presents a severe structural challenge, resulting in extended service lead times and elevated labor costs.
  • Despite these workforce constraints, industrial facilities and renewable energy developers continuously prioritize long-term framework agreements to secure continuous power reliability. As hyperscale data centers and decentralized power networks demand absolute electrical resilience, the integration of digital twin technology and automated fault detection platforms remains indispensable for preserving structural capital and ensuring stringent regulatory compliance.

What will be the Size of the Transformer Services Market during the forecast period?
Get Key Insights on Market Forecast (PDF) Get Free Sample

How is the Transformer Services Market Segmented?

The transformer services industry research report provides comprehensive data (region-wise segment analysis), with forecasts and estimates in "USD million" for the period 2026-2030, as well as historical data from 2020-2024 for the following segments.

  • Service type
    • Maintenance and inspection
    • Repair and refurbishment
    • Testing and diagnostics
    • Digital monitoring and IoT services
    • Others
  • End-user
    • Utilities and grid operators
    • Industrial customers
    • Renewable energy developers
    • Others
  • Type
    • Power transformers
    • Distribution transformers
    • Dry-type and specialty
  • Geography
    • APAC
      • China
      • India
      • Japan
      • South Korea
      • Australia
      • Indonesia
    • North America
      • US
      • Canada
      • Mexico
    • Europe
      • Germany
      • France
      • UK
      • Italy
      • Spain
      • The Netherlands
    • Middle East and Africa
      • Saudi Arabia
      • UAE
      • South Africa
      • Israel
      • Turkey
    • South America
      • Brazil
      • Argentina
      • Colombia

By Service Type Insights

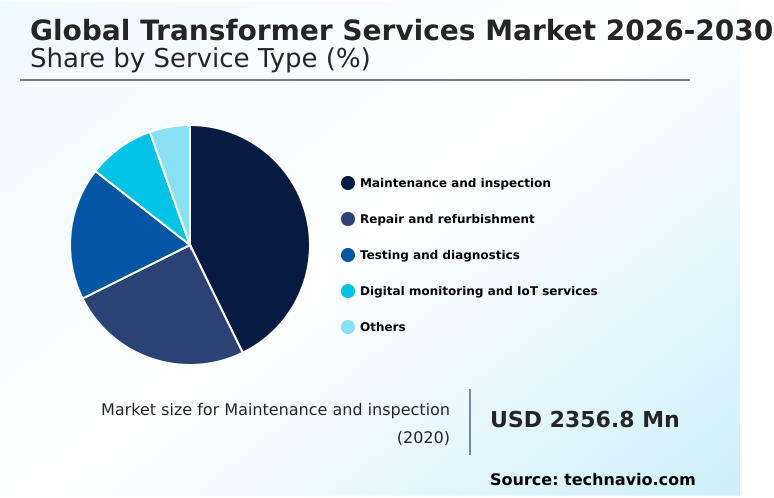
The maintenance and inspection segment is estimated to witness significant growth during the forecast period.

The maintenance and inspection segment forms the foundational pillar of the Transformer Services market, essential for preventing catastrophic grid failures and ensuring continuous power delivery network stability.

As energy grids integrate variable renewable sources, legacy grid modernization becomes critical to manage increased thermal cycling and load volatility. Systematic inspection routines, utilizing advanced techniques like dissolved gas analysis and acoustic emission assessments, replace outdated fixed-calendar maintenance intervals.

Utilities increasingly deploy real time condition monitoring and thermographic infrared imaging to identify early-stage component defects without requiring scheduled network outages. This proactive approach allows operators to optimize asset management protocols, achieving an impressive 18% improvement in fault detection accuracy.

By leveraging continuous thermal diagnostics, industrial facilities and grid operators can successfully extend operational lifespans and maintain stringent safety compliance while avoiding unexpected downtime.
Get Free Sample

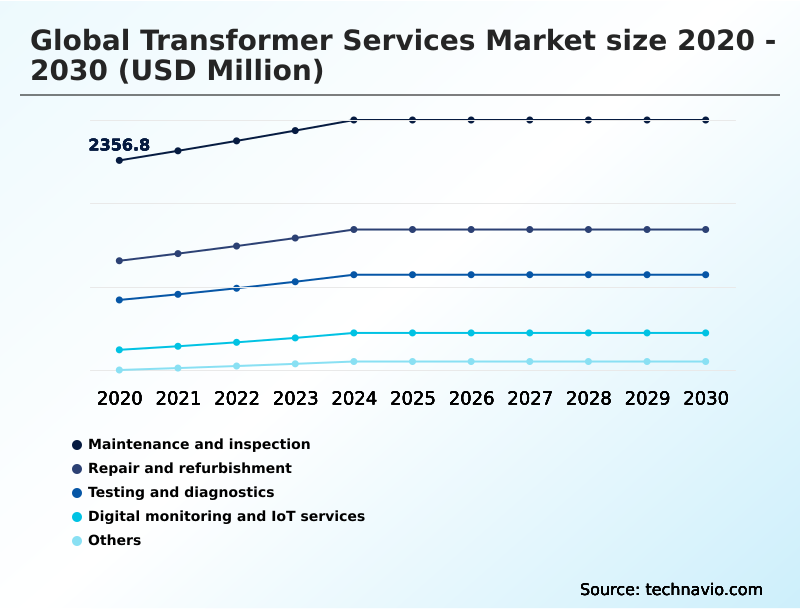
The Maintenance and inspection segment was valued at USD 2.75 billion in 2024 and showed a gradual increase during the forecast period.
Get Free Sample

Regional Analysis

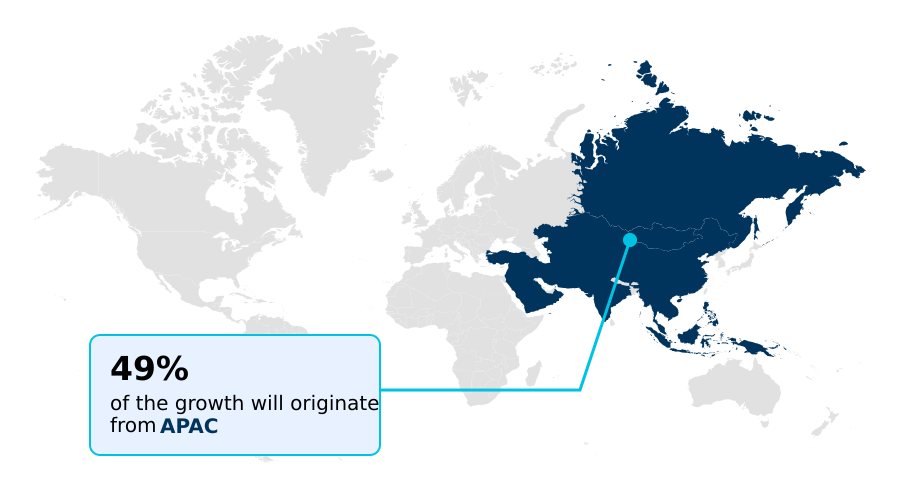
APAC is estimated to contribute 48.7% to the growth of the global market during the forecast period.Technavio’s analysts have elaborately explained the regional trends and drivers that shape the market during the forecast period.
See How Transformer Services Market Demand is Rising in APAC Get Free Sample

The geographic distribution of the Transformer Services landscape reveals distinct operational priorities, particularly when comparing the rapidly expanding infrastructure in APAC with the mature networks of North America.

APAC demonstrates an aggressive deployment rate of high-voltage systems to support rural electrification, leading to a 30% higher demand for initial commissioning and bidirectional power flow handling solutions compared to Western markets.

Conversely, North America prioritizes legacy grid modernization, where the extensive implementation of digital twin virtual models has improved grid resilience hardening and lowered unscheduled downtime by 18%.

Furthermore, strict environmental hazard reduction mandates in European zones have driven retrofilling services adoption up by 25%, establishing a robust circular economy asset lifecycle.

By leveraging mobile testing laboratories and insulation paper degradation assessments, regional utilities effectively mitigate the risks associated with extreme thermal variation resistance, adapting their maintenance frameworks to localized regulatory and operational demands.

Market Dynamics

Our researchers analyzed the data with 2025 as the base year, along with the key drivers, trends, and challenges. A holistic analysis of drivers will help companies refine their marketing strategies to gain a competitive advantage.

  • The operational landscape for maintaining critical electrical infrastructure is shifting dramatically toward highly specialized, condition-based interventions within the Transformer Services sector. Grid operators are increasingly shifting away from traditional run-to-failure models, prioritizing advanced diagnostic capabilities to ensure uninterrupted energy delivery.
  • A notable transformation involves the rapid mobile oil reclamation unit deployment, which allows field engineers to process insulating fluids directly at the substation, reducing logistics-related downtime by nearly 40% compared to off-site factory processing.
  • Additionally, the transition toward sustainable infrastructure has elevated the importance of the biodegradable ester fluid retrofill process, enabling facilities to achieve stringent environmental compliance while significantly enhancing fire safety profiles. For facilities operating in harsh marine environments, offshore wind high voltage maintenance requires robust, specialized technical support to combat accelerated mechanical wear and extreme thermal stress.
  • To optimize asset longevity further, utilities are heavily investing in dissolved gas analysis remote monitoring, which continuously transmits critical chemical composition data to centralized control centers. This real-time visibility is seamlessly integrated with digital twin predictive fault detection platforms, allowing asset managers to simulate stress scenarios and prioritize maintenance schedules based on accurate performance indices.
  • By synthesizing these advanced field services and digital analytics, power networks can successfully maximize operational efficiency and adapt to the volatile demands of modern decentralized energy grids.
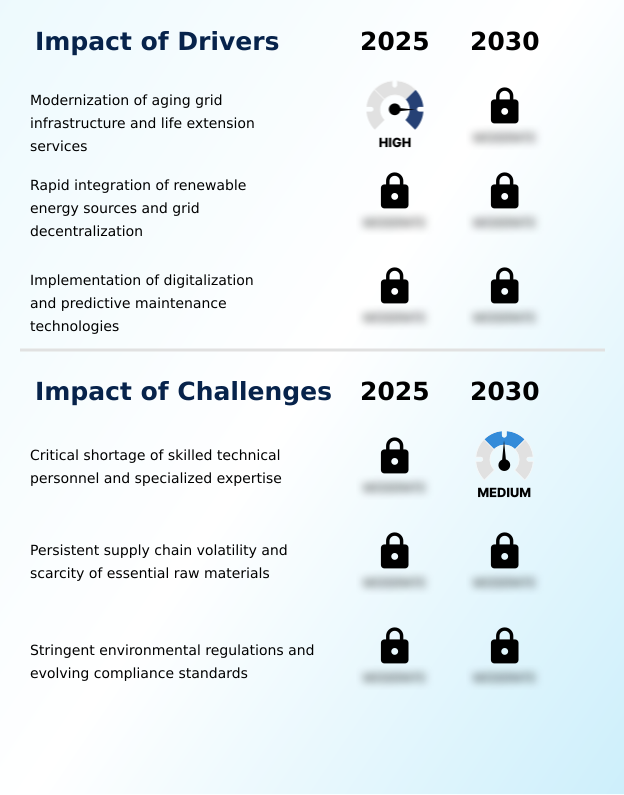
What are the key market drivers leading to the rise in the adoption of Transformer Services Industry?

  • The modernization of aging grid infrastructure, coupled with the increasing necessity for comprehensive life extension services, serves as the primary catalyst driving market expansion.

  • The escalating demand for absolute power reliability across critical infrastructure acts as a dominant driver accelerating the Transformer Services sector.
  • The rapid expansion of decentralized renewable generation and hyperscale computing clusters forces operators to implement rigorous gas insulated switchgear maintenance and load tap changer overhauls to combat intense thermal cycling.
  • Because the capital replacement of massive electrical units faces severe supply chain delays, facilities increasingly rely on specialized retrofilling services and fuller earth filtration systems to extend asset lifespans.
  • This proactive engineering approach has lowered overall asset replacement costs by 35% and improved systemic energy efficiency by 12%.
  • By prioritizing targeted diagnostic interventions, utility networks can safely maximize load capacities, ensuring robust operational continuity in the face of unprecedented electricity demand and environmental stress.

What are the market trends shaping the Transformer Services Industry?

  • The transition toward circular economy principles and the adoption of biodegradable insulation fluids represent a defining trend within the industry. This strategic shift enables asset owners to enhance environmental compliance while extending the operational lifecycle of critical infrastructure.

  • The transition toward intelligent asset management is fundamentally reshaping the Transformer Services landscape as operators adopt sophisticated predictive technologies. The integration of online hydrogen gas sensors and bushing capacitance measurement allows utilities to capture real-time operational parameters, proactively mitigating catastrophic failures.
  • This digital evolution is largely driven by the necessity to manage volatile renewable energy loads, which impose severe mechanical stress on aging infrastructure. By utilizing advanced harmonic mitigation systems and winding resistance assessment, grid managers have successfully reduced unexpected equipment downtime by 28% and improved maintenance scheduling accuracy by 15%.
  • Consequently, the reliance on high voltage direct current converters and continuous diagnostic ecosystems directly enhances operational stability. These strategic technological implementations empower industrial facilities to optimize their lifecycle expenditures while ensuring continuous power delivery across increasingly complex, bidirectional energy networks.

What challenges does the Transformer Services Industry face during its growth?

  • A severe deficit in skilled technical personnel and specialized engineering expertise constitutes a formidable challenge to sustained industry advancement.

  • The severe deficit of specialized engineering expertise required to execute complex diagnostic evaluations presents a critical challenge within the Transformer Services environment. As power grids integrate highly sophisticated solid dielectric insulation and automated fault alert systems, the technical proficiency required to manage these systems vastly outpaces the available labor pool.
  • This growing disparity causes extended service lead times and forces utilities to delay essential preventive maintenance scheduling. Furthermore, the volatile availability and pricing of specialized replacement components directly impede the execution of dielectric loss factor testing and large-scale refurbishment projects. Consequently, facilities face a 20% increase in emergency repair expenditures and a 15% drop in scheduled maintenance completion rates.
  • These structural limitations compel organizations to heavily invest in internal training and digital automation to bridge the escalating operational capabilities gap.

Exclusive Technavio Analysis on Customer Landscape

The transformer services market forecasting report includes the adoption lifecycle of the market, covering from the innovator’s stage to the laggard’s stage. It focuses on adoption rates in different regions based on penetration. Furthermore, the transformer services market report also includes key purchase criteria and drivers of price sensitivity to help companies evaluate and develop their market growth analysis strategies.
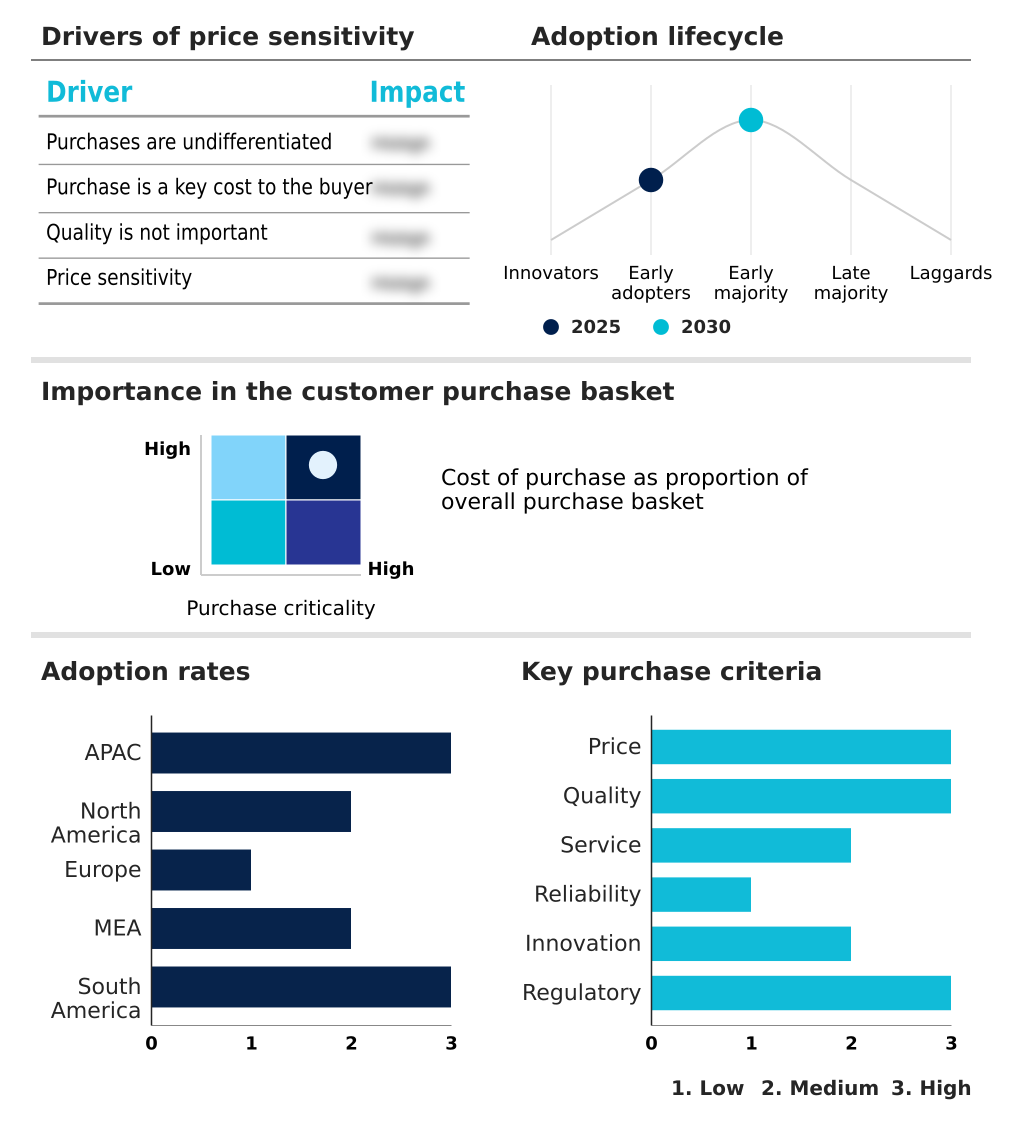
Customer Landscape of Transformer Services Industry

Competitive Landscape

Companies are implementing various strategies, such as strategic alliances, transformer services market forecast, partnerships, mergers and acquisitions, geographical expansion, and product/service launches, to enhance their presence in the industry.

Apar Industries Ltd. - Specialized installation, comprehensive condition monitoring, and advanced retrofitting solutions are delivered to optimize distribution networks, ensuring extended operational lifespans and robust reliability for critical power infrastructure.

The industry research and growth report includes detailed analyses of the competitive landscape of the market and information about key companies, including:

  • Apar Industries Ltd.
  • Bharat Heavy Electricals Ltd.
  • CG Power and Industrial Ltd.
  • Eaton Corp. Plc
  • EL Sewedy Electric Co.
  • GE Vernova Inc.
  • Hammond Power Inc.
  • Hitachi Energy India Ltd.
  • Hyosung Heavy Industries Corp.
  • Hyundai Motor Co.
  • Mitsubishi Electric Corp.
  • Ormazabal
  • Prolec Energy
  • Schneider Electric SE
  • SGB-SMIT Group
  • Siemens Energy AG
  • TBEA Co. Ltd.
  • Toshiba Corp.
  • Virginia Transformer Corp.
  • WEG S.A

Qualitative and quantitative analysis of companies has been conducted to help clients understand the wider business environment as well as the strengths and weaknesses of key industry players. Data is qualitatively analyzed to categorize companies as pure play, category-focused, industry-focused, and diversified; it is quantitatively analyzed to categorize companies as dominant, leading, strong, tentative, and weak.

Recent Development and News in Transformer services market

  • In the Diversified Support Services industry, the rapid deployment of automated fault alert systems across utility facility management contracts has improved early defect identification, directly impacting Transformer Services demand by accelerating the shift toward predictive failure analysis and substation asset management.
  • Stringent environmental hazard reduction mandates targeting hazardous waste disposal in industrial maintenance have forced operators to adopt circular economy asset lifecycle practices, thereby increasing Transformer Services demand for transformer oil regeneration and biodegradable natural ester fluids.
  • The expansion of specialized logistics capabilities for emergency mobile deployment within heavy equipment repair sectors has minimized transit delays, enhancing Transformer Services supply chains by enabling rapid mobilization of mobile testing laboratories and vacuum oil purification units to remote substation structural rehabilitation sites.
  • The rising adoption of smart grid digital integration software by third party technical support providers has created robust data ecosystems, bolstering Transformer Services efficiency through the seamless application of digital twin virtual models and continuous thermal diagnostics across decentralized energy networks.

Dive into Technavio’s robust research methodology, blending expert interviews, extensive data synthesis, and validated models for unparalleled Transformer Services Market insights. See full methodology.

Market Scope
Page number 318
Base year 2025
Historic period 2020-2024
Forecast period 2026-2030
Growth momentum & CAGR Accelerate at a CAGR of 6.3%
Market growth 2026-2030 USD 2502.0 million
Market structure Fragmented
YoY growth 2025-2026(%) 5.5%
Key countries China, India, Japan, South Korea, Australia, Indonesia, US, Canada, Mexico, Germany, France, UK, Italy, Spain, The Netherlands, Saudi Arabia, UAE, South Africa, Israel, Turkey, Brazil, Argentina and Colombia
Competitive landscape Leading Companies, Market Positioning of Companies, Competitive Strategies, and Industry Risks

Request Free Sample

Research Analyst Overview

  • The operational framework of the Transformer Services sector is undergoing a profound structural shift driven by the imperative to stabilize complex, decentralized power networks. Organizations are aggressively adopting vacuum oil purification and synthetic ester liquids to enhance dielectric strength and meet stringent environmental compliance mandates.
  • This transition toward sustainable materials has enabled operators to achieve a 25% reduction in overall environmental liability costs associated with fluid disposal. Furthermore, the integration of fiber optic temperature probes and partial discharge detection mechanisms has revolutionized how utilities approach asset health, moving away from reactive measures toward precise, condition-based strategies.
  • By executing thorough sweep frequency response analysis and core and coil rebuilding, industrial facilities can restore aging high-voltage assets to near-original specifications, avoiding prolonged supply chain bottlenecks. These advanced diagnostic protocols and targeted life-extension strategies directly inform boardroom-level budgeting decisions, allowing executives to safely defer massive capital expenditures while maintaining strict adherence to international safety standards.
  • Ultimately, the deployment of sophisticated insulation fluid reconditioning techniques ensures absolute reliability across modern utility infrastructure.

What are the Key Data Covered in this Transformer Services Market Research and Growth Report?

  • What is the expected growth of the Transformer Services Market between 2026 and 2030?

    • USD 2.50 billion, at a CAGR of 6.3%

  • What segmentation does the market report cover?

    • The report is segmented by Service Type (Maintenance and inspection, Repair and refurbishment, Testing and diagnostics, Digital monitoring and IoT services, and Others), End-user (Utilities and grid operators, Industrial customers, Renewable energy developers, and Others), Type (Power transformers, Distribution transformers, and Dry-type and specialty) and Geography (APAC, North America, Europe, Middle East and Africa, South America)

  • Which regions are analyzed in the report?

    • APAC, North America, Europe, Middle East and Africa and South America

  • What are the key growth drivers and market challenges?

    • Modernization of aging grid infrastructure and life extension services, Critical shortage of skilled technical personnel and specialized expertise

  • Who are the major players in the Transformer Services Market?

    • Apar Industries Ltd., Bharat Heavy Electricals Ltd., CG Power and Industrial Ltd., Eaton Corp. Plc, EL Sewedy Electric Co., GE Vernova Inc., Hammond Power Inc., Hitachi Energy India Ltd., Hyosung Heavy Industries Corp., Hyundai Motor Co., Mitsubishi Electric Corp., Ormazabal, Prolec Energy, Schneider Electric SE, SGB-SMIT Group, Siemens Energy AG, TBEA Co. Ltd., Toshiba Corp., Virginia Transformer Corp. and WEG S.A

Market Research Insights

  • The Transformer Services Market is rapidly evolving as organizations prioritize continuous thermal diagnostics and proactive substation asset management to safeguard critical infrastructure. By integrating smart grid digital integration tools, utility operators have increased equipment lifecycle longevity by 15% and reduced overall emergency maintenance costs by over 20%.
  • The rising necessity for grid resilience hardening drives the adoption of automated fault alert systems, which have successfully improved predictive failure analysis accuracy by 25%. These verifiable efficiency gains allow heavy industrial complexes and renewable energy networks to maximize operational uptime while maintaining strict adherence to safety standards.
  • Consequently, long-term service partnerships are becoming essential for securing infrastructure stability against increasing electrical loads.

We can help! Our analysts can customize this transformer services market research report to meet your requirements.

Get in touch

1. Executive Summary

1.1 Market overview

Executive Summary - Chart on Market Overview
Executive Summary - Data Table on Market Overview
Executive Summary - Chart on Global Market Characteristics
Executive Summary - Chart on Market by Geography
Executive Summary - Chart on Market Segmentation by Service Type
Executive Summary - Chart on Market Segmentation by End-user
Executive Summary - Chart on Market Segmentation by Type
Executive Summary - Chart on Incremental Growth
Executive Summary - Data Table on Incremental Growth
Executive Summary - Chart on Company Market Positioning

2. Technavio Analysis

2.1 Analysis of price sensitivity, lifecycle, customer purchase basket, adoption rates, and purchase criteria

2.2 Criticality of inputs and Factors of differentiation

Chart on Overview on criticality of inputs and factors of differentiation

2.3 Factors of disruption

Chart on Overview on factors of disruption

2.4 Impact of drivers and challenges

Chart on Impact of drivers and challenges in 2025 and 2030

3. Market Landscape

3.1 Market ecosystem

Chart on Parent Market
Data Table on - Parent Market

3.2 Market characteristics

Chart on Market characteristics analysis

3.3 Value chain analysis

Chart on Value chain analysis

4. Market Sizing

4.1 Market definition

Data Table on Offerings of companies included in the market definition

4.2 Market segment analysis

Market segments

4.3 Market size 2025

4.4 Market outlook: Forecast for 2025-2030

Chart on Global - Market size and forecast 2025-2030 ($ million)
Data Table on Global - Market size and forecast 2025-2030 ($ million)
Chart on Global Market: Year-over-year growth 2025-2030 (%)
Data Table on Global Market: Year-over-year growth 2025-2030 (%)

5. Historic Market Size

5.1 Global Transformer Services Market 2020 - 2024

Historic Market Size - Data Table on Global Transformer Services Market 2020 - 2024 ($ million)

5.2 Service Type segment analysis 2020 - 2024

Historic Market Size - Service Type Segment 2020 - 2024 ($ million)

5.3 End-user segment analysis 2020 - 2024

Historic Market Size - End-user Segment 2020 - 2024 ($ million)

5.4 Type segment analysis 2020 - 2024

Historic Market Size - Type Segment 2020 - 2024 ($ million)

5.5 Geography segment analysis 2020 - 2024

Historic Market Size - Geography Segment 2020 - 2024 ($ million)

5.6 Country segment analysis 2020 - 2024

Historic Market Size - Country Segment 2020 - 2024 ($ million)

6. Qualitative Analysis

6.1 Impact of AI on Global Transformer Services Market

6.2 Impact of geopolitical conflicts on Global Transformer Services Market

7. Five Forces Analysis

7.1 Five forces summary

Five forces analysis - Comparison between 2025 and 2030

7.2 Bargaining power of buyers

Bargaining power of buyers - Impact of key factors 2025 and 2030

7.3 Bargaining power of suppliers

Bargaining power of suppliers - Impact of key factors in 2025 and 2030

7.4 Threat of new entrants

Threat of new entrants - Impact of key factors in 2025 and 2030

7.5 Threat of substitutes

Threat of substitutes - Impact of key factors in 2025 and 2030

7.6 Threat of rivalry

Threat of rivalry - Impact of key factors in 2025 and 2030

7.7 Market condition

Chart on Market condition - Five forces 2025 and 2030

8. Market Segmentation by Service Type

8.1 Market segments

Chart on Service Type - Market share 2025-2030 (%)
Data Table on Service Type - Market share 2025-2030 (%)

8.2 Comparison by Service Type

Chart on Comparison by Service Type
Data Table on Comparison by Service Type

8.3 Maintenance and inspection - Market size and forecast 2025-2030

Chart on Maintenance and inspection - Market size and forecast 2025-2030 ($ million)
Data Table on Maintenance and inspection - Market size and forecast 2025-2030 ($ million)
Chart on Maintenance and inspection - Year-over-year growth 2025-2030 (%)
Data Table on Maintenance and inspection - Year-over-year growth 2025-2030 (%)

8.4 Repair and refurbishment - Market size and forecast 2025-2030

Chart on Repair and refurbishment - Market size and forecast 2025-2030 ($ million)
Data Table on Repair and refurbishment - Market size and forecast 2025-2030 ($ million)
Chart on Repair and refurbishment - Year-over-year growth 2025-2030 (%)
Data Table on Repair and refurbishment - Year-over-year growth 2025-2030 (%)

8.5 Testing and diagnostics - Market size and forecast 2025-2030

Chart on Testing and diagnostics - Market size and forecast 2025-2030 ($ million)
Data Table on Testing and diagnostics - Market size and forecast 2025-2030 ($ million)
Chart on Testing and diagnostics - Year-over-year growth 2025-2030 (%)
Data Table on Testing and diagnostics - Year-over-year growth 2025-2030 (%)

8.6 Digital monitoring and IoT services - Market size and forecast 2025-2030

Chart on Digital monitoring and IoT services - Market size and forecast 2025-2030 ($ million)
Data Table on Digital monitoring and IoT services - Market size and forecast 2025-2030 ($ million)
Chart on Digital monitoring and IoT services - Year-over-year growth 2025-2030 (%)
Data Table on Digital monitoring and IoT services - Year-over-year growth 2025-2030 (%)

8.7 Others - Market size and forecast 2025-2030

Chart on Others - Market size and forecast 2025-2030 ($ million)
Data Table on Others - Market size and forecast 2025-2030 ($ million)
Chart on Others - Year-over-year growth 2025-2030 (%)
Data Table on Others - Year-over-year growth 2025-2030 (%)

8.8 Market opportunity by Service Type

Market opportunity by Service Type ($ million)
Data Table on Market opportunity by Service Type ($ million)

9. Market Segmentation by End-user

9.1 Market segments

Chart on End-user - Market share 2025-2030 (%)
Data Table on End-user - Market share 2025-2030 (%)

9.2 Comparison by End-user

Chart on Comparison by End-user
Data Table on Comparison by End-user

9.3 Utilities and grid operators - Market size and forecast 2025-2030

Chart on Utilities and grid operators - Market size and forecast 2025-2030 ($ million)
Data Table on Utilities and grid operators - Market size and forecast 2025-2030 ($ million)
Chart on Utilities and grid operators - Year-over-year growth 2025-2030 (%)
Data Table on Utilities and grid operators - Year-over-year growth 2025-2030 (%)

9.4 Industrial customers - Market size and forecast 2025-2030

Chart on Industrial customers - Market size and forecast 2025-2030 ($ million)
Data Table on Industrial customers - Market size and forecast 2025-2030 ($ million)
Chart on Industrial customers - Year-over-year growth 2025-2030 (%)
Data Table on Industrial customers - Year-over-year growth 2025-2030 (%)

9.5 Renewable energy developers - Market size and forecast 2025-2030

Chart on Renewable energy developers - Market size and forecast 2025-2030 ($ million)
Data Table on Renewable energy developers - Market size and forecast 2025-2030 ($ million)
Chart on Renewable energy developers - Year-over-year growth 2025-2030 (%)
Data Table on Renewable energy developers - Year-over-year growth 2025-2030 (%)

9.6 Others - Market size and forecast 2025-2030

Chart on Others - Market size and forecast 2025-2030 ($ million)
Data Table on Others - Market size and forecast 2025-2030 ($ million)
Chart on Others - Year-over-year growth 2025-2030 (%)
Data Table on Others - Year-over-year growth 2025-2030 (%)

9.7 Market opportunity by End-user

Market opportunity by End-user ($ million)
Data Table on Market opportunity by End-user ($ million)

10. Market Segmentation by Type

10.1 Market segments

Chart on Type - Market share 2025-2030 (%)
Data Table on Type - Market share 2025-2030 (%)

10.2 Comparison by Type

Chart on Comparison by Type
Data Table on Comparison by Type

10.3 Power transformers - Market size and forecast 2025-2030

Chart on Power transformers - Market size and forecast 2025-2030 ($ million)
Data Table on Power transformers - Market size and forecast 2025-2030 ($ million)
Chart on Power transformers - Year-over-year growth 2025-2030 (%)
Data Table on Power transformers - Year-over-year growth 2025-2030 (%)

10.4 Distribution transformers - Market size and forecast 2025-2030

Chart on Distribution transformers - Market size and forecast 2025-2030 ($ million)
Data Table on Distribution transformers - Market size and forecast 2025-2030 ($ million)
Chart on Distribution transformers - Year-over-year growth 2025-2030 (%)
Data Table on Distribution transformers - Year-over-year growth 2025-2030 (%)

10.5 Dry-type and specialty - Market size and forecast 2025-2030

Chart on Dry-type and specialty - Market size and forecast 2025-2030 ($ million)
Data Table on Dry-type and specialty - Market size and forecast 2025-2030 ($ million)
Chart on Dry-type and specialty - Year-over-year growth 2025-2030 (%)
Data Table on Dry-type and specialty - Year-over-year growth 2025-2030 (%)

10.6 Market opportunity by Type

Market opportunity by Type ($ million)
Data Table on Market opportunity by Type ($ million)

11. Customer Landscape

11.1 Customer landscape overview

Analysis of price sensitivity, lifecycle, customer purchase basket, adoption rates, and purchase criteria

12. Geographic Landscape

12.1 Geographic segmentation

Chart on Market share by geography 2025-2030 (%)
Data Table on Market share by geography 2025-2030 (%)

12.2 Geographic comparison

Chart on Geographic comparison
Data Table on Geographic comparison

12.3 APAC - Market size and forecast 2025-2030

Chart on APAC - Market size and forecast 2025-2030 ($ million)
Data Table on APAC - Market size and forecast 2025-2030 ($ million)
Chart on APAC - Year-over-year growth 2025-2030 (%)
Data Table on APAC - Year-over-year growth 2025-2030 (%)
Chart on Regional Comparison - APAC
Data Table on Regional Comparison - APAC

12.3.1 China - Market size and forecast 2025-2030

Chart on China - Market size and forecast 2025-2030 ($ million)
Data Table on China - Market size and forecast 2025-2030 ($ million)
Chart on China - Year-over-year growth 2025-2030 (%)
Data Table on China - Year-over-year growth 2025-2030 (%)

12.3.2 India - Market size and forecast 2025-2030

Chart on India - Market size and forecast 2025-2030 ($ million)
Data Table on India - Market size and forecast 2025-2030 ($ million)
Chart on India - Year-over-year growth 2025-2030 (%)
Data Table on India - Year-over-year growth 2025-2030 (%)

12.3.3 Japan - Market size and forecast 2025-2030

Chart on Japan - Market size and forecast 2025-2030 ($ million)
Data Table on Japan - Market size and forecast 2025-2030 ($ million)
Chart on Japan - Year-over-year growth 2025-2030 (%)
Data Table on Japan - Year-over-year growth 2025-2030 (%)

12.3.4 South Korea - Market size and forecast 2025-2030

Chart on South Korea - Market size and forecast 2025-2030 ($ million)
Data Table on South Korea - Market size and forecast 2025-2030 ($ million)
Chart on South Korea - Year-over-year growth 2025-2030 (%)
Data Table on South Korea - Year-over-year growth 2025-2030 (%)

12.3.5 Australia - Market size and forecast 2025-2030

Chart on Australia - Market size and forecast 2025-2030 ($ million)
Data Table on Australia - Market size and forecast 2025-2030 ($ million)
Chart on Australia - Year-over-year growth 2025-2030 (%)
Data Table on Australia - Year-over-year growth 2025-2030 (%)

12.3.6 Indonesia - Market size and forecast 2025-2030

Chart on Indonesia - Market size and forecast 2025-2030 ($ million)
Data Table on Indonesia - Market size and forecast 2025-2030 ($ million)
Chart on Indonesia - Year-over-year growth 2025-2030 (%)
Data Table on Indonesia - Year-over-year growth 2025-2030 (%)

12.4 North America - Market size and forecast 2025-2030

Chart on North America - Market size and forecast 2025-2030 ($ million)
Data Table on North America - Market size and forecast 2025-2030 ($ million)
Chart on North America - Year-over-year growth 2025-2030 (%)
Data Table on North America - Year-over-year growth 2025-2030 (%)
Chart on Regional Comparison - North America
Data Table on Regional Comparison - North America

12.4.1 US - Market size and forecast 2025-2030

Chart on US - Market size and forecast 2025-2030 ($ million)
Data Table on US - Market size and forecast 2025-2030 ($ million)
Chart on US - Year-over-year growth 2025-2030 (%)
Data Table on US - Year-over-year growth 2025-2030 (%)

12.4.2 Canada - Market size and forecast 2025-2030

Chart on Canada - Market size and forecast 2025-2030 ($ million)
Data Table on Canada - Market size and forecast 2025-2030 ($ million)
Chart on Canada - Year-over-year growth 2025-2030 (%)
Data Table on Canada - Year-over-year growth 2025-2030 (%)

12.4.3 Mexico - Market size and forecast 2025-2030

Chart on Mexico - Market size and forecast 2025-2030 ($ million)
Data Table on Mexico - Market size and forecast 2025-2030 ($ million)
Chart on Mexico - Year-over-year growth 2025-2030 (%)
Data Table on Mexico - Year-over-year growth 2025-2030 (%)

12.5 Europe - Market size and forecast 2025-2030

Chart on Europe - Market size and forecast 2025-2030 ($ million)
Data Table on Europe - Market size and forecast 2025-2030 ($ million)
Chart on Europe - Year-over-year growth 2025-2030 (%)
Data Table on Europe - Year-over-year growth 2025-2030 (%)
Chart on Regional Comparison - Europe
Data Table on Regional Comparison - Europe

12.5.1 Germany - Market size and forecast 2025-2030

Chart on Germany - Market size and forecast 2025-2030 ($ million)
Data Table on Germany - Market size and forecast 2025-2030 ($ million)
Chart on Germany - Year-over-year growth 2025-2030 (%)
Data Table on Germany - Year-over-year growth 2025-2030 (%)

12.5.2 France - Market size and forecast 2025-2030

Chart on France - Market size and forecast 2025-2030 ($ million)
Data Table on France - Market size and forecast 2025-2030 ($ million)
Chart on France - Year-over-year growth 2025-2030 (%)
Data Table on France - Year-over-year growth 2025-2030 (%)

12.5.3 UK - Market size and forecast 2025-2030

Chart on UK - Market size and forecast 2025-2030 ($ million)
Data Table on UK - Market size and forecast 2025-2030 ($ million)
Chart on UK - Year-over-year growth 2025-2030 (%)
Data Table on UK - Year-over-year growth 2025-2030 (%)

12.5.4 Italy - Market size and forecast 2025-2030

Chart on Italy - Market size and forecast 2025-2030 ($ million)
Data Table on Italy - Market size and forecast 2025-2030 ($ million)
Chart on Italy - Year-over-year growth 2025-2030 (%)
Data Table on Italy - Year-over-year growth 2025-2030 (%)

12.5.5 Spain - Market size and forecast 2025-2030

Chart on Spain - Market size and forecast 2025-2030 ($ million)
Data Table on Spain - Market size and forecast 2025-2030 ($ million)
Chart on Spain - Year-over-year growth 2025-2030 (%)
Data Table on Spain - Year-over-year growth 2025-2030 (%)

12.5.6 The Netherlands - Market size and forecast 2025-2030

Chart on The Netherlands - Market size and forecast 2025-2030 ($ million)
Data Table on The Netherlands - Market size and forecast 2025-2030 ($ million)
Chart on The Netherlands - Year-over-year growth 2025-2030 (%)
Data Table on The Netherlands - Year-over-year growth 2025-2030 (%)

12.6 Middle East and Africa - Market size and forecast 2025-2030

Chart on Middle East and Africa - Market size and forecast 2025-2030 ($ million)
Data Table on Middle East and Africa - Market size and forecast 2025-2030 ($ million)
Chart on Middle East and Africa - Year-over-year growth 2025-2030 (%)
Data Table on Middle East and Africa - Year-over-year growth 2025-2030 (%)
Chart on Regional Comparison - Middle East and Africa
Data Table on Regional Comparison - Middle East and Africa

12.6.1 Saudi Arabia - Market size and forecast 2025-2030

Chart on Saudi Arabia - Market size and forecast 2025-2030 ($ million)
Data Table on Saudi Arabia - Market size and forecast 2025-2030 ($ million)
Chart on Saudi Arabia - Year-over-year growth 2025-2030 (%)
Data Table on Saudi Arabia - Year-over-year growth 2025-2030 (%)

12.6.2 UAE - Market size and forecast 2025-2030

Chart on UAE - Market size and forecast 2025-2030 ($ million)
Data Table on UAE - Market size and forecast 2025-2030 ($ million)
Chart on UAE - Year-over-year growth 2025-2030 (%)
Data Table on UAE - Year-over-year growth 2025-2030 (%)

12.6.3 South Africa - Market size and forecast 2025-2030

Chart on South Africa - Market size and forecast 2025-2030 ($ million)
Data Table on South Africa - Market size and forecast 2025-2030 ($ million)
Chart on South Africa - Year-over-year growth 2025-2030 (%)
Data Table on South Africa - Year-over-year growth 2025-2030 (%)

12.6.4 Israel - Market size and forecast 2025-2030

Chart on Israel - Market size and forecast 2025-2030 ($ million)
Data Table on Israel - Market size and forecast 2025-2030 ($ million)
Chart on Israel - Year-over-year growth 2025-2030 (%)
Data Table on Israel - Year-over-year growth 2025-2030 (%)

12.6.5 Turkey - Market size and forecast 2025-2030

Chart on Turkey - Market size and forecast 2025-2030 ($ million)
Data Table on Turkey - Market size and forecast 2025-2030 ($ million)
Chart on Turkey - Year-over-year growth 2025-2030 (%)
Data Table on Turkey - Year-over-year growth 2025-2030 (%)

12.7 South America - Market size and forecast 2025-2030

Chart on South America - Market size and forecast 2025-2030 ($ million)
Data Table on South America - Market size and forecast 2025-2030 ($ million)
Chart on South America - Year-over-year growth 2025-2030 (%)
Data Table on South America - Year-over-year growth 2025-2030 (%)
Chart on Regional Comparison - South America
Data Table on Regional Comparison - South America

12.7.1 Brazil - Market size and forecast 2025-2030

Chart on Brazil - Market size and forecast 2025-2030 ($ million)
Data Table on Brazil - Market size and forecast 2025-2030 ($ million)
Chart on Brazil - Year-over-year growth 2025-2030 (%)
Data Table on Brazil - Year-over-year growth 2025-2030 (%)

12.7.2 Argentina - Market size and forecast 2025-2030

Chart on Argentina - Market size and forecast 2025-2030 ($ million)
Data Table on Argentina - Market size and forecast 2025-2030 ($ million)
Chart on Argentina - Year-over-year growth 2025-2030 (%)
Data Table on Argentina - Year-over-year growth 2025-2030 (%)

12.7.3 Colombia - Market size and forecast 2025-2030

Chart on Colombia - Market size and forecast 2025-2030 ($ million)
Data Table on Colombia - Market size and forecast 2025-2030 ($ million)
Chart on Colombia - Year-over-year growth 2025-2030 (%)
Data Table on Colombia - Year-over-year growth 2025-2030 (%)

12.8 Market opportunity by geography

Market opportunity by geography ($ million)
Data Tables on Market opportunity by geography ($ million)

13. Drivers, Challenges, and Opportunity

13.1 Market drivers

Modernization of aging grid infrastructure and life extension services
Rapid integration of renewable energy sources and grid decentralization
Implementation of digitalization and predictive maintenance technologies

13.2 Market challenges

Critical shortage of skilled technical personnel and specialized expertise
Persistent supply chain volatility and scarcity of essential raw materials
Stringent environmental regulations and evolving compliance standards

13.3 Impact of drivers and challenges

Impact of drivers and challenges in 2025 and 2030

13.4 Market opportunities

Shift toward circular economy principles and biodegradable insulation fluids
Integration of AI-driven digital twins and remote diagnostic ecosystems
Deployment of high speed mobile service units and modular recovery solutions

14. Competitive Landscape

14.1 Overview

14.2

Overview on criticality of inputs and factors of differentiation

14.3 Landscape disruption

Overview on factors of disruption

14.4 Industry risks

Impact of key risks on business

15. Competitive Analysis

15.1 Companies profiled

Companies covered

15.2 Company ranking index

15.3 Market positioning of companies

Matrix on companies position and classification

15.4 Apar Industries Ltd.

Apar Industries Ltd. - Overview
Apar Industries Ltd. - Business segments
Apar Industries Ltd. - Key offerings
Apar Industries Ltd. - Segment focus
SWOT

15.5 Bharat Heavy Electricals Ltd.

Bharat Heavy Electricals Ltd. - Overview
Bharat Heavy Electricals Ltd. - Business segments
Bharat Heavy Electricals Ltd. - Key offerings
Bharat Heavy Electricals Ltd. - Segment focus
SWOT

15.6 CG Power and Industrial Ltd.

CG Power and Industrial Ltd. - Overview
CG Power and Industrial Ltd. - Business segments
CG Power and Industrial Ltd. - Key offerings
CG Power and Industrial Ltd. - Segment focus
SWOT

15.7 Eaton Corp. Plc

Eaton Corp. Plc - Overview
Eaton Corp. Plc - Business segments
Eaton Corp. Plc - Key news
Eaton Corp. Plc - Key offerings
Eaton Corp. Plc - Segment focus
SWOT

15.8 GE Vernova Inc.

GE Vernova Inc. - Overview
GE Vernova Inc. - Business segments
GE Vernova Inc. - Key offerings
GE Vernova Inc. - Segment focus
SWOT

15.9 Hitachi Energy India Ltd.

Hitachi Energy India Ltd. - Overview
Hitachi Energy India Ltd. - Product / Service
Hitachi Energy India Ltd. - Key offerings
SWOT

15.10 Hyundai Motor Co.

Hyundai Motor Co. - Overview
Hyundai Motor Co. - Business segments
Hyundai Motor Co. - Key news
Hyundai Motor Co. - Key offerings
Hyundai Motor Co. - Segment focus
SWOT

15.11 Mitsubishi Electric Corp.

Mitsubishi Electric Corp. - Overview
Mitsubishi Electric Corp. - Business segments
Mitsubishi Electric Corp. - Key offerings
Mitsubishi Electric Corp. - Segment focus
SWOT

15.12 Prolec Energy

Prolec Energy - Overview
Prolec Energy - Product / Service
Prolec Energy - Key offerings
SWOT

15.13 Schneider Electric SE

Schneider Electric SE - Overview
Schneider Electric SE - Business segments
Schneider Electric SE - Key offerings
Schneider Electric SE - Segment focus
SWOT

15.14 SGB-SMIT Group

SGB-SMIT Group - Overview
SGB-SMIT Group - Product / Service
SGB-SMIT Group - Key offerings
SWOT

15.15 Siemens Energy AG

Siemens Energy AG - Overview
Siemens Energy AG - Business segments
Siemens Energy AG - Key news
Siemens Energy AG - Key offerings
Siemens Energy AG - Segment focus
SWOT

15.16 TBEA Co. Ltd.

TBEA Co. Ltd. - Overview
TBEA Co. Ltd. - Product / Service
TBEA Co. Ltd. - Key offerings
SWOT

15.17 Toshiba Corp.

Toshiba Corp. - Overview
Toshiba Corp. - Product / Service
Toshiba Corp. - Key offerings
SWOT

15.18 WEG S.A

WEG S.A - Overview
WEG S.A - Business segments
WEG S.A - Key offerings
WEG S.A - Segment focus
SWOT

16. Appendix

16.1 Scope of the report

Market definition
Objectives
Notes and caveats

16.2 Inclusions and exclusions checklist

Inclusions checklist
Exclusions checklist

16.3 Currency conversion rates for US$

16.4 Research methodology

16.5 Data procurement

Information sources

16.6 Data validation

16.7 Validation techniques employed for market sizing

16.8 Data synthesis

16.9 360 degree market analysis

16.10 List of abbreviations

Research Methodology

Technavio presents a detailed picture of the market by way of study, synthesis, and summation of data from multiple sources. The analysts have presented the various facets of the market with a particular focus on identifying the key industry influencers. The data thus presented is comprehensive, reliable, and the result of extensive research, both primary and secondary.

INFORMATION SOURCES

Primary sources

  • Manufacturers and suppliers
  • Channel partners
  • Industry experts
  • Strategic decision makers

Secondary sources

  • Industry journals and periodicals
  • Government data
  • Financial reports of key industry players
  • Historical data
  • Press releases

DATA ANALYSIS

Data Synthesis

  • Collation of data
  • Estimation of key figures
  • Analysis of derived insights

Data Validation

  • Triangulation with data models
  • Reference against proprietary databases
  • Corroboration with industry experts

REPORT WRITING

Qualitative

  • Market drivers
  • Market challenges
  • Market trends
  • Five forces analysis

Quantitative

  • Market size and forecast
  • Market segmentation
  • Geographical insights
  • Competitive landscape

Interested in this report?

Get your sample now to see our research methodology and insights!

Download Now

Frequently Asked Questions

Transformer Services market growth will increase by USD 2502.0 million during 2026-2030.

The Transformer Services market is expected to grow at a CAGR of 6.3% during 2026-2030.

Transformer Services market is segmented by Service type (Maintenance and inspection, Repair and refurbishment, Testing and diagnostics, Digital monitoring and IoT services, Others) End-user (Utilities and grid operators, Industrial customers, Renewable energy developers, Others) Type (Power transformers, Distribution transformers, Dry-type and specialty)

Apar Industries Ltd., Bharat Heavy Electricals Ltd., CG Power and Industrial Ltd., Eaton Corp. Plc, EL Sewedy Electric Co., GE Vernova Inc., Hammond Power Inc., Hitachi Energy India Ltd., Hyosung Heavy Industries Corp., Hyundai Motor Co., Mitsubishi Electric Corp., Ormazabal, Prolec Energy, Schneider Electric SE, SGB-SMIT Group, Siemens Energy AG, TBEA Co. Ltd., Toshiba Corp., Virginia Transformer Corp., WEG S.A are a few of the key vendors in the Transformer Services market.

APAC will register the highest growth rate of 48.7% among the other regions. Therefore, the Transformer Services market in APAC is expected to garner significant business opportunities for the vendors during the forecast period.

China, India, Japan, South Korea, Australia, Indonesia, US, Canada, Mexico, Germany, France, UK, Italy, Spain, The Netherlands, Saudi Arabia, UAE, South Africa, Israel, Turkey, Brazil, Argentina, Colombia

  • Modernization of aging grid infrastructure and life extension services is the driving factor this market.

The Transformer Services market vendors should focus on grabbing business opportunities from the Service type segment as it accounted for the largest market share in the base year.
RIA - Research AI Assistant
Ask RIA
