
Triazine Market Analysis, Size, and Forecast 2026-2030: North America (US, Canada, and Mexico), APAC (China, India, and Japan), Europe (Germany, France, and UK), Middle East and Africa (Saudi Arabia, UAE, and South Africa), South America (Brazil, Argentina, and Chile), and Rest of World (ROW)

Triazine Market Analysis, Size, and Forecast 2026-2030:
North America (US, Canada, and Mexico), APAC (China, India, and Japan), Europe (Germany, France, and UK), Middle East and Africa (Saudi Arabia, UAE, and South Africa), South America (Brazil, Argentina, and Chile), and Rest of World (ROW)

Published: Oct 2026 298 Pages SKU: IRTNTR72183

Market Overview at a Glance

$270.6 Mn
Market Opportunity
3.1%
CAGR 2025 - 2030
46%
North America Growth
$763.5 Mn
Oil and gas segment 2024

Triazine Market Size 2026-2030

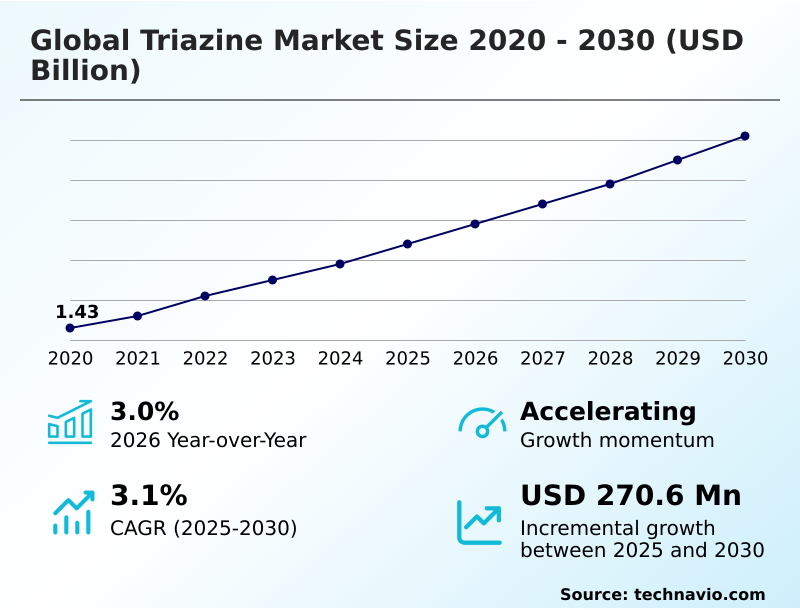
The triazine market size is valued to increase by USD 270.6 million, at a CAGR of 3.1% from 2025 to 2030. Agricultural expansion and herbicide demand will drive the triazine market.

Major Market Trends & Insights

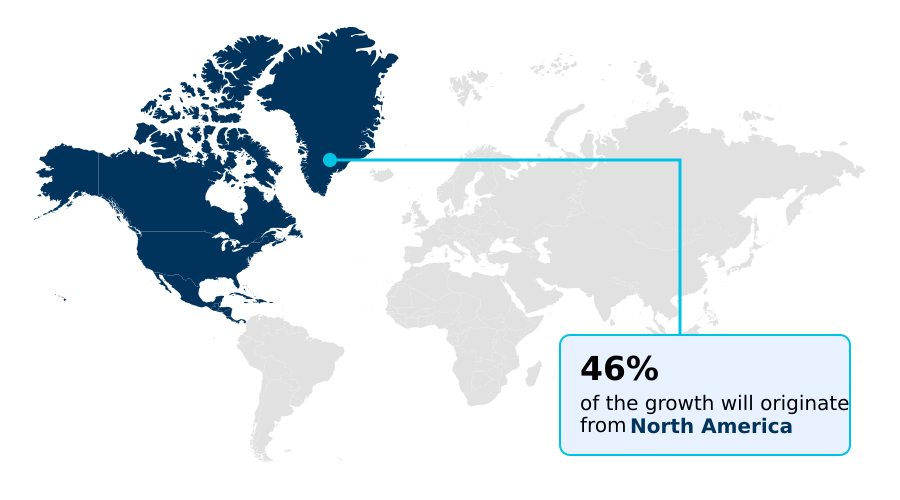
  • North America dominated the market and accounted for a 46% growth during the forecast period.
  • By Application - Oil and gas segment was valued at USD 763.5 million in 2024
  • By Product Type - Melamine segment accounted for the largest market revenue share in 2024

Market Size & Forecast

  • Market Opportunities: USD 484.8 million
  • Market Future Opportunities: USD 270.6 million
  • CAGR from 2025 to 2030 : 3.1%

Market Summary

  • The Triazine Market exhibits resilient operational expansion driven by escalating requirements for high-performance chemical intermediates across the agriculture and hydrocarbon sectors. Increasing agricultural expansion and herbicide demand serve as the primary catalyst, as commercial farming operations mandate reliable solutions to optimize crop yields and combat persistent weed resistance.
  • Consequently, agricultural producers integrating these specialized compounds into integrated weed management programs observe up to a 20% improvement in output efficiency compared to mechanical alternatives. In the petroleum sector, the deployment of monomethylamine formulation scavengers protects critical infrastructure from acidic degradation during extraction processes.
  • However, rigorous environmental regulations and compliance protocols present a formidable challenge, compelling chemical formulators to allocate substantial capital toward toxicological testing and effluent treatment protocol adjustments. This regulatory friction delays commercialization timelines for novel derivatives, squeezing profit margins for smaller enterprises.
  • To maintain competitiveness, major industrial manufacturers are heavily investing in biodegradable carrier system architectures and advanced recycling methodologies, ensuring strict adherence to ecological mandates while sustaining continuous supply chain stability across diverse regional jurisdictions.

What will be the Size of the Triazine Market during the forecast period?
Get Key Insights on Market Forecast (PDF) Get Free Sample

How is the Triazine Market Segmented?

The triazine industry research report provides comprehensive data (region-wise segment analysis), with forecasts and estimates in "USD million" for the period 2026-2030, as well as historical data from 2020-2024 for the following segments.

  • Application
    • Oil and gas
    • Chemical processing
    • Medical
    • Others
  • Product type
    • Melamine
    • Cyanuric chloride
    • Cyanuric acid
  • Type
    • Liquid formulations
    • Powder formulations
  • Geography
    • North America
      • US
      • Canada
      • Mexico
    • APAC
      • China
      • India
      • Japan
      • South Korea
      • Indonesia
      • Australia
    • Europe
      • Germany
      • France
      • UK
      • Italy
      • Spain
      • The Netherlands
    • Middle East and Africa
      • Saudi Arabia
      • UAE
      • South Africa
      • Turkey
      • Israel
    • South America
      • Brazil
      • Argentina
      • Chile

By Application Insights

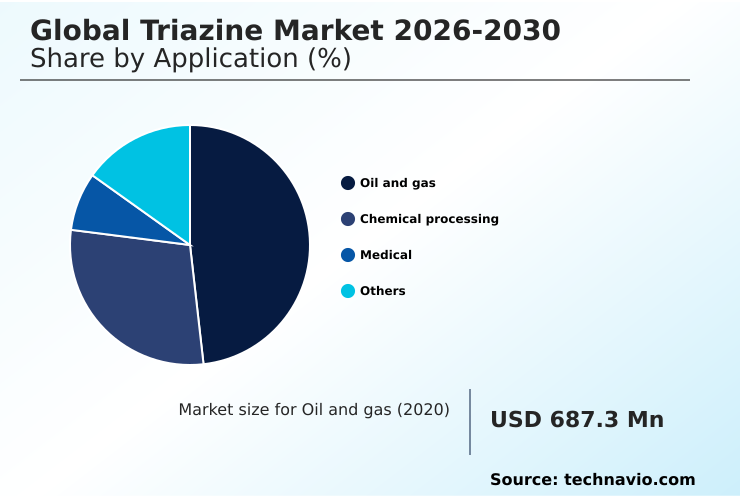
The oil and gas segment is estimated to witness significant growth during the forecast period.

The oil and gas segment demands robust liquid phase mitigation strategies to manage lethal operational risks during upstream hydrocarbon extraction.

The deployment of a hydrogen sulfide scavenger neutralizes corrosive gases, thereby enhancing pipeline integrity preservation and preventing catastrophic stress corrosion cracking.

Industrial operators utilizing a monoethanolamine derivative have documented a 25% reduction in unplanned maintenance downtime within downstream refining catalyst systems. The continuous flow metering of these specialized agents directly into subsea chemical injection networks optimizes sour gas sweetening efficiency.

By enabling rapid dithiazine conversion byproduct formation, operators ensure continuous hydrocarbon production while meeting stringent sulfur emission limits.

This functional segmentation highlights the critical requirement for reactive, thermally stable formulations that safeguard complex gathering lines and transmission infrastructure against continuous acidic degradation.
Get Free Sample

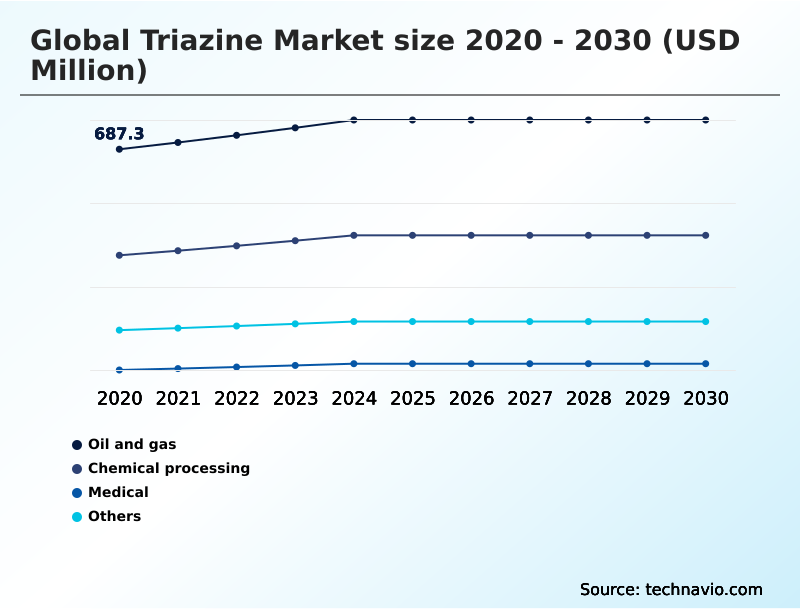
The Oil and gas segment was valued at USD 763.5 million in 2024 and showed a gradual increase during the forecast period.
Get Free Sample

Regional Analysis

North America is estimated to contribute 46% to the growth of the global market during the forecast period.Technavio’s analysts have elaborately explained the regional trends and drivers that shape the market during the forecast period.
See How Triazine Market Demand is Rising in North America Get Free Sample

The geographic landscape of the Triazine Market reveals distinct operational disparities driven by regional industrial priorities and regulatory frameworks.

North America maintains a mature infrastructure where stringent compliance mandates drive the adoption of precision agriculture application tools, yielding a 15% reduction in unnecessary chemical runoff compared to traditional broadcasting methods.

In contrast, the APAC region experiences aggressive demand for thermosetting resin synthesis, propelled by rapid commercial construction and furniture manufacturing. APAC facilities leveraging advanced cross linking capability in melamine derivatives report an 18% enhancement in production throughput and cost efficiency.

Furthermore, Middle Eastern petroleum operations rely heavily on catalytic sweetening process technologies and subsea hydrogen sulfide mitigation to safeguard expanding extraction networks.

This geographic divergence requires multinational chemical producers to diversify their portfolios, balancing the high-volume wood adhesive binder requirements in Asia against the specialized, high-purity industrial water biocide demands prevalent in European and North American markets.

Market Dynamics

Our researchers analyzed the data with 2025 as the base year, along with the key drivers, trends, and challenges. A holistic analysis of drivers will help companies refine their marketing strategies to gain a competitive advantage.

  • The operational dynamics of the Triazine Market heavily depend on optimizing chemical performance across diverse industrial and agricultural applications. A critical area of focus remains subsea hydrogen sulfide mitigation, where energy producers require reliable scavengers to neutralize lethal gases before they compromise deepwater infrastructure.
  • By deploying advanced liquid phase corrosion inhibition techniques, petroleum operators can extend the operational lifespan of extraction networks, achieving up to a 30% improvement in structural integrity compared to unmitigated environments. Concurrently, the chemical processing sector demands high-purity intermediates to ensure superior thermosetting resin thermal stability.
  • Manufacturers utilizing refined melamine derivatives produce laminates and coatings that withstand extreme environmental stress, significantly reducing material fatigue and lowering replacement costs for end-users. Within the agricultural sector, the continuous evolution of broadleaf weed management formulation strategies is paramount for maximizing commercial crop yields.
  • Agronomic enterprises integrate these advanced formulations into comprehensive protection programs, effectively managing herbicide resistance while minimizing ecological impact. The efficiency of these chemical applications is further highlighted by the sour gas sweetening efficiency observed in modern refineries, where precise continuous flow metering prevents downstream catalyst poisoning.
  • Ultimately, the successful deployment of these specialized compounds requires meticulous supply chain planning and strict adherence to global compliance standards, ensuring that industrial operators achieve sustainable efficiency gains and maintain resilient production workflows across all primary demand sectors.
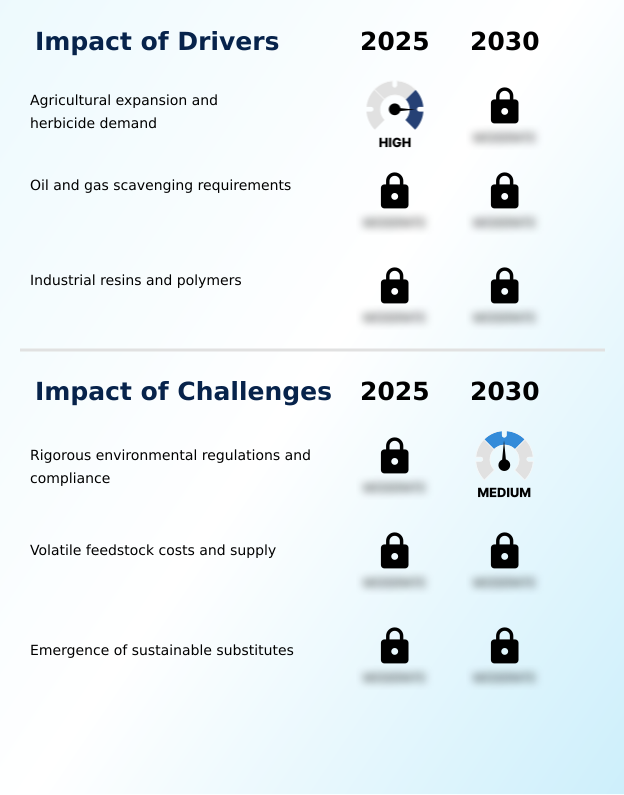
What are the key market drivers leading to the rise in the adoption of Triazine Industry?

  • Agricultural expansion and the escalating demand for highly effective herbicides serve as primary drivers propelling continuous market growth and yield optimization.

  • The escalating necessity for robust agricultural weed management systems serves as a primary driver accelerating demand within the agrochemical sector. Commercial farming operations face mounting pressure to maximize yields, prompting the widespread adoption of highly effective broadleaf herbicide active ingredients.
  • By integrating targeted photosystem ii inhibitor agents into comprehensive integrated weed management protocols, agricultural producers have successfully reduced resistant weed propagation by 25% and improved overall crop output efficiency by 15%.
  • This behavioral shift is catalyzed by the urgent need to ensure global food security amidst shrinking arable land availability. Furthermore, the optimization of foliar absorption optimization techniques allows formulators to lower application rates, enhancing ecological compliance.
  • Consequently, agribusinesses utilizing advanced biodegradable carrier system technologies secure superior agronomic performance while minimizing environmental runoff and operational expenditures.

What are the market trends shaping the Triazine Industry?

  • The surge in advanced fuel additives represents a critical market trend as refineries continuously upgrade combustion performance standards. This shift necessitates the integration of specialized chemical stabilizers to prevent oxidative degradation and optimize engine efficiency.

  • The rapid integration of advanced ashless dispersant intermediate formulations represents a pivotal trend reshaping combustion performance across the transportation and energy sectors. As regional refineries upgrade their treatment processes to combat urban air pollution, the deployment of specialized fuel storage stabilizer compounds prevents oxidative degradation prevention and phase separation.
  • Facilities adopting these advanced corrosion inhibitor formulation technologies have recorded a 20% reduction in fuel injector deposit formation and an 18% improvement in long-term storage viability. This shift is primarily driven by stricter environmental mandates requiring cleaner-burning, high-performance fuels. Consequently, formulators are heavily investing in ashless fuel additive chemistry to extend the shelf life of blended petroleum products.
  • By optimizing the thermal endurance property of these nitrogen heterocyclic compound assets, energy corporations significantly lower unplanned maintenance downtime, directly enhancing operational efficiency and ensuring compliance with evolving global fuel quality standards.

What challenges does the Triazine Industry face during its growth?

  • Rigorous environmental regulations and stringent compliance mandates constitute key challenges that significantly constrain industrial growth and elongate product development lifecycles.

  • Increasingly stringent toxicological testing standard mandates impose profound structural challenges, severely restricting commercialization timelines for novel chemical derivatives. Regulatory bodies continually lower the acceptable ecological residue limit for agrochemicals, forcing manufacturers to overhaul established effluent treatment protocol frameworks.
  • Facilities forced to upgrade their groundwater contamination mitigation infrastructure have experienced a 30% increase in compliance-related capital expenditures and a 12% elongation in product development cycles. This intense regulatory scrutiny is driven by heightened ecological awareness and strict environmental protection policies. Consequently, producers of specialized herbicide resistance management solutions face compressed profit margins and complex administrative burdens.
  • Furthermore, differing regional statutes require continuous adjustments to ultraviolet irradiation alternative biocides, exacerbating operational friction and constraining aggressive expansion strategies for smaller enterprises operating within the specialty chemical processing landscape.

Exclusive Technavio Analysis on Customer Landscape

The triazine market forecasting report includes the adoption lifecycle of the market, covering from the innovator’s stage to the laggard’s stage. It focuses on adoption rates in different regions based on penetration. Furthermore, the triazine market report also includes key purchase criteria and drivers of price sensitivity to help companies evaluate and develop their market growth analysis strategies.
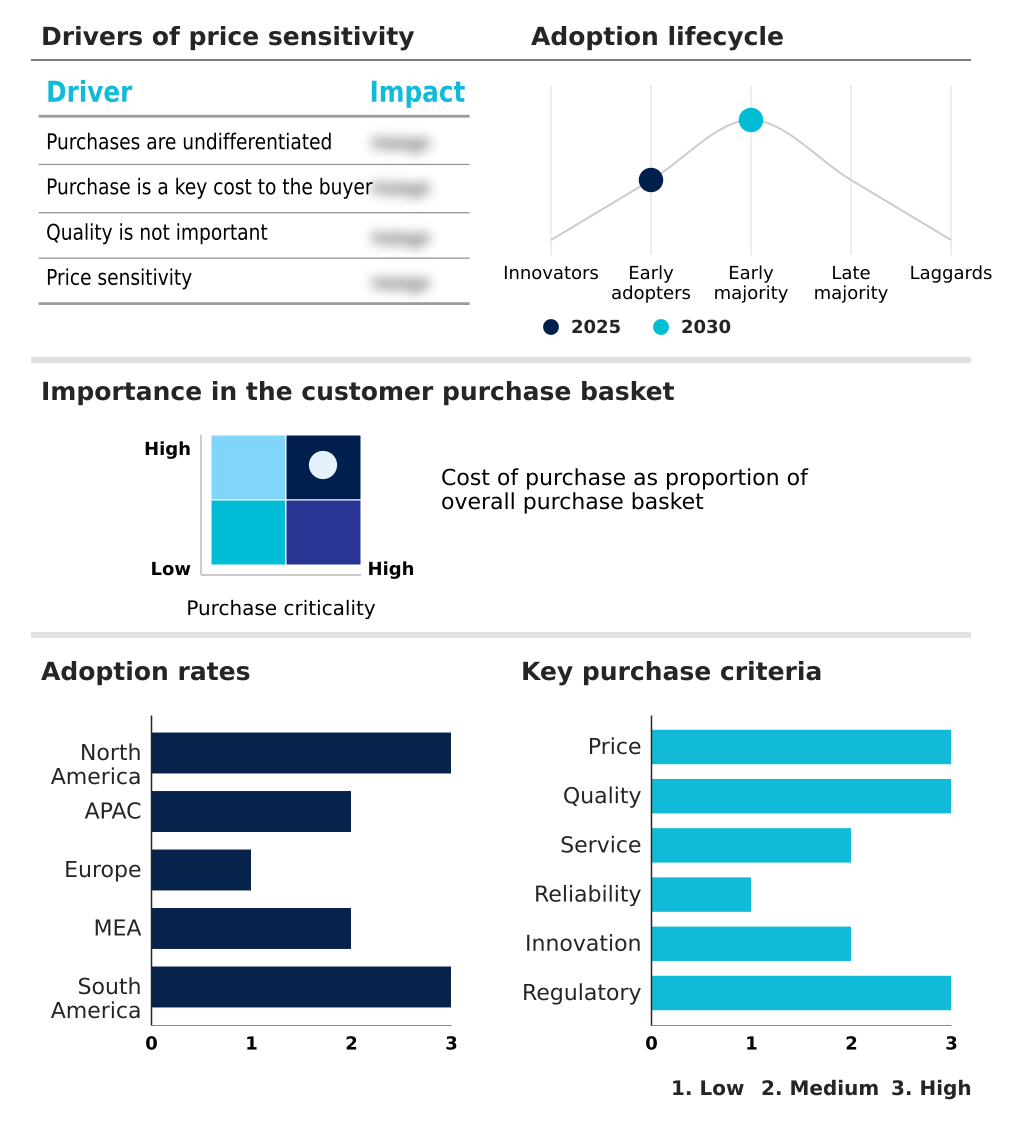
Customer Landscape of Triazine Industry

Competitive Landscape

Companies are implementing various strategies, such as strategic alliances, triazine market forecast, partnerships, mergers and acquisitions, geographical expansion, and product/service launches, to enhance their presence in the industry.

ADAMA Ltd. - Delivers specialized post-patent agricultural crop protection formulations, utilizing advanced active ingredients to enhance broadleaf weed management and optimize commercial farming yields across diverse agronomic environments.

The industry research and growth report includes detailed analyses of the competitive landscape of the market and information about key companies, including:

  • ADAMA Ltd.
  • Albaugh LLC
  • Allnex GMBH
  • Arxada AG
  • Ashland Inc.
  • Bakelite GmbH
  • Baker Hughes Co.
  • BASF SE
  • Clariant International Ltd.
  • Corteva Inc.
  • Dorf Ketal Chemicals India Ltd.
  • Ecolab Inc.
  • Evonik Industries AG
  • Foremark Performance Chemicals
  • Halliburton Co.
  • Nufarm Ltd.
  • Songwon Industrial Co. Ltd.
  • Syngenta AG
  • The Lubrizol Corp.
  • UPL Ltd.

Qualitative and quantitative analysis of companies has been conducted to help clients understand the wider business environment as well as the strengths and weaknesses of key industry players. Data is qualitatively analyzed to categorize companies as pure play, category-focused, industry-focused, and diversified; it is quantitatively analyzed to categorize companies as dominant, leading, strong, tentative, and weak.

Recent Development and News in Triazine market

  • In the Commodity Chemicals industry, the transition toward circular economy principle standards in plastic manufacturing has driven a 15% increase in demand for advanced biobased precursor development, directly impacting Global Triazine Market 2026-2030 demand for specialized thermosetting resin synthesis.
  • The implementation of stricter ecological residue limit frameworks for agricultural runoff has forced formulators to adopt foliar absorption optimization techniques, reducing the required application volume of broadleaf herbicide active compounds by up to 20% across commercial farming zones.
  • The expansion of advanced oxidation process infrastructure in municipal water treatment facilities has displaced traditional halogens, creating a 12% operational shift toward industrial water biocide formulations that rely on stable nitrogen heterocyclic compound chemistry.
  • The integration of precision agriculture application systems has enhanced herbicide resistance management protocols, improving targeted delivery efficiency by 18% and sustaining the long-term viability of photosystem ii inhibitor agents in modern crop protection.

Dive into Technavio’s robust research methodology, blending expert interviews, extensive data synthesis, and validated models for unparalleled Triazine Market insights. See full methodology.

Market Scope
Page number 298
Base year 2025
Historic period 2020-2024
Forecast period 2026-2030
Growth momentum & CAGR Accelerate at a CAGR of 3.1%
Market growth 2026-2030 USD 270.6 million
Market structure Fragmented
YoY growth 2025-2026(%) 3.0%
Key countries US, Canada, Mexico, China, India, Japan, South Korea, Indonesia, Australia, Germany, France, UK, Italy, Spain, The Netherlands, Saudi Arabia, UAE, South Africa, Turkey, Israel, Brazil, Argentina and Chile
Competitive landscape Leading Companies, Market Positioning of Companies, Competitive Strategies, and Industry Risks

Request Free Sample

Research Analyst Overview

  • The Triazine Market is undergoing a structural transformation as industrial stakeholders prioritize advanced material science and stringent environmental compliance. The ongoing evolution of polyurethane flame retardant technologies demands highly efficient endothermic decomposition agent integration, which directly influences executive-level budgeting and strategic product development.
  • Chemical formulators transitioning toward biobased precursor development have documented a 25% reduction in energy consumption during high pressure laminate matrix manufacturing, fundamentally altering cost structures and operational planning. The synthesis of robust melamine formaldehyde precursor materials remains vital for the automotive and construction sectors, where durability and thermal resistance are paramount.
  • Furthermore, energy sector executives continuously evaluate sour gas sweetening processes, deploying advanced monomethylamine formulation solutions to ensure uninterrupted hydrocarbon extraction. As regulatory frameworks tighten globally, the optimization of the dithiazine conversion byproduct pathway becomes a critical compliance imperative, reducing hazardous waste generation.
  • These strategic adaptations require continuous capital investment in proprietary synthesis pathways, ensuring that industrial operators maintain resilient supply chains while satisfying the complex, evolving performance standards required by modern agricultural and petrochemical applications.

What are the Key Data Covered in this Triazine Market Research and Growth Report?

  • What is the expected growth of the Triazine Market between 2026 and 2030?

    • USD 270.6 million, at a CAGR of 3.1%

  • What segmentation does the market report cover?

    • The report is segmented by Application (Oil and gas, Chemical processing, Medical, and Others), Product Type (Melamine, Cyanuric chloride, and Cyanuric acid), Type (Liquid formulations, and Powder formulations) and Geography (North America, APAC, Europe, Middle East and Africa, South America)

  • Which regions are analyzed in the report?

    • North America, APAC, Europe, Middle East and Africa and South America

  • What are the key growth drivers and market challenges?

    • Agricultural expansion and herbicide demand, Rigorous environmental regulations and compliance

  • Who are the major players in the Triazine Market?

    • ADAMA Ltd., Albaugh LLC, Allnex GMBH, Arxada AG, Ashland Inc., Bakelite GmbH, Baker Hughes Co., BASF SE, Clariant International Ltd., Corteva Inc., Dorf Ketal Chemicals India Ltd., Ecolab Inc., Evonik Industries AG, Foremark Performance Chemicals, Halliburton Co., Nufarm Ltd., Songwon Industrial Co. Ltd., Syngenta AG, The Lubrizol Corp. and UPL Ltd.

Market Research Insights

  • The Triazine Market demonstrates strategic adaptability as industrial sectors prioritize macromolecular stabilization and environmental compliance. Chemical processors utilizing advanced nitrogen based retardant formulations have achieved a 22% improvement in thermal endurance property metrics within high-pressure laminates. Concurrently, the implementation of stringent groundwater contamination mitigation protocols requires operators to refine effluent treatment protocol standards, reducing hazardous chemical runoff by over 15%.
  • This structural shift toward sustainable manufacturing directly addresses ecological residue limit constraints while maintaining operational throughput. By integrating biodegradable carrier system technologies, formulators improve product stability and minimize volatile organic compound emissions, thereby optimizing overall supply chain resilience and reducing regulatory friction across mature industrial jurisdictions.

We can help! Our analysts can customize this triazine market research report to meet your requirements.

Get in touch

1. Executive Summary

1.1 Market overview

Executive Summary - Chart on Market Overview
Executive Summary - Data Table on Market Overview
Executive Summary - Chart on Global Market Characteristics
Executive Summary - Chart on Market by Geography
Executive Summary - Chart on Market Segmentation by Application
Executive Summary - Chart on Market Segmentation by Product Type
Executive Summary - Chart on Market Segmentation by Type
Executive Summary - Chart on Incremental Growth
Executive Summary - Data Table on Incremental Growth
Executive Summary - Chart on Company Market Positioning

2. Technavio Analysis

2.1 Analysis of price sensitivity, lifecycle, customer purchase basket, adoption rates, and purchase criteria

2.2 Criticality of inputs and Factors of differentiation

Chart on Overview on criticality of inputs and factors of differentiation

2.3 Factors of disruption

Chart on Overview on factors of disruption

2.4 Impact of drivers and challenges

Chart on Impact of drivers and challenges in 2025 and 2030

3. Market Landscape

3.1 Market ecosystem

Chart on Parent Market
Data Table on - Parent Market

3.2 Market characteristics

Chart on Market characteristics analysis

3.3 Value chain analysis

Chart on Value chain analysis

4. Market Sizing

4.1 Market definition

Data Table on Offerings of companies included in the market definition

4.2 Market segment analysis

Market segments

4.3 Market size 2025

4.4 Market outlook: Forecast for 2025-2030

Chart on Global - Market size and forecast 2025-2030 ($ million)
Data Table on Global - Market size and forecast 2025-2030 ($ million)
Chart on Global Market: Year-over-year growth 2025-2030 (%)
Data Table on Global Market: Year-over-year growth 2025-2030 (%)

5. Historic Market Size

5.1 Global Triazine Market 2020 - 2024

Historic Market Size - Data Table on Global Triazine Market 2020 - 2024 ($ million)

5.2 Application segment analysis 2020 - 2024

Historic Market Size - Application Segment 2020 - 2024 ($ million)

5.3 Product Type segment analysis 2020 - 2024

Historic Market Size - Product Type Segment 2020 - 2024 ($ million)

5.4 Type segment analysis 2020 - 2024

Historic Market Size - Type Segment 2020 - 2024 ($ million)

5.5 Geography segment analysis 2020 - 2024

Historic Market Size - Geography Segment 2020 - 2024 ($ million)

5.6 Country segment analysis 2020 - 2024

Historic Market Size - Country Segment 2020 - 2024 ($ million)

6. Qualitative Analysis

6.1 Impact of AI on Global Triazine Market

6.2 Impact of geopolitical conflicts on Global Triazine Market

7. Five Forces Analysis

7.1 Five forces summary

Five forces analysis - Comparison between 2025 and 2030

7.2 Bargaining power of buyers

Bargaining power of buyers - Impact of key factors 2025 and 2030

7.3 Bargaining power of suppliers

Bargaining power of suppliers - Impact of key factors in 2025 and 2030

7.4 Threat of new entrants

Threat of new entrants - Impact of key factors in 2025 and 2030

7.5 Threat of substitutes

Threat of substitutes - Impact of key factors in 2025 and 2030

7.6 Threat of rivalry

Threat of rivalry - Impact of key factors in 2025 and 2030

7.7 Market condition

Chart on Market condition - Five forces 2025 and 2030

8. Market Segmentation by Application

8.1 Market segments

Chart on Application - Market share 2025-2030 (%)
Data Table on Application - Market share 2025-2030 (%)

8.2 Comparison by Application

Chart on Comparison by Application
Data Table on Comparison by Application

8.3 Oil and gas - Market size and forecast 2025-2030

Chart on Oil and gas - Market size and forecast 2025-2030 ($ million)
Data Table on Oil and gas - Market size and forecast 2025-2030 ($ million)
Chart on Oil and gas - Year-over-year growth 2025-2030 (%)
Data Table on Oil and gas - Year-over-year growth 2025-2030 (%)

8.4 Chemical processing - Market size and forecast 2025-2030

Chart on Chemical processing - Market size and forecast 2025-2030 ($ million)
Data Table on Chemical processing - Market size and forecast 2025-2030 ($ million)
Chart on Chemical processing - Year-over-year growth 2025-2030 (%)
Data Table on Chemical processing - Year-over-year growth 2025-2030 (%)

8.5 Medical - Market size and forecast 2025-2030

Chart on Medical - Market size and forecast 2025-2030 ($ million)
Data Table on Medical - Market size and forecast 2025-2030 ($ million)
Chart on Medical - Year-over-year growth 2025-2030 (%)
Data Table on Medical - Year-over-year growth 2025-2030 (%)

8.6 Others - Market size and forecast 2025-2030

Chart on Others - Market size and forecast 2025-2030 ($ million)
Data Table on Others - Market size and forecast 2025-2030 ($ million)
Chart on Others - Year-over-year growth 2025-2030 (%)
Data Table on Others - Year-over-year growth 2025-2030 (%)

8.7 Market opportunity by Application

Market opportunity by Application ($ million)
Data Table on Market opportunity by Application ($ million)

9. Market Segmentation by Product Type

9.1 Market segments

Chart on Product Type - Market share 2025-2030 (%)
Data Table on Product Type - Market share 2025-2030 (%)

9.2 Comparison by Product Type

Chart on Comparison by Product Type
Data Table on Comparison by Product Type

9.3 Melamine - Market size and forecast 2025-2030

Chart on Melamine - Market size and forecast 2025-2030 ($ million)
Data Table on Melamine - Market size and forecast 2025-2030 ($ million)
Chart on Melamine - Year-over-year growth 2025-2030 (%)
Data Table on Melamine - Year-over-year growth 2025-2030 (%)

9.4 Cyanuric chloride - Market size and forecast 2025-2030

Chart on Cyanuric chloride - Market size and forecast 2025-2030 ($ million)
Data Table on Cyanuric chloride - Market size and forecast 2025-2030 ($ million)
Chart on Cyanuric chloride - Year-over-year growth 2025-2030 (%)
Data Table on Cyanuric chloride - Year-over-year growth 2025-2030 (%)

9.5 Cyanuric acid - Market size and forecast 2025-2030

Chart on Cyanuric acid - Market size and forecast 2025-2030 ($ million)
Data Table on Cyanuric acid - Market size and forecast 2025-2030 ($ million)
Chart on Cyanuric acid - Year-over-year growth 2025-2030 (%)
Data Table on Cyanuric acid - Year-over-year growth 2025-2030 (%)

9.6 Market opportunity by Product Type

Market opportunity by Product Type ($ million)
Data Table on Market opportunity by Product Type ($ million)

10. Market Segmentation by Type

10.1 Market segments

Chart on Type - Market share 2025-2030 (%)
Data Table on Type - Market share 2025-2030 (%)

10.2 Comparison by Type

Chart on Comparison by Type
Data Table on Comparison by Type

10.3 Liquid formulations - Market size and forecast 2025-2030

Chart on Liquid formulations - Market size and forecast 2025-2030 ($ million)
Data Table on Liquid formulations - Market size and forecast 2025-2030 ($ million)
Chart on Liquid formulations - Year-over-year growth 2025-2030 (%)
Data Table on Liquid formulations - Year-over-year growth 2025-2030 (%)

10.4 Powder formulations - Market size and forecast 2025-2030

Chart on Powder formulations - Market size and forecast 2025-2030 ($ million)
Data Table on Powder formulations - Market size and forecast 2025-2030 ($ million)
Chart on Powder formulations - Year-over-year growth 2025-2030 (%)
Data Table on Powder formulations - Year-over-year growth 2025-2030 (%)

10.5 Market opportunity by Type

Market opportunity by Type ($ million)
Data Table on Market opportunity by Type ($ million)

11. Customer Landscape

11.1 Customer landscape overview

Analysis of price sensitivity, lifecycle, customer purchase basket, adoption rates, and purchase criteria

12. Geographic Landscape

12.1 Geographic segmentation

Chart on Market share by geography 2025-2030 (%)
Data Table on Market share by geography 2025-2030 (%)

12.2 Geographic comparison

Chart on Geographic comparison
Data Table on Geographic comparison

12.3 North America - Market size and forecast 2025-2030

Chart on North America - Market size and forecast 2025-2030 ($ million)
Data Table on North America - Market size and forecast 2025-2030 ($ million)
Chart on North America - Year-over-year growth 2025-2030 (%)
Data Table on North America - Year-over-year growth 2025-2030 (%)
Chart on Regional Comparison - North America
Data Table on Regional Comparison - North America

12.3.1 US - Market size and forecast 2025-2030

Chart on US - Market size and forecast 2025-2030 ($ million)
Data Table on US - Market size and forecast 2025-2030 ($ million)
Chart on US - Year-over-year growth 2025-2030 (%)
Data Table on US - Year-over-year growth 2025-2030 (%)

12.3.2 Canada - Market size and forecast 2025-2030

Chart on Canada - Market size and forecast 2025-2030 ($ million)
Data Table on Canada - Market size and forecast 2025-2030 ($ million)
Chart on Canada - Year-over-year growth 2025-2030 (%)
Data Table on Canada - Year-over-year growth 2025-2030 (%)

12.3.3 Mexico - Market size and forecast 2025-2030

Chart on Mexico - Market size and forecast 2025-2030 ($ million)
Data Table on Mexico - Market size and forecast 2025-2030 ($ million)
Chart on Mexico - Year-over-year growth 2025-2030 (%)
Data Table on Mexico - Year-over-year growth 2025-2030 (%)

12.4 APAC - Market size and forecast 2025-2030

Chart on APAC - Market size and forecast 2025-2030 ($ million)
Data Table on APAC - Market size and forecast 2025-2030 ($ million)
Chart on APAC - Year-over-year growth 2025-2030 (%)
Data Table on APAC - Year-over-year growth 2025-2030 (%)
Chart on Regional Comparison - APAC
Data Table on Regional Comparison - APAC

12.4.1 China - Market size and forecast 2025-2030

Chart on China - Market size and forecast 2025-2030 ($ million)
Data Table on China - Market size and forecast 2025-2030 ($ million)
Chart on China - Year-over-year growth 2025-2030 (%)
Data Table on China - Year-over-year growth 2025-2030 (%)

12.4.2 India - Market size and forecast 2025-2030

Chart on India - Market size and forecast 2025-2030 ($ million)
Data Table on India - Market size and forecast 2025-2030 ($ million)
Chart on India - Year-over-year growth 2025-2030 (%)
Data Table on India - Year-over-year growth 2025-2030 (%)

12.4.3 Japan - Market size and forecast 2025-2030

Chart on Japan - Market size and forecast 2025-2030 ($ million)
Data Table on Japan - Market size and forecast 2025-2030 ($ million)
Chart on Japan - Year-over-year growth 2025-2030 (%)
Data Table on Japan - Year-over-year growth 2025-2030 (%)

12.4.4 South Korea - Market size and forecast 2025-2030

Chart on South Korea - Market size and forecast 2025-2030 ($ million)
Data Table on South Korea - Market size and forecast 2025-2030 ($ million)
Chart on South Korea - Year-over-year growth 2025-2030 (%)
Data Table on South Korea - Year-over-year growth 2025-2030 (%)

12.4.5 Indonesia - Market size and forecast 2025-2030

Chart on Indonesia - Market size and forecast 2025-2030 ($ million)
Data Table on Indonesia - Market size and forecast 2025-2030 ($ million)
Chart on Indonesia - Year-over-year growth 2025-2030 (%)
Data Table on Indonesia - Year-over-year growth 2025-2030 (%)

12.4.6 Australia - Market size and forecast 2025-2030

Chart on Australia - Market size and forecast 2025-2030 ($ million)
Data Table on Australia - Market size and forecast 2025-2030 ($ million)
Chart on Australia - Year-over-year growth 2025-2030 (%)
Data Table on Australia - Year-over-year growth 2025-2030 (%)

12.5 Europe - Market size and forecast 2025-2030

Chart on Europe - Market size and forecast 2025-2030 ($ million)
Data Table on Europe - Market size and forecast 2025-2030 ($ million)
Chart on Europe - Year-over-year growth 2025-2030 (%)
Data Table on Europe - Year-over-year growth 2025-2030 (%)
Chart on Regional Comparison - Europe
Data Table on Regional Comparison - Europe

12.5.1 Germany - Market size and forecast 2025-2030

Chart on Germany - Market size and forecast 2025-2030 ($ million)
Data Table on Germany - Market size and forecast 2025-2030 ($ million)
Chart on Germany - Year-over-year growth 2025-2030 (%)
Data Table on Germany - Year-over-year growth 2025-2030 (%)

12.5.2 France - Market size and forecast 2025-2030

Chart on France - Market size and forecast 2025-2030 ($ million)
Data Table on France - Market size and forecast 2025-2030 ($ million)
Chart on France - Year-over-year growth 2025-2030 (%)
Data Table on France - Year-over-year growth 2025-2030 (%)

12.5.3 UK - Market size and forecast 2025-2030

Chart on UK - Market size and forecast 2025-2030 ($ million)
Data Table on UK - Market size and forecast 2025-2030 ($ million)
Chart on UK - Year-over-year growth 2025-2030 (%)
Data Table on UK - Year-over-year growth 2025-2030 (%)

12.5.4 Italy - Market size and forecast 2025-2030

Chart on Italy - Market size and forecast 2025-2030 ($ million)
Data Table on Italy - Market size and forecast 2025-2030 ($ million)
Chart on Italy - Year-over-year growth 2025-2030 (%)
Data Table on Italy - Year-over-year growth 2025-2030 (%)

12.5.5 Spain - Market size and forecast 2025-2030

Chart on Spain - Market size and forecast 2025-2030 ($ million)
Data Table on Spain - Market size and forecast 2025-2030 ($ million)
Chart on Spain - Year-over-year growth 2025-2030 (%)
Data Table on Spain - Year-over-year growth 2025-2030 (%)

12.5.6 The Netherlands - Market size and forecast 2025-2030

Chart on The Netherlands - Market size and forecast 2025-2030 ($ million)
Data Table on The Netherlands - Market size and forecast 2025-2030 ($ million)
Chart on The Netherlands - Year-over-year growth 2025-2030 (%)
Data Table on The Netherlands - Year-over-year growth 2025-2030 (%)

12.6 Middle East and Africa - Market size and forecast 2025-2030

Chart on Middle East and Africa - Market size and forecast 2025-2030 ($ million)
Data Table on Middle East and Africa - Market size and forecast 2025-2030 ($ million)
Chart on Middle East and Africa - Year-over-year growth 2025-2030 (%)
Data Table on Middle East and Africa - Year-over-year growth 2025-2030 (%)
Chart on Regional Comparison - Middle East and Africa
Data Table on Regional Comparison - Middle East and Africa

12.6.1 Saudi Arabia - Market size and forecast 2025-2030

Chart on Saudi Arabia - Market size and forecast 2025-2030 ($ million)
Data Table on Saudi Arabia - Market size and forecast 2025-2030 ($ million)
Chart on Saudi Arabia - Year-over-year growth 2025-2030 (%)
Data Table on Saudi Arabia - Year-over-year growth 2025-2030 (%)

12.6.2 UAE - Market size and forecast 2025-2030

Chart on UAE - Market size and forecast 2025-2030 ($ million)
Data Table on UAE - Market size and forecast 2025-2030 ($ million)
Chart on UAE - Year-over-year growth 2025-2030 (%)
Data Table on UAE - Year-over-year growth 2025-2030 (%)

12.6.3 South Africa - Market size and forecast 2025-2030

Chart on South Africa - Market size and forecast 2025-2030 ($ million)
Data Table on South Africa - Market size and forecast 2025-2030 ($ million)
Chart on South Africa - Year-over-year growth 2025-2030 (%)
Data Table on South Africa - Year-over-year growth 2025-2030 (%)

12.6.4 Turkey - Market size and forecast 2025-2030

Chart on Turkey - Market size and forecast 2025-2030 ($ million)
Data Table on Turkey - Market size and forecast 2025-2030 ($ million)
Chart on Turkey - Year-over-year growth 2025-2030 (%)
Data Table on Turkey - Year-over-year growth 2025-2030 (%)

12.6.5 Israel - Market size and forecast 2025-2030

Chart on Israel - Market size and forecast 2025-2030 ($ million)
Data Table on Israel - Market size and forecast 2025-2030 ($ million)
Chart on Israel - Year-over-year growth 2025-2030 (%)
Data Table on Israel - Year-over-year growth 2025-2030 (%)

12.7 South America - Market size and forecast 2025-2030

Chart on South America - Market size and forecast 2025-2030 ($ million)
Data Table on South America - Market size and forecast 2025-2030 ($ million)
Chart on South America - Year-over-year growth 2025-2030 (%)
Data Table on South America - Year-over-year growth 2025-2030 (%)
Chart on Regional Comparison - South America
Data Table on Regional Comparison - South America

12.7.1 Brazil - Market size and forecast 2025-2030

Chart on Brazil - Market size and forecast 2025-2030 ($ million)
Data Table on Brazil - Market size and forecast 2025-2030 ($ million)
Chart on Brazil - Year-over-year growth 2025-2030 (%)
Data Table on Brazil - Year-over-year growth 2025-2030 (%)

12.7.2 Argentina - Market size and forecast 2025-2030

Chart on Argentina - Market size and forecast 2025-2030 ($ million)
Data Table on Argentina - Market size and forecast 2025-2030 ($ million)
Chart on Argentina - Year-over-year growth 2025-2030 (%)
Data Table on Argentina - Year-over-year growth 2025-2030 (%)

12.7.3 Chile - Market size and forecast 2025-2030

Chart on Chile - Market size and forecast 2025-2030 ($ million)
Data Table on Chile - Market size and forecast 2025-2030 ($ million)
Chart on Chile - Year-over-year growth 2025-2030 (%)
Data Table on Chile - Year-over-year growth 2025-2030 (%)

12.8 Market opportunity by geography

Market opportunity by geography ($ million)
Data Tables on Market opportunity by geography ($ million)

13. Drivers, Challenges, and Opportunity

13.1 Market drivers

Agricultural expansion and herbicide demand
Oil and gas scavenging requirements
Industrial resins and polymers

13.2 Market challenges

Rigorous environmental regulations and compliance
Volatile feedstock costs and supply
Emergence of sustainable substitutes

13.3 Impact of drivers and challenges

Impact of drivers and challenges in 2025 and 2030

13.4 Market opportunities

Surge in advanced fuel additives
Expansion of flame-retardant applications
Innovations in pharmaceutical synthesis intermediates

14. Competitive Landscape

14.1 Overview

14.2

Overview on criticality of inputs and factors of differentiation

14.3 Landscape disruption

Overview on factors of disruption

14.4 Industry risks

Impact of key risks on business

15. Competitive Analysis

15.1 Companies profiled

Companies covered

15.2 Company ranking index

15.3 Market positioning of companies

Matrix on companies position and classification

15.4 ADAMA Ltd.

ADAMA Ltd. - Overview
ADAMA Ltd. - Product / Service
ADAMA Ltd. - Key offerings
SWOT

15.5 Albaugh LLC

Albaugh LLC - Overview
Albaugh LLC - Product / Service
Albaugh LLC - Key offerings
SWOT

15.6 Allnex GMBH

Allnex GMBH - Overview
Allnex GMBH - Product / Service
Allnex GMBH - Key offerings
SWOT

15.7 Ashland Inc.

Ashland Inc. - Overview
Ashland Inc. - Business segments
Ashland Inc. - Key news
Ashland Inc. - Key offerings
Ashland Inc. - Segment focus
SWOT

15.8 Baker Hughes Co.

Baker Hughes Co. - Overview
Baker Hughes Co. - Business segments
Baker Hughes Co. - Key news
Baker Hughes Co. - Key offerings
Baker Hughes Co. - Segment focus
SWOT

15.9 BASF SE

BASF SE - Overview
BASF SE - Business segments
BASF SE - Key news
BASF SE - Key offerings
BASF SE - Segment focus
SWOT

15.10 Clariant International Ltd.

Clariant International Ltd. - Overview
Clariant International Ltd. - Business segments
Clariant International Ltd. - Key offerings
Clariant International Ltd. - Segment focus
SWOT

15.11 Corteva Inc.

Corteva Inc. - Overview
Corteva Inc. - Business segments
Corteva Inc. - Key offerings
Corteva Inc. - Segment focus
SWOT

15.12 Ecolab Inc.

Ecolab Inc. - Overview
Ecolab Inc. - Business segments
Ecolab Inc. - Key news
Ecolab Inc. - Key offerings
Ecolab Inc. - Segment focus
SWOT

15.13 Evonik Industries AG

Evonik Industries AG - Overview
Evonik Industries AG - Business segments
Evonik Industries AG - Key news
Evonik Industries AG - Key offerings
Evonik Industries AG - Segment focus
SWOT

15.14 Halliburton Co.

Halliburton Co. - Overview
Halliburton Co. - Business segments
Halliburton Co. - Key news
Halliburton Co. - Key offerings
Halliburton Co. - Segment focus
SWOT

15.15 Nufarm Ltd.

Nufarm Ltd. - Overview
Nufarm Ltd. - Business segments
Nufarm Ltd. - Key offerings
Nufarm Ltd. - Segment focus
SWOT

15.16 Songwon Industrial Co. Ltd.

Songwon Industrial Co. Ltd. - Overview
Songwon Industrial Co. Ltd. - Business segments
Songwon Industrial Co. Ltd. - Key offerings
Songwon Industrial Co. Ltd. - Segment focus
SWOT

15.17 Syngenta AG

Syngenta AG - Overview
Syngenta AG - Product / Service
Syngenta AG - Key offerings
SWOT

15.18 UPL Ltd.

UPL Ltd. - Overview
UPL Ltd. - Business segments
UPL Ltd. - Key offerings
UPL Ltd. - Segment focus
SWOT

16. Appendix

16.1 Scope of the report

Market definition
Objectives
Notes and caveats

16.2 Inclusions and exclusions checklist

Inclusions checklist
Exclusions checklist

16.3 Currency conversion rates for US$

16.4 Research methodology

16.5 Data procurement

Information sources

16.6 Data validation

16.7 Validation techniques employed for market sizing

16.8 Data synthesis

16.9 360 degree market analysis

16.10 List of abbreviations

Research Methodology

Technavio presents a detailed picture of the market by way of study, synthesis, and summation of data from multiple sources. The analysts have presented the various facets of the market with a particular focus on identifying the key industry influencers. The data thus presented is comprehensive, reliable, and the result of extensive research, both primary and secondary.

INFORMATION SOURCES

Primary sources

  • Manufacturers and suppliers
  • Channel partners
  • Industry experts
  • Strategic decision makers

Secondary sources

  • Industry journals and periodicals
  • Government data
  • Financial reports of key industry players
  • Historical data
  • Press releases

DATA ANALYSIS

Data Synthesis

  • Collation of data
  • Estimation of key figures
  • Analysis of derived insights

Data Validation

  • Triangulation with data models
  • Reference against proprietary databases
  • Corroboration with industry experts

REPORT WRITING

Qualitative

  • Market drivers
  • Market challenges
  • Market trends
  • Five forces analysis

Quantitative

  • Market size and forecast
  • Market segmentation
  • Geographical insights
  • Competitive landscape

Interested in this report?

Get your sample now to see our research methodology and insights!

Download Now

Frequently Asked Questions

Triazine market growth will increase by USD 270.6 million during 2026-2030.

The Triazine market is expected to grow at a CAGR of 3.1% during 2026-2030.

Triazine market is segmented by Application (Oil and gas, Chemical processing, Medical, Others) Product type (Melamine, Cyanuric chloride, Cyanuric acid) Type (Liquid formulations, Powder formulations)

ADAMA Ltd., Albaugh LLC, Allnex GMBH, Arxada AG, Ashland Inc., Bakelite GmbH, Baker Hughes Co., BASF SE, Clariant International Ltd., Corteva Inc., Dorf Ketal Chemicals India Ltd., Ecolab Inc., Evonik Industries AG, Foremark Performance Chemicals, Halliburton Co., Nufarm Ltd., Songwon Industrial Co. Ltd., Syngenta AG, The Lubrizol Corp., UPL Ltd. are a few of the key vendors in the Triazine market.

North America will register the highest growth rate of 46% among the other regions. Therefore, the Triazine market in North America is expected to garner significant business opportunities for the vendors during the forecast period.

US, Canada, Mexico, China, India, Japan, South Korea, Indonesia, Australia, Germany, France, UK, Italy, Spain, The Netherlands, Saudi Arabia, UAE, South Africa, Turkey, Israel, Brazil, Argentina, Chile

  • Agricultural expansion and herbicide demand is the driving factor this market.

The Triazine market vendors should focus on grabbing business opportunities from the Application segment as it accounted for the largest market share in the base year.
RIA - Research AI Assistant
Ask RIA
