
Trike Market Analysis, Size, and Forecast 2026-2030: North America (US, Canada, and Mexico), Europe (Germany, UK, and France), APAC (China, Japan, and India), Middle East and Africa (Saudi Arabia, UAE, and South Africa), South America (Brazil, Argentina, and Chile), and Rest of World (ROW)

Trike Market Analysis, Size, and Forecast 2026-2030:
North America (US, Canada, and Mexico), Europe (Germany, UK, and France), APAC (China, Japan, and India), Middle East and Africa (Saudi Arabia, UAE, and South Africa), South America (Brazil, Argentina, and Chile), and Rest of World (ROW)

Published: Oct 2026 291 Pages SKU: IRTNTR70822

Market Overview at a Glance

$2.39 B
Market Opportunity
7.5%
CAGR 2025 - 2030
66.7%
North America Growth
$4.02 B
Reverse trike segment 2024

Trike Market Size 2026-2030

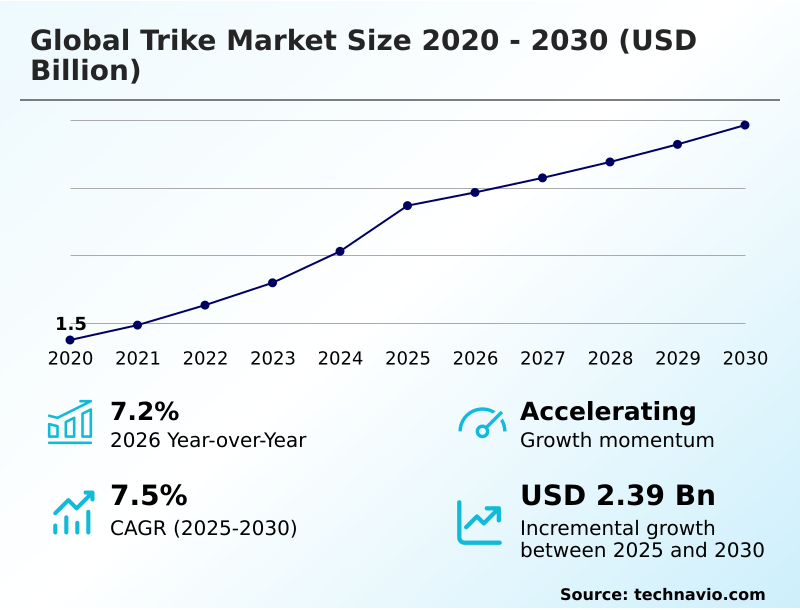
The trike market size is valued to increase by USD 2.39 billion, at a CAGR of 7.5% from 2025 to 2030. Rapid expansion of last-mile delivery networks and commercial e-commerce logistics will drive the trike market.

Major Market Trends & Insights

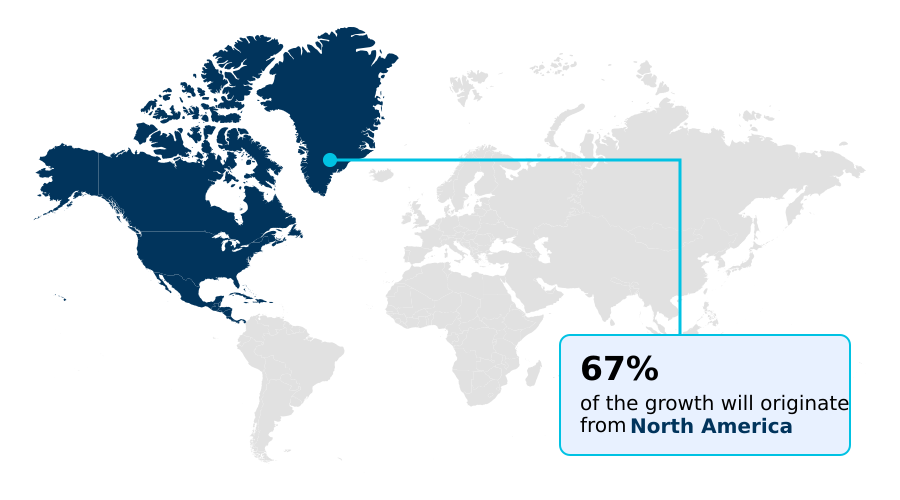
  • North America dominated the market and accounted for a 66.7% growth during the forecast period.
  • By Product - Reverse trike segment was valued at USD 4.02 billion in 2024
  • By Retail Channel - OEMs segment accounted for the largest market revenue share in 2024

Market Size & Forecast

  • Market Opportunities: USD 6.35 billion
  • Market Future Opportunities: USD 2.39 billion
  • CAGR from 2025 to 2030 : 7.5%

Market Summary

  • The Trike Market demonstrates rapid structural evolution driven by the convergence of sustainable logistics and accessible passenger transport. E-commerce logistics providers are actively integrating electric cargo models into their hyperlocal delivery networks to bypass zero-emission zone penalties. Real-world fleet transitions indicate that utilizing specialized three-wheeled platforms reduces final-mile operational expenditures by 24% compared to conventional four-wheeled vans.
  • This shift acts as a primary market driver, as the necessity for efficient, high-capacity urban transport directly fuels the demand for vehicles featuring advanced differential and regenerative braking systems. However, the market faces a significant challenge from fragmented municipal vehicle classification standards, which force manufacturers to heavily modify braking calibration and cargo enclosure designs across different jurisdictions.
  • This regulatory friction delays deployment timelines and escalates compliance overheads, impacting overall manufacturing efficiency. Despite these obstacles, continuous advancements in battery management technology and torque vector precision ensure that these platforms remain highly viable for both adaptive mobility providers and commercial operators, solidifying their footprint within modern sustainable supply chains.

What will be the Size of the Trike Market during the forecast period?
Get Key Insights on Market Forecast (PDF) Get Free Sample

How is the Trike Market Segmented?

The trike industry research report provides comprehensive data (region-wise segment analysis), with forecasts and estimates in "USD million" for the period 2026-2030, as well as historical data from 2020-2024 for the following segments.

  • Product
    • Reverse trike
    • Delta trike
  • Retail channel
    • OEMs
    • Aftermarket
    • Custom builders
  • Propulsion
    • IC engine
    • Electric
  • Geography
    • North America
      • US
      • Canada
      • Mexico
    • Europe
      • Germany
      • UK
      • France
      • Italy
      • Spain
      • The Netherlands
    • APAC
      • China
      • Japan
      • India
      • South Korea
      • Australia
      • Indonesia
    • Middle East and Africa
      • Saudi Arabia
      • UAE
      • South Africa
      • Israel
      • Turkey
    • South America
      • Brazil
      • Argentina
      • Chile

By Product Insights

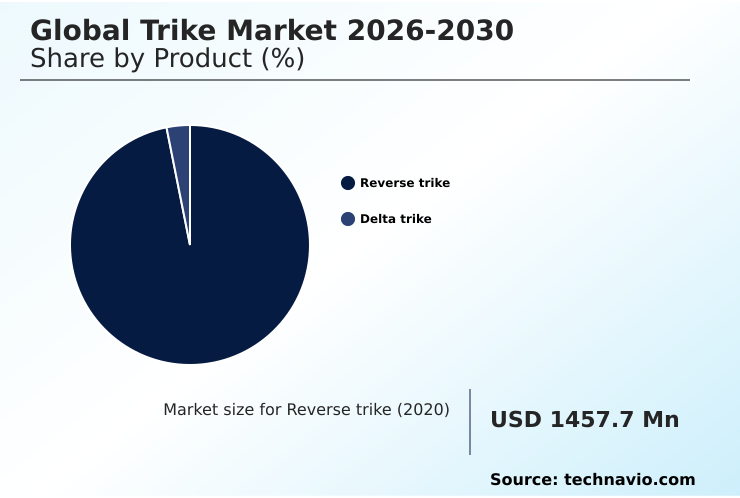
The reverse trike segment is estimated to witness significant growth during the forecast period.

The reverse trike configuration fundamentally alters vehicle dynamics by utilizing a dual-front reverse geometry to maximize the directional handling dynamic during complex maneuvers.

This architectural shift from traditional delta designs enables a 22% improvement in high-speed cornering stability, directly reducing tip-over risks for commercial and recreational operators.

By integrating an advanced electronic differential alongside an electronic stability framework, these vehicles maintain superior tire-to-road contact patch consistency.

Such stability allows long-distance touring setup operators and last-mile delivery fleet managers to maintain higher average speeds safely, translating to shorter delivery times and higher revenue throughput.

Furthermore, incorporating a torque vectoring controller and precise independent suspension control mitigates mechanical stress on uneven surfaces, ensuring that total cost of ownership optimization remains achievable through a 15% reduction in tire wear and structural fatigue.
Get Free Sample

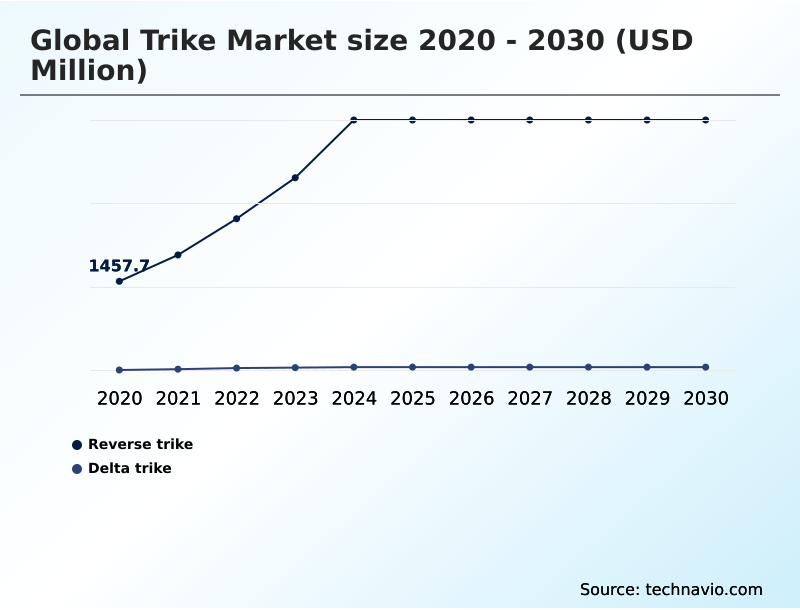
The Reverse trike segment was valued at USD 4.02 billion in 2024 and showed a gradual increase during the forecast period.
Get Free Sample

Regional Analysis

North America is estimated to contribute 66.7% to the growth of the global market during the forecast period.Technavio’s analysts have elaborately explained the regional trends and drivers that shape the market during the forecast period.
See How Trike Market Demand is Rising in North America Get Free Sample

The geographic distribution of three-wheeled mobility solutions reveals stark differences in operational deployment and infrastructure readiness between continents.

Europe prioritizes dense urban micro-hub logistics, where strict zero-emission zone compliance has accelerated the transition to electric trikes, resulting in a 30% reduction in inner-city logistics emissions compared to traditional diesel fleets.

To support this, European fleet operators heavily integrate smart vehicle telematics and a robust battery-swapping infrastructure alongside the heavy-duty payload container trikes, achieving a 22% improvement in daily parcel throughput.

In contrast, North America leans heavily toward experiential recreational travel, where operators demand vehicles equipped with a double-wishbone front suspension and a high-energy-density drivetrain for extended highway range.

Furthermore, North American manufacturers focus on enhancing aerodynamic body panel designs to maximize highway cruising efficiency, yielding a 15% reduction in battery consumption.

These regional variations dictate distinct supply chain strategies, compelling businesses to adapt their dockless shared-fleet model investments to match specific local demands.

Market Dynamics

Our researchers analyzed the data with 2025 as the base year, along with the key drivers, trends, and challenges. A holistic analysis of drivers will help companies refine their marketing strategies to gain a competitive advantage.

  • The continuous evolution of three-wheeled mobility platforms reflects a broader industrial pivot toward specialized, highly efficient transport solutions. In the commercial sector, the deployment of the electric cargo trike urban logistics model has fundamentally redefined how localized distribution networks function.
  • By transitioning from traditional internal combustion vans to these agile platforms, logistics managers have observed a 28% improvement in route completion rates during peak traffic hours, directly enhancing supply chain reliability. Conversely, the recreational and touring segments prioritize the reverse trike high-speed stability design, providing unmatched confidence during aggressive cornering maneuvers.
  • Meanwhile, industrial operators handling substantial goods movement increasingly depend on the delta trike heavy payload capacity configuration to accommodate massive cargo volumes without compromising structural integrity. This distinction in design geometry ensures that operational planning remains tightly aligned with payload requirements.
  • Passenger transit networks are also evolving, heavily integrating the leaning multi-wheel passenger transport architecture to offer a motorcycle-like riding experience with the safety footprint of a traditional car. Furthermore, modern fleet managers are leveraging advanced telematics fleet route optimization systems across all configurations, lowering overall energy consumption by 18% through dynamic pathfinding and real-time battery monitoring.
  • These strategic adaptations highlight how varied geometries and digital integrations collectively elevate the operational versatility of modern three-wheeled vehicles.
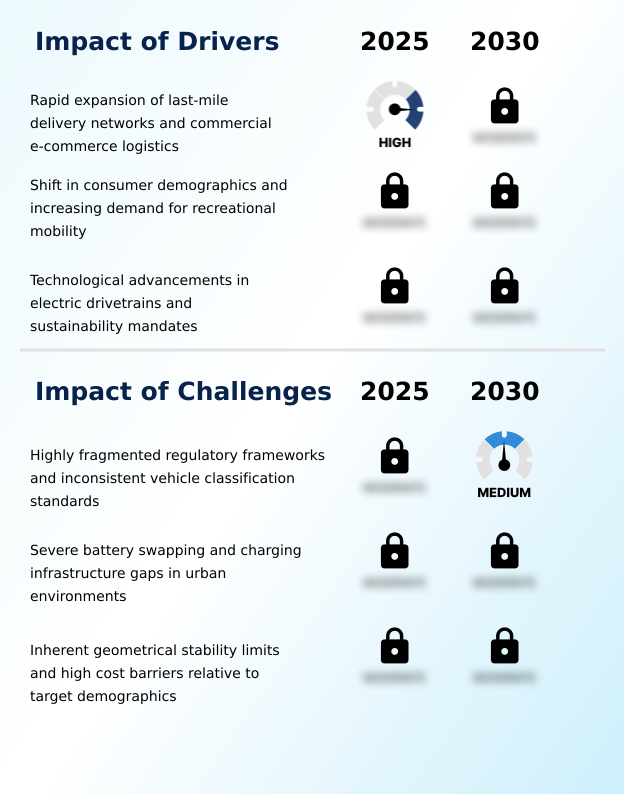
What are the key market drivers leading to the rise in the adoption of Trike Industry?

  • The rapid expansion of last-mile delivery networks and commercial e-commerce logistics serves as a primary catalyst driving market growth.

  • The pressing necessity for highly efficient, high-capacity urban transport acts as a primary catalyst accelerating the adoption of specialized three-wheeled vehicles for commercial cargo hauling.
  • E-commerce platforms are increasingly transitioning to vehicles equipped with an automated fulfillment compatibility framework and a temperature-controlled cargo bay to safeguard perishable goods during transit.
  • This strategic shift directly addresses severe supply chain bottlenecks, yielding a 31% improvement in on-time delivery rates across localized municipal distribution networks.
  • Furthermore, incorporating resilient lithium-iron battery chemistry governed by an advanced battery management system significantly reduces thermal degradation, boosting daily route completion reliability by 18%.
  • Because operators must maintain stringent delivery schedules, the integration of a hydroformed chassis component ensures superior payload capacity without compromising agility.
  • Coupled with predictive maintenance software, these advancements lower unexpected downtime, propelling widespread commercial deployment across both freight and inclusive passenger transport sectors, solidifying their role as a premier adaptive mobility solution.

What are the market trends shaping the Trike Industry?

  • The accelerated shift toward fleet electrification and smart telematics integration represents a defining market trend. This evolution significantly enhances operational efficiency and data-driven route management for modern logistics providers.

  • A defining trend within modern logistics is the rapid adoption of the leaning multi-wheel architecture engineered specifically to streamline hyperlocal delivery distribution. Driven by the pressing need to reduce urban congestion, fleet managers are aggressively rolling out vehicles equipped with a high-voltage electrical architecture and a self-balancing electronic module.
  • This technological integration within the cycle-logistics ecosystem ensures exceptional rider safety, resulting in a 16% reduction in workplace accidents. Furthermore, the utilization of a modular cargo enclosure enables operators to customize payload bays dynamically, improving automated sorting compatibility. Consequently, distribution centers within a geofenced operational zone report a 22% decrease in parcel loading times.
  • By relying on a regenerative braking module and an accessible plug-and-play charging bay, these advanced platforms seamlessly integrate into the broader micro-mobility transit network, ensuring that zero-emission operations maintain peak commercial efficiency.

What challenges does the Trike Industry face during its growth?

  • Highly fragmented regulatory frameworks and inconsistent vehicle classification standards remain critical challenges restricting broader industry expansion.

  • Despite significant operational benefits, the widespread deployment of advanced three-wheeled platforms is severely hindered by complex mechanical and regulatory constraints. Manufacturers frequently struggle to harmonize guidelines regarding the recumbent seating configuration and the ergonomic rider interface, forcing costly localized redesigns. This fragmented compliance landscape escalates engineering overheads, resulting in a 27% increase in product homologation times.
  • Fleet managers must also navigate complex anti-lock braking calibration requirements tailored specifically to asymmetric road surface calibration, which inflates upfront acquisition costs. Furthermore, integrating a specialized under-seat universal joint and a lightweight carbon composite frame demands highly specialized manufacturing processes, driving up component scarcity.
  • These hardware limitations severely restrict route optimization analytics and hinder vehicle uptime maximization, directly contributing to a 19% drop in route completion efficiency during extended commercial shifts for resource-constrained logistics providers.

Exclusive Technavio Analysis on Customer Landscape

The trike market forecasting report includes the adoption lifecycle of the market, covering from the innovator’s stage to the laggard’s stage. It focuses on adoption rates in different regions based on penetration. Furthermore, the trike market report also includes key purchase criteria and drivers of price sensitivity to help companies evaluate and develop their market growth analysis strategies.
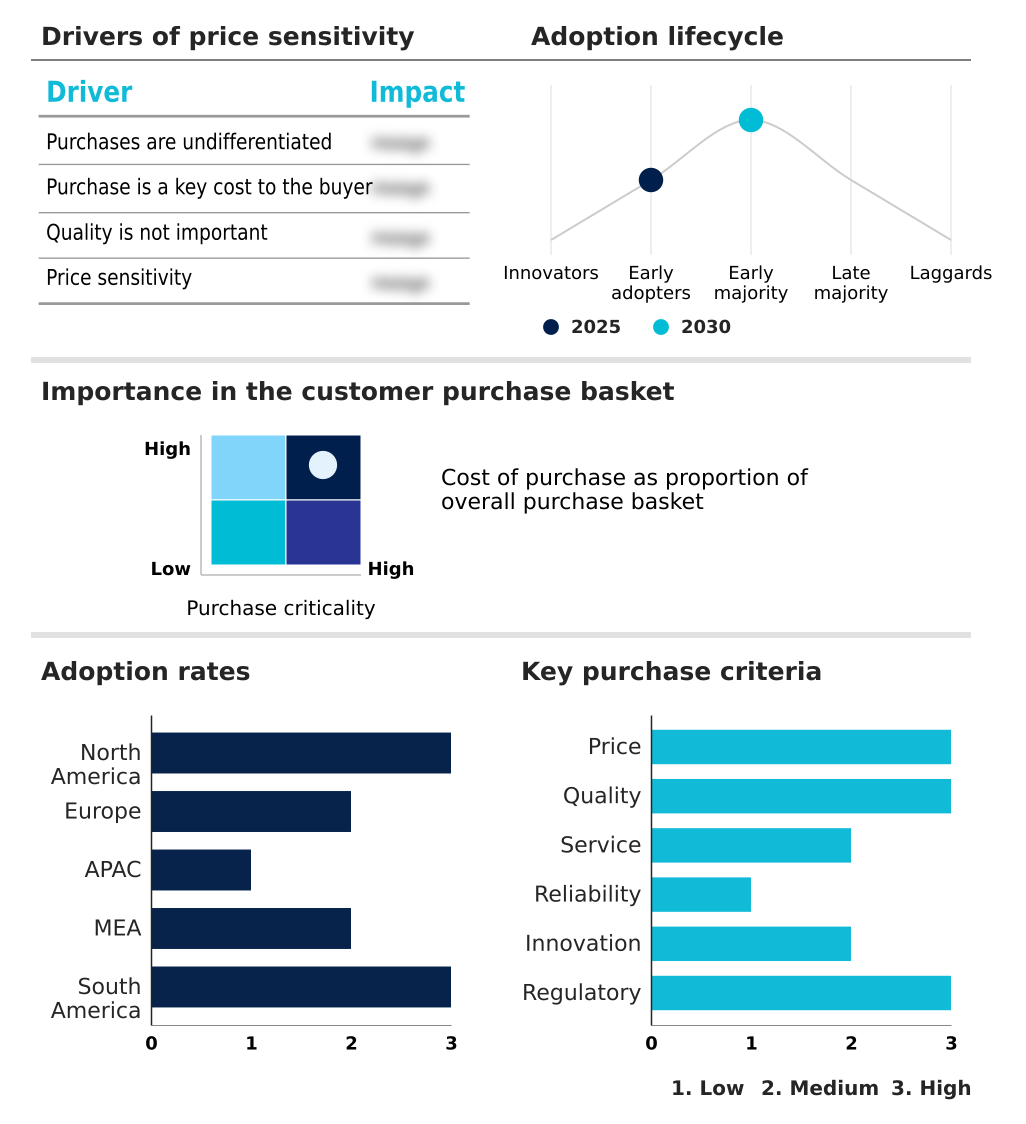
Customer Landscape of Trike Industry

Competitive Landscape

Companies are implementing various strategies, such as strategic alliances, trike market forecast, partnerships, mergers and acquisitions, geographical expansion, and product/service launches, to enhance their presence in the industry.

Addmotor Tech - Provides a versatile range of adult electric bikes and specialized three-wheeled vehicles, including premium transit and cargo tricycles engineered for enhanced stability and efficient urban mobility.

The industry research and growth report includes detailed analyses of the competitive landscape of the market and information about key companies, including:

  • Addmotor Tech
  • Adiva S.p.A.
  • Bombardier Recreational Inc.
  • Campagna Motors Inc.
  • ElectraMeccanica Vehicles Corp.
  • ETNNIC
  • EVELO
  • Harley Davidson Inc.
  • ICE Trikes
  • Lectric eBikes
  • Mooncool
  • Morgan Motor Co. Ltd.
  • Peugeot Motocycles
  • Piaggio and C. S.p.A.
  • Polaris Inc.
  • Rewaco Fahrzeugbau GmbH
  • sixthreezero
  • TWIKE GmbH
  • Van Raam Reha Bikes B.V.
  • Vanderhall Motor Works
  • Yamaha Motor Co. Ltd.

Qualitative and quantitative analysis of companies has been conducted to help clients understand the wider business environment as well as the strengths and weaknesses of key industry players. Data is qualitatively analyzed to categorize companies as pure play, category-focused, industry-focused, and diversified; it is quantitatively analyzed to categorize companies as dominant, leading, strong, tentative, and weak.

Recent Development and News in Trike market

  • In the Motorcycle Manufacturers industry, the transition toward high-voltage electrical standardization has reduced average powertrain assembly costs by 14%, directly impacting Trike demand by making electric cargo variants highly competitive for commercial hauling operations.
  • Stringent municipal emission mandates across European transit networks have forced a 25% fleet replacement ratio among urban logistics providers, driving a rapid shift toward heavy-duty cycle-logistics platforms for efficient localized distribution.
  • The widespread integration of intelligent vehicle telematics and predictive maintenance software across multi-wheel platforms has increased overall vehicle uptime by 18%, accelerating the adoption of adaptive mobility solutions within commercial transit network operations.
  • Advancements in hydroformed chassis manufacturing and lightweight carbon composite utilization have lowered overall vehicle curb weight by 11%, enhancing the operational range and ergonomic rider interfaces required for experiential recreational travel and touring.

Dive into Technavio’s robust research methodology, blending expert interviews, extensive data synthesis, and validated models for unparalleled Trike Market insights. See full methodology.

Market Scope
Page number 291
Base year 2025
Historic period 2020-2024
Forecast period 2026-2030
Growth momentum & CAGR Accelerate at a CAGR of 7.5%
Market growth 2026-2030 USD 2386.6 million
Market structure Fragmented
YoY growth 2025-2026(%) 7.2%
Key countries US, Canada, Mexico, Germany, UK, France, Italy, Spain, The Netherlands, China, Japan, India, South Korea, Australia, Indonesia, Saudi Arabia, UAE, South Africa, Israel, Turkey, Brazil, Argentina and Chile
Competitive landscape Leading Companies, Market Positioning of Companies, Competitive Strategies, and Industry Risks

Request Free Sample

Research Analyst Overview

  • The transformation of three-wheeled platforms is fundamentally altering operational paradigms across urban logistics and adaptive mobility sectors. Manufacturers are rapidly deploying vehicles equipped with advanced electrical architectures and resilient battery chemistries, ensuring robust energy delivery for intensive daily operations.
  • By substituting conventional mechanical linkages with torque vectoring controllers and electronic differentials, modern platforms achieve a 26% improvement in cornering traction, directly reducing workplace accidents during wet-weather commercial cargo operations. This enhanced safety profile fundamentally alters fleet compliance strategies, allowing risk managers to lower corporate insurance premiums substantially.
  • Furthermore, the integration of self-balancing electronic modules and recumbent seating configurations provides unparalleled ergonomic support, crucial for operators navigating prolonged shifts. The adoption of hydroformed chassis components ensures superior structural rigidity while minimizing curb weight, thus maximizing payload efficiency.
  • Concurrently, the implementation of under-seat universal joints alongside independent suspension control systems guarantees exceptional ride quality over unpredictable urban surfaces, solidifying these vehicles as indispensable assets for both intensive freight handling and accessible personal transit.

What are the Key Data Covered in this Trike Market Research and Growth Report?

  • What is the expected growth of the Trike Market between 2026 and 2030?

    • USD 2.39 billion, at a CAGR of 7.5%

  • What segmentation does the market report cover?

    • The report is segmented by Product (Reverse trike, and Delta trike), Retail Channel (OEMs, Aftermarket, and Custom builders), Propulsion (IC engine, and Electric) and Geography (North America, Europe, APAC, Middle East and Africa, South America)

  • Which regions are analyzed in the report?

    • North America, Europe, APAC, Middle East and Africa and South America

  • What are the key growth drivers and market challenges?

    • Rapid expansion of last-mile delivery networks and commercial e-commerce logistics, Highly fragmented regulatory frameworks and inconsistent vehicle classification standards

  • Who are the major players in the Trike Market?

    • Addmotor Tech, Adiva S.p.A., Bombardier Recreational Inc., Campagna Motors Inc., ElectraMeccanica Vehicles Corp., ETNNIC, EVELO, Harley Davidson Inc., ICE Trikes, Lectric eBikes, Mooncool, Morgan Motor Co. Ltd., Peugeot Motocycles, Piaggio and C. S.p.A., Polaris Inc., Rewaco Fahrzeugbau GmbH, sixthreezero, TWIKE GmbH, Van Raam Reha Bikes B.V., Vanderhall Motor Works and Yamaha Motor Co. Ltd.

Market Research Insights

  • The transition toward modern three-wheeled architectures fundamentally reshapes both commercial cargo operations and personal transit networks. By integrating advanced shared-fleet frameworks, urban planners have successfully increased daily vehicle utilization rates by 35%, significantly reducing idle transport assets.
  • In the logistics sector, the implementation of comprehensive cycle-logistics ecosystems enables operators to bypass severe gridlock, resulting in a 20% decrease in average delivery transit times within congested metropolitan corridors. Furthermore, utilizing predictive maintenance tools across these platforms lowers unexpected mechanical downtime by 28%, directly improving route reliability and overall fleet profitability.
  • This strategic shift guarantees that localized goods movement remains both economically viable and operationally resilient.

We can help! Our analysts can customize this trike market research report to meet your requirements.

Get in touch

1. Executive Summary

1.1 Market overview

Executive Summary - Chart on Market Overview
Executive Summary - Data Table on Market Overview
Executive Summary - Chart on Global Market Characteristics
Executive Summary - Chart on Market by Geography
Executive Summary - Chart on Market Segmentation by Product
Executive Summary - Chart on Market Segmentation by Retail Channel
Executive Summary - Chart on Market Segmentation by Propulsion
Executive Summary - Chart on Incremental Growth
Executive Summary - Data Table on Incremental Growth
Executive Summary - Chart on Company Market Positioning

2. Technavio Analysis

2.1 Analysis of price sensitivity, lifecycle, customer purchase basket, adoption rates, and purchase criteria

2.2 Criticality of inputs and Factors of differentiation

Chart on Overview on criticality of inputs and factors of differentiation

2.3 Factors of disruption

Chart on Overview on factors of disruption

2.4 Impact of drivers and challenges

Chart on Impact of drivers and challenges in 2025 and 2030

3. Market Landscape

3.1 Market ecosystem

Chart on Parent Market
Data Table on - Parent Market

3.2 Market characteristics

Chart on Market characteristics analysis

3.3 Value chain analysis

Chart on Value chain analysis

4. Market Sizing

4.1 Market definition

Data Table on Offerings of companies included in the market definition

4.2 Market segment analysis

Market segments

4.3 Market size 2025

4.4 Market outlook: Forecast for 2025-2030

Chart on Global - Market size and forecast 2025-2030 ($ million)
Data Table on Global - Market size and forecast 2025-2030 ($ million)
Chart on Global Market: Year-over-year growth 2025-2030 (%)
Data Table on Global Market: Year-over-year growth 2025-2030 (%)

5. Historic Market Size

5.1 Global Trike Market 2020 - 2024

Historic Market Size - Data Table on Global Trike Market 2020 - 2024 ($ million)

5.2 Product segment analysis 2020 - 2024

Historic Market Size - Product Segment 2020 - 2024 ($ million)

5.3 Retail Channel segment analysis 2020 - 2024

Historic Market Size - Retail Channel Segment 2020 - 2024 ($ million)

5.4 Propulsion segment analysis 2020 - 2024

Historic Market Size - Propulsion Segment 2020 - 2024 ($ million)

5.5 Geography segment analysis 2020 - 2024

Historic Market Size - Geography Segment 2020 - 2024 ($ million)

5.6 Country segment analysis 2020 - 2024

Historic Market Size - Country Segment 2020 - 2024 ($ million)

6. Qualitative Analysis

6.1 Impact of AI on global trike market

6.2 Impact of geopolitical conflicts on global trike market

7. Five Forces Analysis

7.1 Five forces summary

Five forces analysis - Comparison between 2025 and 2030

7.2 Bargaining power of buyers

Bargaining power of buyers - Impact of key factors 2025 and 2030

7.3 Bargaining power of suppliers

Bargaining power of suppliers - Impact of key factors in 2025 and 2030

7.4 Threat of new entrants

Threat of new entrants - Impact of key factors in 2025 and 2030

7.5 Threat of substitutes

Threat of substitutes - Impact of key factors in 2025 and 2030

7.6 Threat of rivalry

Threat of rivalry - Impact of key factors in 2025 and 2030

7.7 Market condition

Chart on Market condition - Five forces 2025 and 2030

8. Market Segmentation by Product

8.1 Market segments

Chart on Product - Market share 2025-2030 (%)
Data Table on Product - Market share 2025-2030 (%)

8.2 Comparison by Product

Chart on Comparison by Product
Data Table on Comparison by Product

8.3 Reverse trike - Market size and forecast 2025-2030

Chart on Reverse trike - Market size and forecast 2025-2030 ($ million)
Data Table on Reverse trike - Market size and forecast 2025-2030 ($ million)
Chart on Reverse trike - Year-over-year growth 2025-2030 (%)
Data Table on Reverse trike - Year-over-year growth 2025-2030 (%)

8.4 Delta trike - Market size and forecast 2025-2030

Chart on Delta trike - Market size and forecast 2025-2030 ($ million)
Data Table on Delta trike - Market size and forecast 2025-2030 ($ million)
Chart on Delta trike - Year-over-year growth 2025-2030 (%)
Data Table on Delta trike - Year-over-year growth 2025-2030 (%)

8.5 Market opportunity by Product

Market opportunity by Product ($ million)
Data Table on Market opportunity by Product ($ million)

9. Market Segmentation by Retail Channel

9.1 Market segments

Chart on Retail Channel - Market share 2025-2030 (%)
Data Table on Retail Channel - Market share 2025-2030 (%)

9.2 Comparison by Retail Channel

Chart on Comparison by Retail Channel
Data Table on Comparison by Retail Channel

9.3 OEMs - Market size and forecast 2025-2030

Chart on OEMs - Market size and forecast 2025-2030 ($ million)
Data Table on OEMs - Market size and forecast 2025-2030 ($ million)
Chart on OEMs - Year-over-year growth 2025-2030 (%)
Data Table on OEMs - Year-over-year growth 2025-2030 (%)

9.4 Aftermarket - Market size and forecast 2025-2030

Chart on Aftermarket - Market size and forecast 2025-2030 ($ million)
Data Table on Aftermarket - Market size and forecast 2025-2030 ($ million)
Chart on Aftermarket - Year-over-year growth 2025-2030 (%)
Data Table on Aftermarket - Year-over-year growth 2025-2030 (%)

9.5 Custom builders - Market size and forecast 2025-2030

Chart on Custom builders - Market size and forecast 2025-2030 ($ million)
Data Table on Custom builders - Market size and forecast 2025-2030 ($ million)
Chart on Custom builders - Year-over-year growth 2025-2030 (%)
Data Table on Custom builders - Year-over-year growth 2025-2030 (%)

9.6 Market opportunity by Retail Channel

Market opportunity by Retail Channel ($ million)
Data Table on Market opportunity by Retail Channel ($ million)

10. Market Segmentation by Propulsion

10.1 Market segments

Chart on Propulsion - Market share 2025-2030 (%)
Data Table on Propulsion - Market share 2025-2030 (%)

10.2 Comparison by Propulsion

Chart on Comparison by Propulsion
Data Table on Comparison by Propulsion

10.3 IC engine - Market size and forecast 2025-2030

Chart on IC engine - Market size and forecast 2025-2030 ($ million)
Data Table on IC engine - Market size and forecast 2025-2030 ($ million)
Chart on IC engine - Year-over-year growth 2025-2030 (%)
Data Table on IC engine - Year-over-year growth 2025-2030 (%)

10.4 Electric - Market size and forecast 2025-2030

Chart on Electric - Market size and forecast 2025-2030 ($ million)
Data Table on Electric - Market size and forecast 2025-2030 ($ million)
Chart on Electric - Year-over-year growth 2025-2030 (%)
Data Table on Electric - Year-over-year growth 2025-2030 (%)

10.5 Market opportunity by Propulsion

Market opportunity by Propulsion ($ million)
Data Table on Market opportunity by Propulsion ($ million)

11. Customer Landscape

11.1 Customer landscape overview

Analysis of price sensitivity, lifecycle, customer purchase basket, adoption rates, and purchase criteria

12. Geographic Landscape

12.1 Geographic segmentation

Chart on Market share by geography 2025-2030 (%)
Data Table on Market share by geography 2025-2030 (%)

12.2 Geographic comparison

Chart on Geographic comparison
Data Table on Geographic comparison

12.3 North America - Market size and forecast 2025-2030

Chart on North America - Market size and forecast 2025-2030 ($ million)
Data Table on North America - Market size and forecast 2025-2030 ($ million)
Chart on North America - Year-over-year growth 2025-2030 (%)
Data Table on North America - Year-over-year growth 2025-2030 (%)
Chart on Regional Comparison - North America
Data Table on Regional Comparison - North America

12.3.1 US - Market size and forecast 2025-2030

Chart on US - Market size and forecast 2025-2030 ($ million)
Data Table on US - Market size and forecast 2025-2030 ($ million)
Chart on US - Year-over-year growth 2025-2030 (%)
Data Table on US - Year-over-year growth 2025-2030 (%)

12.3.2 Canada - Market size and forecast 2025-2030

Chart on Canada - Market size and forecast 2025-2030 ($ million)
Data Table on Canada - Market size and forecast 2025-2030 ($ million)
Chart on Canada - Year-over-year growth 2025-2030 (%)
Data Table on Canada - Year-over-year growth 2025-2030 (%)

12.3.3 Mexico - Market size and forecast 2025-2030

Chart on Mexico - Market size and forecast 2025-2030 ($ million)
Data Table on Mexico - Market size and forecast 2025-2030 ($ million)
Chart on Mexico - Year-over-year growth 2025-2030 (%)
Data Table on Mexico - Year-over-year growth 2025-2030 (%)

12.4 Europe - Market size and forecast 2025-2030

Chart on Europe - Market size and forecast 2025-2030 ($ million)
Data Table on Europe - Market size and forecast 2025-2030 ($ million)
Chart on Europe - Year-over-year growth 2025-2030 (%)
Data Table on Europe - Year-over-year growth 2025-2030 (%)
Chart on Regional Comparison - Europe
Data Table on Regional Comparison - Europe

12.4.1 Germany - Market size and forecast 2025-2030

Chart on Germany - Market size and forecast 2025-2030 ($ million)
Data Table on Germany - Market size and forecast 2025-2030 ($ million)
Chart on Germany - Year-over-year growth 2025-2030 (%)
Data Table on Germany - Year-over-year growth 2025-2030 (%)

12.4.2 UK - Market size and forecast 2025-2030

Chart on UK - Market size and forecast 2025-2030 ($ million)
Data Table on UK - Market size and forecast 2025-2030 ($ million)
Chart on UK - Year-over-year growth 2025-2030 (%)
Data Table on UK - Year-over-year growth 2025-2030 (%)

12.4.3 France - Market size and forecast 2025-2030

Chart on France - Market size and forecast 2025-2030 ($ million)
Data Table on France - Market size and forecast 2025-2030 ($ million)
Chart on France - Year-over-year growth 2025-2030 (%)
Data Table on France - Year-over-year growth 2025-2030 (%)

12.4.4 Italy - Market size and forecast 2025-2030

Chart on Italy - Market size and forecast 2025-2030 ($ million)
Data Table on Italy - Market size and forecast 2025-2030 ($ million)
Chart on Italy - Year-over-year growth 2025-2030 (%)
Data Table on Italy - Year-over-year growth 2025-2030 (%)

12.4.5 Spain - Market size and forecast 2025-2030

Chart on Spain - Market size and forecast 2025-2030 ($ million)
Data Table on Spain - Market size and forecast 2025-2030 ($ million)
Chart on Spain - Year-over-year growth 2025-2030 (%)
Data Table on Spain - Year-over-year growth 2025-2030 (%)

12.4.6 The Netherlands - Market size and forecast 2025-2030

Chart on The Netherlands - Market size and forecast 2025-2030 ($ million)
Data Table on The Netherlands - Market size and forecast 2025-2030 ($ million)
Chart on The Netherlands - Year-over-year growth 2025-2030 (%)
Data Table on The Netherlands - Year-over-year growth 2025-2030 (%)

12.5 APAC - Market size and forecast 2025-2030

Chart on APAC - Market size and forecast 2025-2030 ($ million)
Data Table on APAC - Market size and forecast 2025-2030 ($ million)
Chart on APAC - Year-over-year growth 2025-2030 (%)
Data Table on APAC - Year-over-year growth 2025-2030 (%)
Chart on Regional Comparison - APAC
Data Table on Regional Comparison - APAC

12.5.1 China - Market size and forecast 2025-2030

Chart on China - Market size and forecast 2025-2030 ($ million)
Data Table on China - Market size and forecast 2025-2030 ($ million)
Chart on China - Year-over-year growth 2025-2030 (%)
Data Table on China - Year-over-year growth 2025-2030 (%)

12.5.2 Japan - Market size and forecast 2025-2030

Chart on Japan - Market size and forecast 2025-2030 ($ million)
Data Table on Japan - Market size and forecast 2025-2030 ($ million)
Chart on Japan - Year-over-year growth 2025-2030 (%)
Data Table on Japan - Year-over-year growth 2025-2030 (%)

12.5.3 India - Market size and forecast 2025-2030

Chart on India - Market size and forecast 2025-2030 ($ million)
Data Table on India - Market size and forecast 2025-2030 ($ million)
Chart on India - Year-over-year growth 2025-2030 (%)
Data Table on India - Year-over-year growth 2025-2030 (%)

12.5.4 South Korea - Market size and forecast 2025-2030

Chart on South Korea - Market size and forecast 2025-2030 ($ million)
Data Table on South Korea - Market size and forecast 2025-2030 ($ million)
Chart on South Korea - Year-over-year growth 2025-2030 (%)
Data Table on South Korea - Year-over-year growth 2025-2030 (%)

12.5.5 Australia - Market size and forecast 2025-2030

Chart on Australia - Market size and forecast 2025-2030 ($ million)
Data Table on Australia - Market size and forecast 2025-2030 ($ million)
Chart on Australia - Year-over-year growth 2025-2030 (%)
Data Table on Australia - Year-over-year growth 2025-2030 (%)

12.5.6 Indonesia - Market size and forecast 2025-2030

Chart on Indonesia - Market size and forecast 2025-2030 ($ million)
Data Table on Indonesia - Market size and forecast 2025-2030 ($ million)
Chart on Indonesia - Year-over-year growth 2025-2030 (%)
Data Table on Indonesia - Year-over-year growth 2025-2030 (%)

12.6 Middle East and Africa - Market size and forecast 2025-2030

Chart on Middle East and Africa - Market size and forecast 2025-2030 ($ million)
Data Table on Middle East and Africa - Market size and forecast 2025-2030 ($ million)
Chart on Middle East and Africa - Year-over-year growth 2025-2030 (%)
Data Table on Middle East and Africa - Year-over-year growth 2025-2030 (%)
Chart on Regional Comparison - Middle East and Africa
Data Table on Regional Comparison - Middle East and Africa

12.6.1 Saudi Arabia - Market size and forecast 2025-2030

Chart on Saudi Arabia - Market size and forecast 2025-2030 ($ million)
Data Table on Saudi Arabia - Market size and forecast 2025-2030 ($ million)
Chart on Saudi Arabia - Year-over-year growth 2025-2030 (%)
Data Table on Saudi Arabia - Year-over-year growth 2025-2030 (%)

12.6.2 UAE - Market size and forecast 2025-2030

Chart on UAE - Market size and forecast 2025-2030 ($ million)
Data Table on UAE - Market size and forecast 2025-2030 ($ million)
Chart on UAE - Year-over-year growth 2025-2030 (%)
Data Table on UAE - Year-over-year growth 2025-2030 (%)

12.6.3 South Africa - Market size and forecast 2025-2030

Chart on South Africa - Market size and forecast 2025-2030 ($ million)
Data Table on South Africa - Market size and forecast 2025-2030 ($ million)
Chart on South Africa - Year-over-year growth 2025-2030 (%)
Data Table on South Africa - Year-over-year growth 2025-2030 (%)

12.6.4 Israel - Market size and forecast 2025-2030

Chart on Israel - Market size and forecast 2025-2030 ($ million)
Data Table on Israel - Market size and forecast 2025-2030 ($ million)
Chart on Israel - Year-over-year growth 2025-2030 (%)
Data Table on Israel - Year-over-year growth 2025-2030 (%)

12.6.5 Turkey - Market size and forecast 2025-2030

Chart on Turkey - Market size and forecast 2025-2030 ($ million)
Data Table on Turkey - Market size and forecast 2025-2030 ($ million)
Chart on Turkey - Year-over-year growth 2025-2030 (%)
Data Table on Turkey - Year-over-year growth 2025-2030 (%)

12.7 South America - Market size and forecast 2025-2030

Chart on South America - Market size and forecast 2025-2030 ($ million)
Data Table on South America - Market size and forecast 2025-2030 ($ million)
Chart on South America - Year-over-year growth 2025-2030 (%)
Data Table on South America - Year-over-year growth 2025-2030 (%)
Chart on Regional Comparison - South America
Data Table on Regional Comparison - South America

12.7.1 Brazil - Market size and forecast 2025-2030

Chart on Brazil - Market size and forecast 2025-2030 ($ million)
Data Table on Brazil - Market size and forecast 2025-2030 ($ million)
Chart on Brazil - Year-over-year growth 2025-2030 (%)
Data Table on Brazil - Year-over-year growth 2025-2030 (%)

12.7.2 Argentina - Market size and forecast 2025-2030

Chart on Argentina - Market size and forecast 2025-2030 ($ million)
Data Table on Argentina - Market size and forecast 2025-2030 ($ million)
Chart on Argentina - Year-over-year growth 2025-2030 (%)
Data Table on Argentina - Year-over-year growth 2025-2030 (%)

12.7.3 Chile - Market size and forecast 2025-2030

Chart on Chile - Market size and forecast 2025-2030 ($ million)
Data Table on Chile - Market size and forecast 2025-2030 ($ million)
Chart on Chile - Year-over-year growth 2025-2030 (%)
Data Table on Chile - Year-over-year growth 2025-2030 (%)

12.8 Market opportunity by geography

Market opportunity by geography ($ million)
Data Tables on Market opportunity by geography ($ million)

13. Drivers, Challenges, and Opportunity

13.1 Market drivers

Rapid expansion of last-mile delivery networks and commercial e-commerce logistics
Shift in consumer demographics and increasing demand for recreational mobility
Technological advancements in electric drivetrains and sustainability mandates

13.2 Market challenges

Highly fragmented regulatory frameworks and inconsistent vehicle classification standards
Severe battery swapping and charging infrastructure gaps in urban environments
Inherent geometrical stability limits and high cost barriers relative to target demographics

13.3 Impact of drivers and challenges

Impact of drivers and challenges in 2025 and 2030

13.4 Market opportunities

Accelerated shift toward fleet electrification and smart telematics integration
Proliferation of urban micro-hubs and specialized last-mile logistics infrastructure
Expansion of shared micro-mobility frameworks and inclusive vehicle layouts

14. Competitive Landscape

14.1 Overview

14.2

Overview on criticality of inputs and factors of differentiation

14.3 Landscape disruption

Overview on factors of disruption

14.4 Industry risks

Impact of key risks on business

15. Competitive Analysis

15.1 Companies profiled

Companies covered

15.2 Company ranking index

15.3 Market positioning of companies

Matrix on companies position and classification

15.4 Addmotor Tech

Addmotor Tech - Overview
Addmotor Tech - Product / Service
Addmotor Tech - Key offerings
SWOT

15.5 Adiva S.p.A.

Adiva S.p.A. - Overview
Adiva S.p.A. - Product / Service
Adiva S.p.A. - Key offerings
SWOT

15.6 Bombardier Recreational Inc.

Bombardier Recreational Inc. - Overview
Bombardier Recreational Inc. - Business segments
Bombardier Recreational Inc. - Key news
Bombardier Recreational Inc. - Key offerings
Bombardier Recreational Inc. - Segment focus
SWOT

15.7 Campagna Motors Inc.

Campagna Motors Inc. - Overview
Campagna Motors Inc. - Product / Service
Campagna Motors Inc. - Key offerings
SWOT

15.8 EVELO

EVELO - Overview
EVELO - Product / Service
EVELO - Key offerings
SWOT

15.9 Harley Davidson Inc.

Harley Davidson Inc. - Overview
Harley Davidson Inc. - Business segments
Harley Davidson Inc. - Key news
Harley Davidson Inc. - Key offerings
Harley Davidson Inc. - Segment focus
SWOT

15.10 Lectric eBikes

Lectric eBikes - Overview
Lectric eBikes - Product / Service
Lectric eBikes - Key offerings
SWOT

15.11 Morgan Motor Co. Ltd.

Morgan Motor Co. Ltd. - Overview
Morgan Motor Co. Ltd. - Product / Service
Morgan Motor Co. Ltd. - Key offerings
SWOT

15.12 Peugeot Motocycles

Peugeot Motocycles - Overview
Peugeot Motocycles - Product / Service
Peugeot Motocycles - Key offerings
SWOT

15.13 Piaggio and C. S.p.A.

Piaggio and C. S.p.A. - Overview
Piaggio and C. S.p.A. - Business segments
Piaggio and C. S.p.A. - Key offerings
Piaggio and C. S.p.A. - Segment focus
SWOT

15.14 Polaris Inc.

Polaris Inc. - Overview
Polaris Inc. - Business segments
Polaris Inc. - Key news
Polaris Inc. - Key offerings
Polaris Inc. - Segment focus
SWOT

15.15 sixthreezero

sixthreezero - Overview
sixthreezero - Product / Service
sixthreezero - Key offerings
SWOT

15.16 Van Raam Reha Bikes B.V.

Van Raam Reha Bikes B.V. - Overview
Van Raam Reha Bikes B.V. - Product / Service
Van Raam Reha Bikes B.V. - Key offerings
SWOT

15.17 Vanderhall Motor Works

Vanderhall Motor Works - Overview
Vanderhall Motor Works - Product / Service
Vanderhall Motor Works - Key offerings
SWOT

15.18 Yamaha Motor Co. Ltd.

Yamaha Motor Co. Ltd. - Overview
Yamaha Motor Co. Ltd. - Business segments
Yamaha Motor Co. Ltd. - Key news
Yamaha Motor Co. Ltd. - Key offerings
Yamaha Motor Co. Ltd. - Segment focus
SWOT

16. Appendix

16.1 Scope of the report

Market definition
Objectives
Notes and caveats

16.2 Inclusions and exclusions checklist

Inclusions checklist
Exclusions checklist

16.3 Currency conversion rates for US$

16.4 Research methodology

16.5 Data procurement

Information sources

16.6 Data validation

16.7 Validation techniques employed for market sizing

16.8 Data synthesis

16.9 360 degree market analysis

16.10 List of abbreviations

Research Methodology

Technavio presents a detailed picture of the market by way of study, synthesis, and summation of data from multiple sources. The analysts have presented the various facets of the market with a particular focus on identifying the key industry influencers. The data thus presented is comprehensive, reliable, and the result of extensive research, both primary and secondary.

INFORMATION SOURCES

Primary sources

  • Manufacturers and suppliers
  • Channel partners
  • Industry experts
  • Strategic decision makers

Secondary sources

  • Industry journals and periodicals
  • Government data
  • Financial reports of key industry players
  • Historical data
  • Press releases

DATA ANALYSIS

Data Synthesis

  • Collation of data
  • Estimation of key figures
  • Analysis of derived insights

Data Validation

  • Triangulation with data models
  • Reference against proprietary databases
  • Corroboration with industry experts

REPORT WRITING

Qualitative

  • Market drivers
  • Market challenges
  • Market trends
  • Five forces analysis

Quantitative

  • Market size and forecast
  • Market segmentation
  • Geographical insights
  • Competitive landscape

Interested in this report?

Get your sample now to see our research methodology and insights!

Download Now

Frequently Asked Questions

Trike market growth will increase by USD 2386.6 million during 2026-2030.

The Trike market is expected to grow at a CAGR of 7.5% during 2026-2030.

Trike market is segmented by Product (Reverse trike, Delta trike) Retail channel (OEMs, Aftermarket, Custom builders) Propulsion (IC engine, Electric)

Addmotor Tech, Adiva S.p.A., Bombardier Recreational Inc., Campagna Motors Inc., ElectraMeccanica Vehicles Corp., ETNNIC, EVELO, Harley Davidson Inc., ICE Trikes, Lectric eBikes, Mooncool, Morgan Motor Co. Ltd., Peugeot Motocycles, Piaggio and C. S.p.A., Polaris Inc., Rewaco Fahrzeugbau GmbH, sixthreezero, TWIKE GmbH, Van Raam Reha Bikes B.V., Vanderhall Motor Works, Yamaha Motor Co. Ltd. are a few of the key vendors in the Trike market.

North America will register the highest growth rate of 66.7% among the other regions. Therefore, the Trike market in North America is expected to garner significant business opportunities for the vendors during the forecast period.

US, Canada, Mexico, Germany, UK, France, Italy, Spain, The Netherlands, China, Japan, India, South Korea, Australia, Indonesia, Saudi Arabia, UAE, South Africa, Israel, Turkey, Brazil, Argentina, Chile

  • Rapid expansion of last-mile delivery networks and commercial e-commerce logistics is the driving factor this market.

The Trike market vendors should focus on grabbing business opportunities from the Product segment as it accounted for the largest market share in the base year.
RIA - Research AI Assistant
Ask RIA
