Unified Endpoint Management (UEM) Market Analysis, Size, and Forecast 2026-2030: North America (US, Canada, and Mexico), Europe (Germany, France, and UK), APAC (China, Japan, and India), South America (Brazil and Argentina), Middle East and Africa (UAE, Saudi Arabia, and South Africa), and Rest of World (ROW)

Unified Endpoint Management (UEM) Market Analysis, Size, and Forecast 2026-2030:
North America (US, Canada, and Mexico), Europe (Germany, France, and UK), APAC (China, Japan, and India), South America (Brazil and Argentina), Middle East and Africa (UAE, Saudi Arabia, and South Africa), and Rest of World (ROW)

Published: May 2026 296 Pages SKU: IRTNTR40250

Market Overview at a Glance

$11.37 B
Market Opportunity
10.4%
CAGR 2025 - 2030
35.1%
North America Growth
$7.80 B
Solutions segment 2024

Unified Endpoint Management (UEM) Market Size 2026-2030

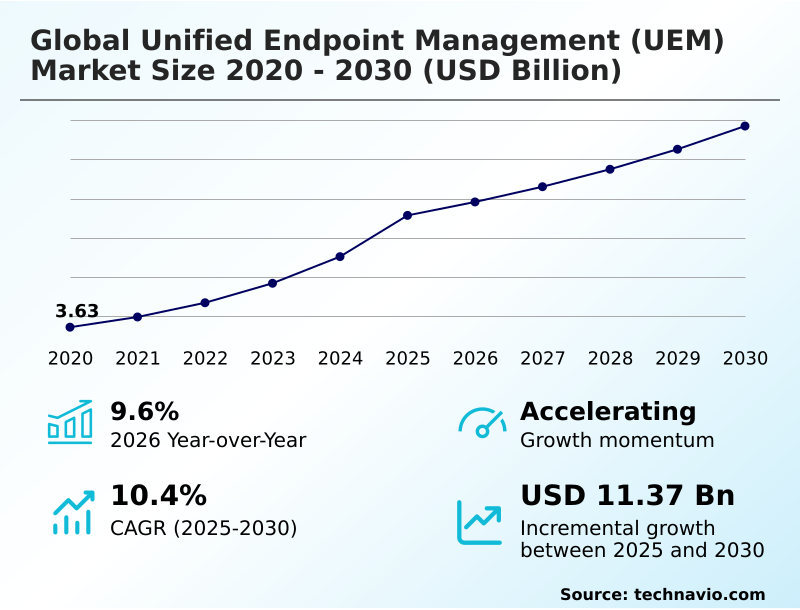
The unified endpoint management (uem) market size is valued to increase by USD 11.37 billion, at a CAGR of 10.4% from 2025 to 2030. Institutionalization of AI and automated self-healing endpoints will drive the unified endpoint management (uem) market.

Major Market Trends & Insights

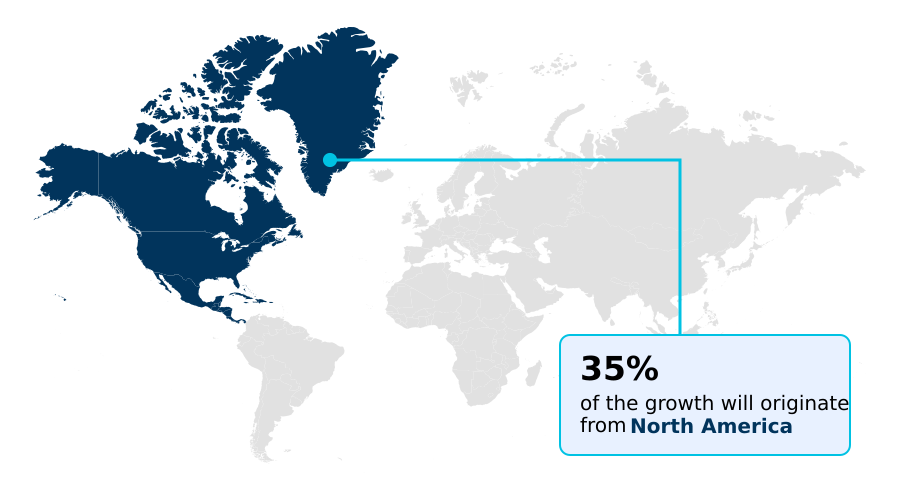
  • North America dominated the market and accounted for a 35.1% growth during the forecast period.
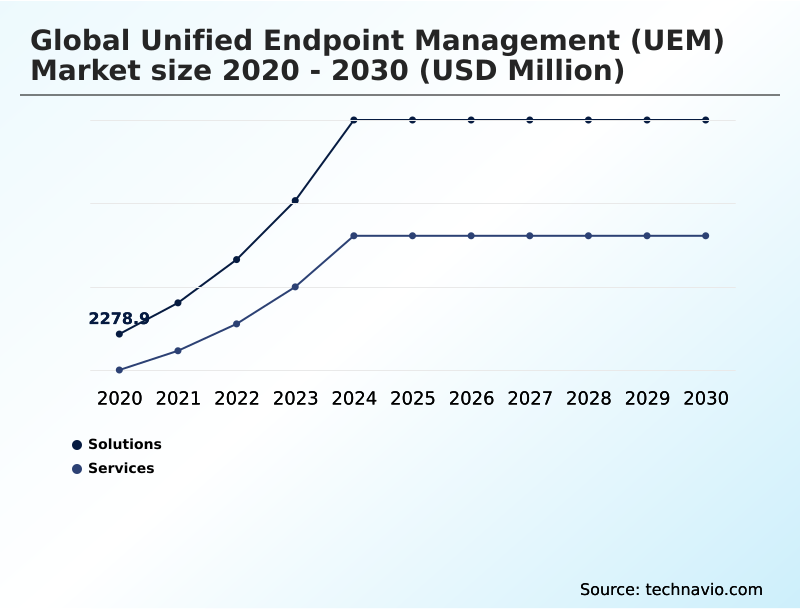
  • By Component - Solutions segment was valued at USD 7.80 billion in 2024
  • By Deployment - Cloud segment accounted for the largest market revenue share in 2024

Market Size & Forecast

  • Market Opportunities: USD 25.59 billion
  • Market Future Opportunities: USD 11.37 billion
  • CAGR from 2025 to 2030 : 10.4%

Market Summary

  • The unified endpoint management (UEM) market is defined by a convergence of security and operational efficiency, driven by the complexities of the modern digital workplace. This technology provides a consolidated approach to overseeing all enterprise devices, from traditional laptops to an expanding array of IoT endpoints.
  • Core market drivers include the push for zero-trust security frameworks and the institutionalization of AI to facilitate automated, self-healing capabilities. A primary trend is the evolution toward unified orchestration of non-traditional endpoints, such as XR devices used in specialized training. For instance, a global logistics firm must manage a diverse fleet of ruggedized handhelds, in-vehicle computers, and back-office workstations.
  • A UEM platform allows the firm to apply a single, consistent security policy, deploy software updates, and remotely troubleshoot devices worldwide, ensuring supply chain integrity and operational continuity.
  • However, challenges such as the technical complexity of migrating legacy systems and navigating fragmented data sovereignty regulations require strategic planning and significant investment from enterprises aiming to achieve a truly unified and secure endpoint ecosystem.

What will be the Size of the Unified Endpoint Management (UEM) Market during the forecast period?

Get Key Insights on Market Forecast (PDF) Request Free Sample

How is the Unified Endpoint Management (UEM) Market Segmented?

The unified endpoint management (uem) industry research report provides comprehensive data (region-wise segment analysis), with forecasts and estimates in "USD million" for the period 2026-2030, as well as historical data from 2020-2024 for the following segments.

  • Component
    • Solutions
    • Services
  • Deployment
    • Cloud
    • On-premises
    • Hybrid
  • End-user
    • Large enterprises
    • SMEs
  • Geography
    • North America
      • US
      • Canada
      • Mexico
    • Europe
      • Germany
      • France
      • UK
    • APAC
      • China
      • Japan
      • India
    • South America
      • Brazil
      • Argentina
    • Middle East and Africa
      • UAE
      • Saudi Arabia
      • South Africa
    • Rest of World (ROW)

By Component Insights

The solutions segment is estimated to witness significant growth during the forecast period.

The solutions segment is the technological core of the unified endpoint management market, providing frameworks for securing and overseeing diverse hardware assets.

These platforms deliver zero-touch provisioning and employ intelligent policy enforcement to automate application deployment and enforce rigorous security configurations. The integration of user and entity behavior analytics is crucial for modern risk assessment.

By consolidating disparate management silos, organizations can reduce administrative complexity, with some reporting a 40% reduction in critical security vulnerabilities through automated patch management and proactive vulnerability remediation.

This approach to endpoint configuration management supports a secure and efficient digital environment, using AI and automated self-healing to manage corporate-owned personal-enabled devices and ensure robust data loss prevention.

Request Free Sample

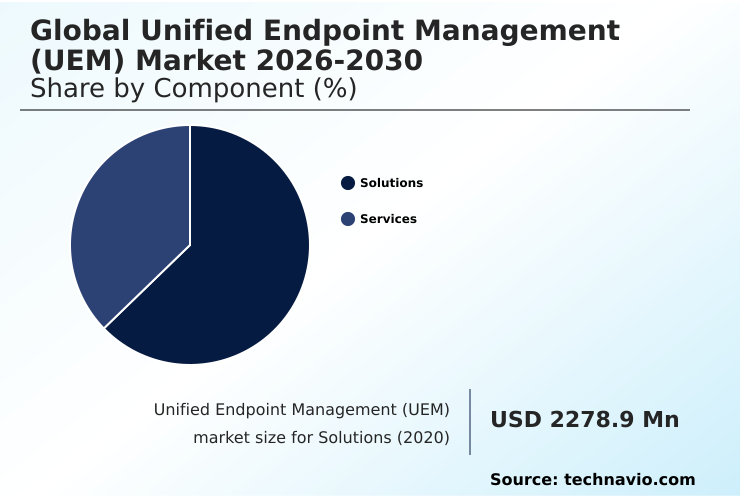
The Solutions segment was valued at USD 7.80 billion in 2024 and showed a gradual increase during the forecast period.

Request Free Sample

Regional Analysis

North America is estimated to contribute 35.1% to the growth of the global market during the forecast period.Technavio’s analysts have elaborately explained the regional trends and drivers that shape the market during the forecast period.

See How Unified Endpoint Management (UEM) Market Demand is Rising in North America Request Free Sample

Geographic dynamics in the unified endpoint management market are distinct, with North America leading innovation and accounting for over 35% of the market's incremental growth.

This region's maturity in cloud-first management strategies drives demand for platforms with predictive analytics for device health.

In Europe, a focus on data sovereignty compliance and localized data storage solutions is paramount, with firms reporting a 20% improvement in audit pass rates after adopting compliant UEM policies.

The APAC region is the fastest-growing, fueled by mobile-first economies that demand scalable mobile application management and containerization technologies.

Across all regions, the push for a single pane of glass management and orchestration-led discipline is universal, as organizations seek to standardize security and operations.

Market Dynamics

Our researchers analyzed the data with 2025 as the base year, along with the key drivers, trends, and challenges. A holistic analysis of drivers will help companies refine their marketing strategies to gain a competitive advantage.

  • Achieving unified endpoint management cost optimization is a primary goal for modern enterprises. This involves a strategic approach to UEM for industrial internet of things and ensuring zero trust security for mobile devices, which are now critical assets.
  • The role of AI in unified endpoint management is expanding, directly impacting the UEM and digital employee experience DEX by enabling proactive support. Effectively managing BYOD policies with UEM is essential, and many organizations are realizing cloud-native UEM platform benefits such as scalability and accessibility.
  • Specific sectors have unique needs, leading to the development of UEM solutions for healthcare compliance and the financial services sector. Key technical components include automated patch management in UEM and deep UEM integration with identity providers. Functionally, this extends to remote device management for logistics and the emerging need for securing XR devices with UEM.
  • Navigating UEM data sovereignty compliance features is a major challenge for global firms. Many are in the process of migrating from MDM to UEM to handle UEM for ruggedized device environments. Security is enhanced through passwordless authentication for UEM access, while UEM threat detection and response capabilities are crucial.
  • Ultimately, improving IT efficiency with UEM is achieved through endpoint analytics for performance monitoring and true cross-platform management with a UEM.

What are the key market drivers leading to the rise in the adoption of Unified Endpoint Management (UEM) Industry?

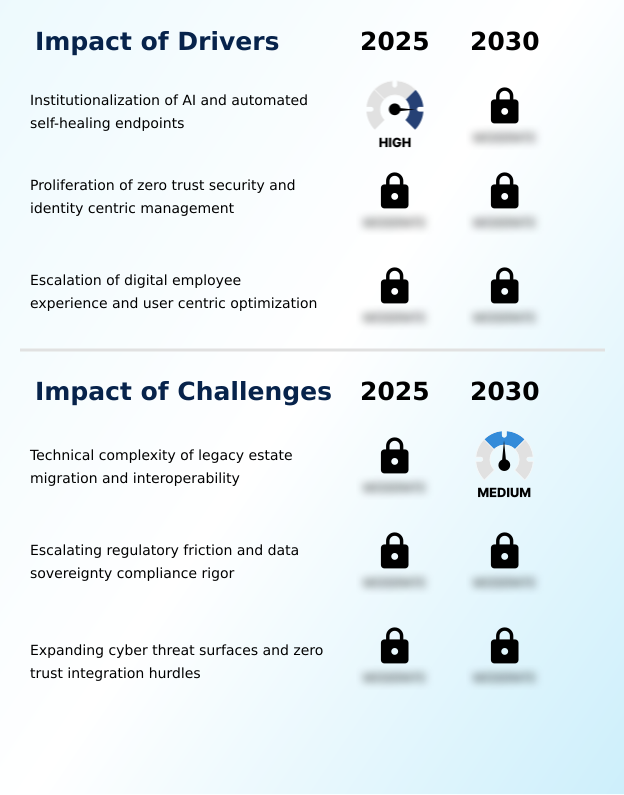
  • A key market driver is the institutionalization of AI to enable automated, self-healing capabilities for endpoints, enhancing system resilience and security.

  • Market growth is significantly propelled by the institutionalization of AI and automated self-healing, which facilitates proactive software-driven maintenance and user-centric optimization. The proliferation of zero-trust security frameworks is another major driver, making identity-centric management a cornerstone of modern IT.
  • This has led to an increased focus on the digital employee experience, with platforms using system performance telemetry and non-intrusive background updates to enhance productivity. Organizations implementing these identity-aware frameworks report a reduction in credential-based breaches by over 60%.
  • The convergence of management and security into a singular, orchestration-led discipline allows for the consolidation of security agents, reducing system latency and simplifying the overall software stack.

What are the market trends shaping the Unified Endpoint Management (UEM) Industry?

  • A key trend shaping the market is the industrialization of zero-trust architecture integration. This involves a fundamental shift from perimeter-based security to a model of continuous verification for every user and device.

  • Key market trends are centered on the industrialization of security and management, leading to the deep integration of zero trust architecture integration. This shift away from traditional perimeters is driving demand for solutions with hardware-root-of-trust validation and real-time policy enforcement engine capabilities.
  • The evolution toward unified IoT and XR device orchestration is expanding the scope of management to include non-traditional endpoints used for specialized tasks like spatial engineering device management. This comprehensive device visibility is becoming a standard, with platforms that can deploy modular application containers to diverse hardware.
  • The adoption of AI-driven spectrum analysis within these platforms has been shown to reduce critical security vulnerabilities by nearly 40% while enhancing the identity-centric security posture.

What challenges does the Unified Endpoint Management (UEM) Industry face during its growth?

  • A significant challenge impacting market growth is the technical complexity associated with migrating legacy IT estates and ensuring interoperability across heterogeneous device environments.

  • The market faces significant hurdles, primarily the technical complexity of legacy estate migration and achieving interoperability across heterogeneous device environments. This requires extensive use of application programming interfaces and often results in prolonged deployment timelines, with migration projects exceeding budgets by an average of 20%.
  • Another challenge is escalating regulatory friction, demanding stringent data sovereignty compliance and localized data storage solutions, which adds an estimated 15% to compliance overhead. The expanding cyber-threat surface, exacerbated by bring-your-own-device practices, makes achieving full zero trust integration difficult. This requires a move toward more resilient security frameworks and away from legacy on-premises client management tools.

Exclusive Technavio Analysis on Customer Landscape

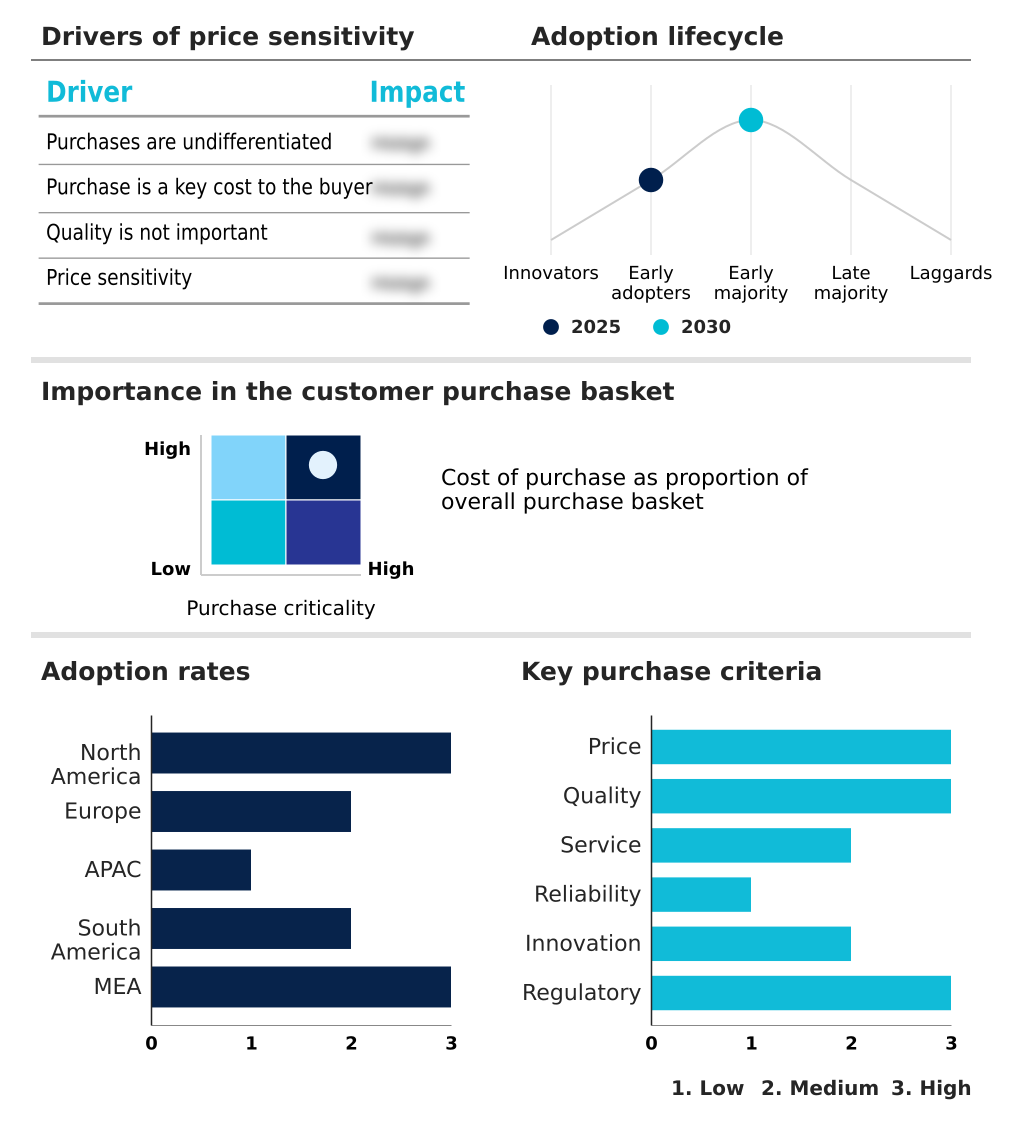
The unified endpoint management (uem) market forecasting report includes the adoption lifecycle of the market, covering from the innovator’s stage to the laggard’s stage. It focuses on adoption rates in different regions based on penetration. Furthermore, the unified endpoint management (uem) market report also includes key purchase criteria and drivers of price sensitivity to help companies evaluate and develop their market growth analysis strategies.

Customer Landscape of Unified Endpoint Management (UEM) Industry

Competitive Landscape

Companies are implementing various strategies, such as strategic alliances, unified endpoint management (uem) market forecast, partnerships, mergers and acquisitions, geographical expansion, and product/service launches, to enhance their presence in the industry.

42Gears Mobility Systems Ltd. - Key offerings focus on resilient cybersecurity for devices, data, and access controls, providing a foundation for secure, unified endpoint management.

The industry research and growth report includes detailed analyses of the competitive landscape of the market and information about key companies, including:

  • 42Gears Mobility Systems Ltd.
  • Absolute Software Corp.
  • Atera Networks Ltd.
  • BlackBerry Ltd.
  • Citrix Systems Inc.
  • IBM Corp.
  • Ivanti Software Inc.
  • JAMF Holding Corp.
  • JumpCloud Inc.
  • Matrix42 GmbH
  • Microsoft Corp.
  • Miradore Oy
  • Mitsogo Inc.
  • N able Inc.
  • NinjaOne
  • Open Text Corp.
  • Sand Studio
  • Sophos Group Ltd.
  • Tanium Inc.
  • Zoho Corp. Pvt. Ltd.

Qualitative and quantitative analysis of companies has been conducted to help clients understand the wider business environment as well as the strengths and weaknesses of key industry players. Data is qualitatively analyzed to categorize companies as pure play, category-focused, industry-focused, and diversified; it is quantitatively analyzed to categorize companies as dominant, leading, strong, tentative, and weak.

Recent Development and News in Unified endpoint management (uem) market

  • In October 2024, 42Gears Mobility Systems Ltd. and SATO Holdings Corp. announced a strategic partnership to provide centralized, remote management for industrial and mobile printers, enhancing their offerings for the logistics and retail sectors.
  • In November 2024, Sophos Group Ltd. published a threat report detailing a 40% year-over-year increase in ransomware attacks targeting unmanaged devices, reinforcing the need for unified security policies and integrated threat defense.
  • In March 2025, Microsoft Corp. announced a major update to its Intune UEM platform, integrating advanced AI-driven predictive analytics to proactively identify device health issues and security vulnerabilities before they impact users.
  • In April 2025, Ivanti Software Inc. acquired a startup specializing in AI for IT operations (AIOps), aiming to integrate autonomous self-healing capabilities into its Neurons for UEM platform to reduce manual intervention.

Dive into Technavio’s robust research methodology, blending expert interviews, extensive data synthesis, and validated models for unparalleled Unified Endpoint Management (UEM) Market insights. See full methodology.

Market Scope
Page number 296
Base year 2025
Historic period 2020-2024
Forecast period 2026-2030
Growth momentum & CAGR Accelerate at a CAGR of 10.4%
Market growth 2026-2030 USD 11365.0 million
Market structure Fragmented
YoY growth 2025-2026(%) 9.6%
Key countries US, Canada, Mexico, Germany, France, UK, Italy, Russia, The Netherlands, China, Japan, India, South Korea, Australia, Indonesia, Brazil, Argentina, Chile, UAE, Saudi Arabia, South Africa, Israel and Egypt
Competitive landscape Leading Companies, Market Positioning of Companies, Competitive Strategies, and Industry Risks

Request Free Sample

Research Analyst Overview

  • The unified endpoint management (UEM) market is undergoing a structural evolution, driven by the convergence of security and IT operations into a framework of autonomous IT operations. The integration of zero-trust security frameworks is no longer an option but a baseline requirement, compelling boardroom decisions on security investment. This shift demands identity-centric management and continuous authentication across all endpoints.
  • Advanced platforms now leverage AI-enabled predictive remediation and AI-driven spectrum analysis to preemptively address issues, a transition from reactive to proactive endpoint resilience. The focus on digital employee experience has led to user-centric optimization tools that use system performance telemetry for real-time device posture checks.
  • Adopting these advanced systems has enabled organizations to automate up to 70% of their routine remediation tasks. This includes automated patch management and vulnerability remediation. Platforms are incorporating everything from passwordless authentication and remote wipe capabilities to endpoint privilege management and mobile threat defense.
  • The challenge remains in achieving seamless context-aware orchestration and cross-platform policy enforcement across heterogeneous device environments, especially with bring-your-own-device practices and the need for zero-touch provisioning and agentless management capabilities for IoT and XR device orchestration.

What are the Key Data Covered in this Unified Endpoint Management (UEM) Market Research and Growth Report?

  • What is the expected growth of the Unified Endpoint Management (UEM) Market between 2026 and 2030?

    • USD 11.37 billion, at a CAGR of 10.4%

  • What segmentation does the market report cover?

    • The report is segmented by Component (Solutions, and Services), Deployment (Cloud, On-premises, and Hybrid), End-user (Large enterprises, and SMEs) and Geography (North America, Europe, APAC, South America, Middle East and Africa)

  • Which regions are analyzed in the report?

    • North America, Europe, APAC, South America and Middle East and Africa

  • What are the key growth drivers and market challenges?

    • Institutionalization of AI and automated self-healing endpoints, Technical complexity of legacy estate migration and interoperability

  • Who are the major players in the Unified Endpoint Management (UEM) Market?

    • 42Gears Mobility Systems Ltd., Absolute Software Corp., Atera Networks Ltd., BlackBerry Ltd., Citrix Systems Inc., IBM Corp., Ivanti Software Inc., JAMF Holding Corp., JumpCloud Inc., Matrix42 GmbH, Microsoft Corp., Miradore Oy, Mitsogo Inc., N able Inc., NinjaOne, Open Text Corp., Sand Studio, Sophos Group Ltd., Tanium Inc. and Zoho Corp. Pvt. Ltd.

Market Research Insights

  • The market's dynamic is shaped by a strategic shift towards a single pane of glass management, enabling orchestration-led discipline through zero trust architecture integration. This is driven by AI and automated self-healing, utilizing predictive analytics for device health and proactive software-driven maintenance.
  • Technologies such as containerization technologies and over-the-air provisioning are essential for mobile application management and supporting corporate-owned personal-enabled devices. The goal is an identity-centric security posture, enforced by a real-time policy enforcement engine that leverages intelligent policy enforcement and user and entity behavior analytics.
  • Firms are adopting cloud-first management strategies to handle the expanding cyber-threat surface and implement resilient security frameworks. This approach requires autonomous self-healing capabilities and seamless security operations center integration, moving beyond on-premises client management tools to achieve robust device lifecycle management and effective vulnerability remediation, even for rugged and spatial engineering device management.

We can help! Our analysts can customize this unified endpoint management (uem) market research report to meet your requirements.

Get in touch

1. Executive Summary

1.1 Market overview

Executive Summary - Chart on Market Overview
Executive Summary - Data Table on Market Overview
Executive Summary - Chart on Global Market Characteristics
Executive Summary - Chart on Market by Geography
Executive Summary - Chart on Market Segmentation by Component
Executive Summary - Chart on Market Segmentation by Deployment
Executive Summary - Chart on Market Segmentation by End-user
Executive Summary - Chart on Incremental Growth
Executive Summary - Data Table on Incremental Growth
Executive Summary - Chart on Company Market Positioning

2. Technavio Analysis

2.1 Analysis of price sensitivity, lifecycle, customer purchase basket, adoption rates, and purchase criteria

2.2 Criticality of inputs and Factors of differentiation

Chart on Overview on criticality of inputs and factors of differentiation

2.3 Factors of disruption

Chart on Overview on factors of disruption

2.4 Impact of drivers and challenges

Chart on Impact of drivers and challenges in 2025 and 2030

3. Market Landscape

3.1 Market ecosystem

Chart on Parent Market
Data Table on - Parent Market

3.2 Market characteristics

Chart on Market characteristics analysis

3.3 Value chain analysis

Chart on Value chain analysis

4. Market Sizing

4.1 Market definition

Data Table on Offerings of companies included in the market definition

4.2 Market segment analysis

Market segments

4.3 Market size 2025

4.4 Market outlook: Forecast for 2025-2030

Chart on Global - Market size and forecast 2025-2030 ($ million)
Data Table on Global - Market size and forecast 2025-2030 ($ million)
Chart on Global Market: Year-over-year growth 2025-2030 (%)
Data Table on Global Market: Year-over-year growth 2025-2030 (%)

5. Historic Market Size

5.1 Global Unified Endpoint Management (UEM) Market 2020 - 2024

Historic Market Size - Data Table on Global Unified Endpoint Management (UEM) Market 2020 - 2024 ($ million)

5.2 Component segment analysis 2020 - 2024

Historic Market Size - Component Segment 2020 - 2024 ($ million)

5.3 Deployment segment analysis 2020 - 2024

Historic Market Size - Deployment Segment 2020 - 2024 ($ million)

5.4 End-user segment analysis 2020 - 2024

Historic Market Size - End-user Segment 2020 - 2024 ($ million)

5.5 Geography segment analysis 2020 - 2024

Historic Market Size - Geography Segment 2020 - 2024 ($ million)

5.6 Country segment analysis 2020 - 2024

Historic Market Size - Country Segment 2020 - 2024 ($ million)

6. Qualitative Analysis

6.1 Impact of AI in global unified endpoint management (UEM) market

6.2 Impact of geopolitical conflict on global unified endpoint management (UEM) market

7. Five Forces Analysis

7.1 Five forces summary

Five forces analysis - Comparison between 2025 and 2030

7.2 Bargaining power of buyers

Bargaining power of buyers - Impact of key factors 2025 and 2030

7.3 Bargaining power of suppliers

Bargaining power of suppliers - Impact of key factors in 2025 and 2030

7.4 Threat of new entrants

Threat of new entrants - Impact of key factors in 2025 and 2030

7.5 Threat of substitutes

Threat of substitutes - Impact of key factors in 2025 and 2030

7.6 Threat of rivalry

Threat of rivalry - Impact of key factors in 2025 and 2030

7.7 Market condition

Chart on Market condition - Five forces 2025 and 2030

8. Market Segmentation by Component

8.1 Market segments

Chart on Component - Market share 2025-2030 (%)
Data Table on Component - Market share 2025-2030 (%)

8.2 Comparison by Component

Chart on Comparison by Component
Data Table on Comparison by Component

8.3 Solutions - Market size and forecast 2025-2030

Chart on Solutions - Market size and forecast 2025-2030 ($ million)
Data Table on Solutions - Market size and forecast 2025-2030 ($ million)
Chart on Solutions - Year-over-year growth 2025-2030 (%)
Data Table on Solutions - Year-over-year growth 2025-2030 (%)

8.4 Services - Market size and forecast 2025-2030

Chart on Services - Market size and forecast 2025-2030 ($ million)
Data Table on Services - Market size and forecast 2025-2030 ($ million)
Chart on Services - Year-over-year growth 2025-2030 (%)
Data Table on Services - Year-over-year growth 2025-2030 (%)

8.5 Market opportunity by Component

Market opportunity by Component ($ million)
Data Table on Market opportunity by Component ($ million)

9. Market Segmentation by Deployment

9.1 Market segments

Chart on Deployment - Market share 2025-2030 (%)
Data Table on Deployment - Market share 2025-2030 (%)

9.2 Comparison by Deployment

Chart on Comparison by Deployment
Data Table on Comparison by Deployment

9.3 Cloud - Market size and forecast 2025-2030

Chart on Cloud - Market size and forecast 2025-2030 ($ million)
Data Table on Cloud - Market size and forecast 2025-2030 ($ million)
Chart on Cloud - Year-over-year growth 2025-2030 (%)
Data Table on Cloud - Year-over-year growth 2025-2030 (%)

9.4 On-premises - Market size and forecast 2025-2030

Chart on On-premises - Market size and forecast 2025-2030 ($ million)
Data Table on On-premises - Market size and forecast 2025-2030 ($ million)
Chart on On-premises - Year-over-year growth 2025-2030 (%)
Data Table on On-premises - Year-over-year growth 2025-2030 (%)

9.5 Hybrid - Market size and forecast 2025-2030

Chart on Hybrid - Market size and forecast 2025-2030 ($ million)
Data Table on Hybrid - Market size and forecast 2025-2030 ($ million)
Chart on Hybrid - Year-over-year growth 2025-2030 (%)
Data Table on Hybrid - Year-over-year growth 2025-2030 (%)

9.6 Market opportunity by Deployment

Market opportunity by Deployment ($ million)
Data Table on Market opportunity by Deployment ($ million)

10. Market Segmentation by End-user

10.1 Market segments

Chart on End-user - Market share 2025-2030 (%)
Data Table on End-user - Market share 2025-2030 (%)

10.2 Comparison by End-user

Chart on Comparison by End-user
Data Table on Comparison by End-user

10.3 Large enterprises - Market size and forecast 2025-2030

Chart on Large enterprises - Market size and forecast 2025-2030 ($ million)
Data Table on Large enterprises - Market size and forecast 2025-2030 ($ million)
Chart on Large enterprises - Year-over-year growth 2025-2030 (%)
Data Table on Large enterprises - Year-over-year growth 2025-2030 (%)

10.4 SMEs - Market size and forecast 2025-2030

Chart on SMEs - Market size and forecast 2025-2030 ($ million)
Data Table on SMEs - Market size and forecast 2025-2030 ($ million)
Chart on SMEs - Year-over-year growth 2025-2030 (%)
Data Table on SMEs - Year-over-year growth 2025-2030 (%)

10.5 Market opportunity by End-user

Market opportunity by End-user ($ million)
Data Table on Market opportunity by End-user ($ million)

11. Customer Landscape

11.1 Customer landscape overview

Analysis of price sensitivity, lifecycle, customer purchase basket, adoption rates, and purchase criteria

12. Geographic Landscape

12.1 Geographic segmentation

Chart on Market share by geography 2025-2030 (%)
Data Table on Market share by geography 2025-2030 (%)

12.2 Geographic comparison

Chart on Geographic comparison
Data Table on Geographic comparison

12.3 North America - Market size and forecast 2025-2030

Chart on North America - Market size and forecast 2025-2030 ($ million)
Data Table on North America - Market size and forecast 2025-2030 ($ million)
Chart on North America - Year-over-year growth 2025-2030 (%)
Data Table on North America - Year-over-year growth 2025-2030 (%)
Chart on Regional Comparison - North America
Data Table on Regional Comparison - North America

12.3.1 US - Market size and forecast 2025-2030

Chart on US - Market size and forecast 2025-2030 ($ million)
Data Table on US - Market size and forecast 2025-2030 ($ million)
Chart on US - Year-over-year growth 2025-2030 (%)
Data Table on US - Year-over-year growth 2025-2030 (%)

12.3.2 Canada - Market size and forecast 2025-2030

Chart on Canada - Market size and forecast 2025-2030 ($ million)
Data Table on Canada - Market size and forecast 2025-2030 ($ million)
Chart on Canada - Year-over-year growth 2025-2030 (%)
Data Table on Canada - Year-over-year growth 2025-2030 (%)

12.3.3 Mexico - Market size and forecast 2025-2030

Chart on Mexico - Market size and forecast 2025-2030 ($ million)
Data Table on Mexico - Market size and forecast 2025-2030 ($ million)
Chart on Mexico - Year-over-year growth 2025-2030 (%)
Data Table on Mexico - Year-over-year growth 2025-2030 (%)

12.4 Europe - Market size and forecast 2025-2030

Chart on Europe - Market size and forecast 2025-2030 ($ million)
Data Table on Europe - Market size and forecast 2025-2030 ($ million)
Chart on Europe - Year-over-year growth 2025-2030 (%)
Data Table on Europe - Year-over-year growth 2025-2030 (%)
Chart on Regional Comparison - Europe
Data Table on Regional Comparison - Europe

12.4.1 Germany - Market size and forecast 2025-2030

Chart on Germany - Market size and forecast 2025-2030 ($ million)
Data Table on Germany - Market size and forecast 2025-2030 ($ million)
Chart on Germany - Year-over-year growth 2025-2030 (%)
Data Table on Germany - Year-over-year growth 2025-2030 (%)

12.4.2 France - Market size and forecast 2025-2030

Chart on France - Market size and forecast 2025-2030 ($ million)
Data Table on France - Market size and forecast 2025-2030 ($ million)
Chart on France - Year-over-year growth 2025-2030 (%)
Data Table on France - Year-over-year growth 2025-2030 (%)

12.4.3 UK - Market size and forecast 2025-2030

Chart on UK - Market size and forecast 2025-2030 ($ million)
Data Table on UK - Market size and forecast 2025-2030 ($ million)
Chart on UK - Year-over-year growth 2025-2030 (%)
Data Table on UK - Year-over-year growth 2025-2030 (%)

12.4.4 Italy - Market size and forecast 2025-2030

Chart on Italy - Market size and forecast 2025-2030 ($ million)
Data Table on Italy - Market size and forecast 2025-2030 ($ million)
Chart on Italy - Year-over-year growth 2025-2030 (%)
Data Table on Italy - Year-over-year growth 2025-2030 (%)

12.4.5 Russia - Market size and forecast 2025-2030

Chart on Russia - Market size and forecast 2025-2030 ($ million)
Data Table on Russia - Market size and forecast 2025-2030 ($ million)
Chart on Russia - Year-over-year growth 2025-2030 (%)
Data Table on Russia - Year-over-year growth 2025-2030 (%)

12.4.6 The Netherlands - Market size and forecast 2025-2030

Chart on The Netherlands - Market size and forecast 2025-2030 ($ million)
Data Table on The Netherlands - Market size and forecast 2025-2030 ($ million)
Chart on The Netherlands - Year-over-year growth 2025-2030 (%)
Data Table on The Netherlands - Year-over-year growth 2025-2030 (%)

12.5 APAC - Market size and forecast 2025-2030

Chart on APAC - Market size and forecast 2025-2030 ($ million)
Data Table on APAC - Market size and forecast 2025-2030 ($ million)
Chart on APAC - Year-over-year growth 2025-2030 (%)
Data Table on APAC - Year-over-year growth 2025-2030 (%)
Chart on Regional Comparison - APAC
Data Table on Regional Comparison - APAC

12.5.1 China - Market size and forecast 2025-2030

Chart on China - Market size and forecast 2025-2030 ($ million)
Data Table on China - Market size and forecast 2025-2030 ($ million)
Chart on China - Year-over-year growth 2025-2030 (%)
Data Table on China - Year-over-year growth 2025-2030 (%)

12.5.2 Japan - Market size and forecast 2025-2030

Chart on Japan - Market size and forecast 2025-2030 ($ million)
Data Table on Japan - Market size and forecast 2025-2030 ($ million)
Chart on Japan - Year-over-year growth 2025-2030 (%)
Data Table on Japan - Year-over-year growth 2025-2030 (%)

12.5.3 India - Market size and forecast 2025-2030

Chart on India - Market size and forecast 2025-2030 ($ million)
Data Table on India - Market size and forecast 2025-2030 ($ million)
Chart on India - Year-over-year growth 2025-2030 (%)
Data Table on India - Year-over-year growth 2025-2030 (%)

12.5.4 South Korea - Market size and forecast 2025-2030

Chart on South Korea - Market size and forecast 2025-2030 ($ million)
Data Table on South Korea - Market size and forecast 2025-2030 ($ million)
Chart on South Korea - Year-over-year growth 2025-2030 (%)
Data Table on South Korea - Year-over-year growth 2025-2030 (%)

12.5.5 Australia - Market size and forecast 2025-2030

Chart on Australia - Market size and forecast 2025-2030 ($ million)
Data Table on Australia - Market size and forecast 2025-2030 ($ million)
Chart on Australia - Year-over-year growth 2025-2030 (%)
Data Table on Australia - Year-over-year growth 2025-2030 (%)

12.5.6 Indonesia - Market size and forecast 2025-2030

Chart on Indonesia - Market size and forecast 2025-2030 ($ million)
Data Table on Indonesia - Market size and forecast 2025-2030 ($ million)
Chart on Indonesia - Year-over-year growth 2025-2030 (%)
Data Table on Indonesia - Year-over-year growth 2025-2030 (%)

12.6 South America - Market size and forecast 2025-2030

Chart on South America - Market size and forecast 2025-2030 ($ million)
Data Table on South America - Market size and forecast 2025-2030 ($ million)
Chart on South America - Year-over-year growth 2025-2030 (%)
Data Table on South America - Year-over-year growth 2025-2030 (%)
Chart on Regional Comparison - South America
Data Table on Regional Comparison - South America

12.6.1 Brazil - Market size and forecast 2025-2030

Chart on Brazil - Market size and forecast 2025-2030 ($ million)
Data Table on Brazil - Market size and forecast 2025-2030 ($ million)
Chart on Brazil - Year-over-year growth 2025-2030 (%)
Data Table on Brazil - Year-over-year growth 2025-2030 (%)

12.6.2 Argentina - Market size and forecast 2025-2030

Chart on Argentina - Market size and forecast 2025-2030 ($ million)
Data Table on Argentina - Market size and forecast 2025-2030 ($ million)
Chart on Argentina - Year-over-year growth 2025-2030 (%)
Data Table on Argentina - Year-over-year growth 2025-2030 (%)

12.6.3 Chile - Market size and forecast 2025-2030

Chart on Chile - Market size and forecast 2025-2030 ($ million)
Data Table on Chile - Market size and forecast 2025-2030 ($ million)
Chart on Chile - Year-over-year growth 2025-2030 (%)
Data Table on Chile - Year-over-year growth 2025-2030 (%)

12.7 Middle East and Africa - Market size and forecast 2025-2030

Chart on Middle East and Africa - Market size and forecast 2025-2030 ($ million)
Data Table on Middle East and Africa - Market size and forecast 2025-2030 ($ million)
Chart on Middle East and Africa - Year-over-year growth 2025-2030 (%)
Data Table on Middle East and Africa - Year-over-year growth 2025-2030 (%)
Chart on Regional Comparison - Middle East and Africa
Data Table on Regional Comparison - Middle East and Africa

12.7.1 UAE - Market size and forecast 2025-2030

Chart on UAE - Market size and forecast 2025-2030 ($ million)
Data Table on UAE - Market size and forecast 2025-2030 ($ million)
Chart on UAE - Year-over-year growth 2025-2030 (%)
Data Table on UAE - Year-over-year growth 2025-2030 (%)

12.7.2 Saudi Arabia - Market size and forecast 2025-2030

Chart on Saudi Arabia - Market size and forecast 2025-2030 ($ million)
Data Table on Saudi Arabia - Market size and forecast 2025-2030 ($ million)
Chart on Saudi Arabia - Year-over-year growth 2025-2030 (%)
Data Table on Saudi Arabia - Year-over-year growth 2025-2030 (%)

12.7.3 South Africa - Market size and forecast 2025-2030

Chart on South Africa - Market size and forecast 2025-2030 ($ million)
Data Table on South Africa - Market size and forecast 2025-2030 ($ million)
Chart on South Africa - Year-over-year growth 2025-2030 (%)
Data Table on South Africa - Year-over-year growth 2025-2030 (%)

12.7.4 Israel - Market size and forecast 2025-2030

Chart on Israel - Market size and forecast 2025-2030 ($ million)
Data Table on Israel - Market size and forecast 2025-2030 ($ million)
Chart on Israel - Year-over-year growth 2025-2030 (%)
Data Table on Israel - Year-over-year growth 2025-2030 (%)

12.7.5 Egypt - Market size and forecast 2025-2030

Chart on Egypt - Market size and forecast 2025-2030 ($ million)
Data Table on Egypt - Market size and forecast 2025-2030 ($ million)
Chart on Egypt - Year-over-year growth 2025-2030 (%)
Data Table on Egypt - Year-over-year growth 2025-2030 (%)

12.8 Market opportunity by geography

Market opportunity by geography ($ million)
Data Tables on Market opportunity by geography ($ million)

13. Drivers, Challenges, and Opportunity

13.1 Market drivers

Institutionalization of AI and automated self-healing endpoints
Proliferation of zero trust security and identity centric management
Escalation of digital employee experience and user centric optimization

13.2 Market challenges

Technical complexity of legacy estate migration and interoperability
Escalating regulatory friction and data sovereignty compliance rigor
Expanding cyber threat surfaces and zero trust integration hurdles

13.3 Impact of drivers and challenges

Impact of drivers and challenges in 2025 and 2030

13.4 Market opportunities

Industrialization of zero trust architecture integration
Advancements in AI enabled predictive endpoint remediation
Evolution of unified IoT and XR device orchestration

14. Competitive Landscape

14.1 Overview

14.2

Overview on criticality of inputs and factors of differentiation

14.3 Landscape disruption

Overview on factors of disruption

14.4 Industry risks

Impact of key risks on business

15. Competitive Analysis

15.1 Companies profiled

Companies covered

15.2 Company ranking index

15.3 Market positioning of companies

Matrix on companies position and classification

15.4 Absolute Software Corp.

Absolute Software Corp. - Overview
Absolute Software Corp. - Product / Service
Absolute Software Corp. - Key offerings
SWOT

15.5 BlackBerry Ltd.

BlackBerry Ltd. - Overview
BlackBerry Ltd. - Business segments
BlackBerry Ltd. - Key offerings
BlackBerry Ltd. - Segment focus
SWOT

15.6 Citrix Systems Inc.

Citrix Systems Inc. - Overview
Citrix Systems Inc. - Product / Service
Citrix Systems Inc. - Key offerings
SWOT

15.7 IBM Corp.

IBM Corp. - Overview
IBM Corp. - Business segments
IBM Corp. - Key news
IBM Corp. - Key offerings
IBM Corp. - Segment focus
SWOT

15.8 Ivanti Software Inc.

Ivanti Software Inc. - Overview
Ivanti Software Inc. - Product / Service
Ivanti Software Inc. - Key offerings
SWOT

15.9 JAMF Holding Corp.

JAMF Holding Corp. - Overview
JAMF Holding Corp. - Product / Service
JAMF Holding Corp. - Key offerings
SWOT

15.10 JumpCloud Inc.

JumpCloud Inc. - Overview
JumpCloud Inc. - Product / Service
JumpCloud Inc. - Key offerings
SWOT

15.11 Matrix42 GmbH

Matrix42 GmbH - Overview
Matrix42 GmbH - Product / Service
Matrix42 GmbH - Key offerings
SWOT

15.12 Microsoft Corp.

Microsoft Corp. - Overview
Microsoft Corp. - Business segments
Microsoft Corp. - Key news
Microsoft Corp. - Key offerings
Microsoft Corp. - Segment focus
SWOT

15.13 Mitsogo Inc.

Mitsogo Inc. - Overview
Mitsogo Inc. - Product / Service
Mitsogo Inc. - Key offerings
SWOT

15.14 N able Inc.

N able Inc. - Overview
N able Inc. - Product / Service
N able Inc. - Key offerings
SWOT

15.15 Open Text Corp.

Open Text Corp. - Overview
Open Text Corp. - Business segments
Open Text Corp. - Key offerings
Open Text Corp. - Segment focus
SWOT

15.16 Sand Studio

Sand Studio - Overview
Sand Studio - Product / Service
Sand Studio - Key offerings
SWOT

15.17 Sophos Group Ltd.

Sophos Group Ltd. - Overview
Sophos Group Ltd. - Product / Service
Sophos Group Ltd. - Key offerings
SWOT

15.18 Zoho Corp. Pvt. Ltd.

Zoho Corp. Pvt. Ltd. - Overview
Zoho Corp. Pvt. Ltd. - Product / Service
Zoho Corp. Pvt. Ltd. - Key offerings
SWOT

16. Appendix

16.1 Scope of the report

Market definition
Objectives
Notes and caveats

16.2 Inclusions and exclusions checklist

Inclusions checklist
Exclusions checklist

16.3 Currency conversion rates for US$

16.4 Research methodology

16.5 Data procurement

Information sources

16.6 Data validation

16.7 Validation techniques employed for market sizing

16.8 Data synthesis

16.9 360 degree market analysis

16.10 List of abbreviations

Research Methodology

Technavio presents a detailed picture of the market by way of study, synthesis, and summation of data from multiple sources. The analysts have presented the various facets of the market with a particular focus on identifying the key industry influencers. The data thus presented is comprehensive, reliable, and the result of extensive research, both primary and secondary.

INFORMATION SOURCES

Primary sources

  • Manufacturers and suppliers
  • Channel partners
  • Industry experts
  • Strategic decision makers

Secondary sources

  • Industry journals and periodicals
  • Government data
  • Financial reports of key industry players
  • Historical data
  • Press releases

DATA ANALYSIS

Data Synthesis

  • Collation of data
  • Estimation of key figures
  • Analysis of derived insights

Data Validation

  • Triangulation with data models
  • Reference against proprietary databases
  • Corroboration with industry experts

REPORT WRITING

Qualitative

  • Market drivers
  • Market challenges
  • Market trends
  • Five forces analysis

Quantitative

  • Market size and forecast
  • Market segmentation
  • Geographical insights
  • Competitive landscape

Interested in this report?

Get your sample now to see our research methodology and insights!

Download Now

Frequently Asked Questions

Unified Endpoint Management (UEM) market growth will increase by USD 11365.0 million during 2026-2030.

The Unified Endpoint Management (UEM) market is expected to grow at a CAGR of 10.4% during 2026-2030.

Unified Endpoint Management (UEM) market is segmented by Component (Solutions, Services) Deployment (Cloud, On-premises, Hybrid) End-user (Large enterprises, SMEs)

42Gears Mobility Systems Ltd., Absolute Software Corp., Atera Networks Ltd., BlackBerry Ltd., Citrix Systems Inc., IBM Corp., Ivanti Software Inc., JAMF Holding Corp., JumpCloud Inc., Matrix42 GmbH, Microsoft Corp., Miradore Oy, Mitsogo Inc., N able Inc., NinjaOne, Open Text Corp., Sand Studio, Sophos Group Ltd., Tanium Inc., Zoho Corp. Pvt. Ltd. are a few of the key vendors in the Unified Endpoint Management (UEM) market.

North America will register the highest growth rate of 35.1% among the other regions. Therefore, the Unified Endpoint Management (UEM) market in North America is expected to garner significant business opportunities for the vendors during the forecast period.

US, Canada, Mexico, Germany, France, UK, Italy, Russia, The Netherlands, China, Japan, India, South Korea, Australia, Indonesia, Brazil, Argentina, Chile, UAE, Saudi Arabia, South Africa, Israel, Egypt

  • Institutionalization of AI and automated self-healing endpoints is the driving factor this market.

The Unified Endpoint Management (UEM) market vendors should focus on grabbing business opportunities from the Component segment as it accounted for the largest market share in the base year.
RIA - Research AI Assistant
Ask RIA