
Warehouse Racking Market Analysis, Size, and Forecast 2026-2030: APAC (China, India, and Japan), North America (US, Canada, and Mexico), Europe (Germany, UK, and France), Middle East and Africa (Saudi Arabia, UAE, and South Africa), South America (Brazil, Argentina, and Colombia), and Rest of World (ROW)

Warehouse Racking Market Analysis, Size, and Forecast 2026-2030:
APAC (China, India, and Japan), North America (US, Canada, and Mexico), Europe (Germany, UK, and France), Middle East and Africa (Saudi Arabia, UAE, and South Africa), South America (Brazil, Argentina, and Colombia), and Rest of World (ROW)

Published: Oct 2026 303 Pages SKU: IRTNTR43352

Market Overview at a Glance

$2.42 B
Market Opportunity
6.2%
CAGR 2025 - 2030
59.8%
APAC Growth
$1.45 B
Automotive industry segment 2024

Warehouse Racking Market Size 2026-2030

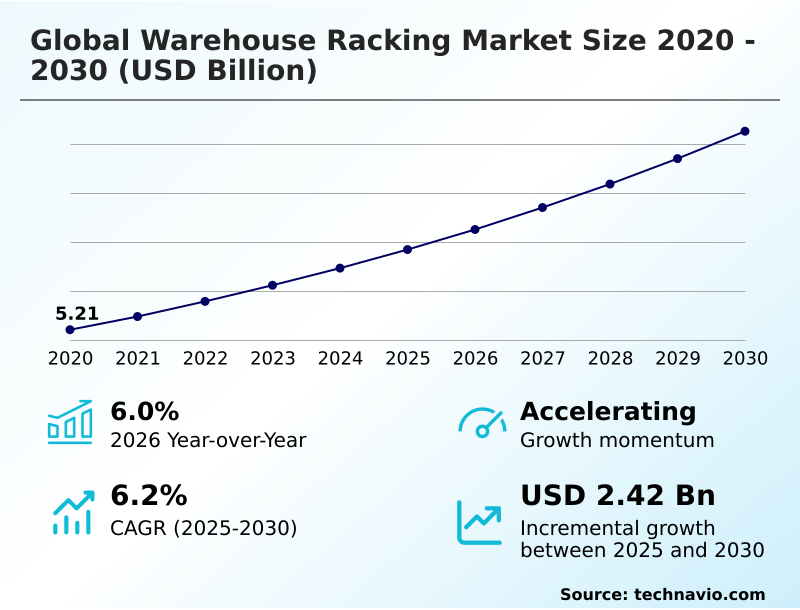
The warehouse racking market size is valued to increase by USD 2.42 billion, at a CAGR of 6.2% from 2025 to 2030. Proliferation of global e-commerce and shift toward D2C logistics will drive the warehouse racking market.

Major Market Trends & Insights

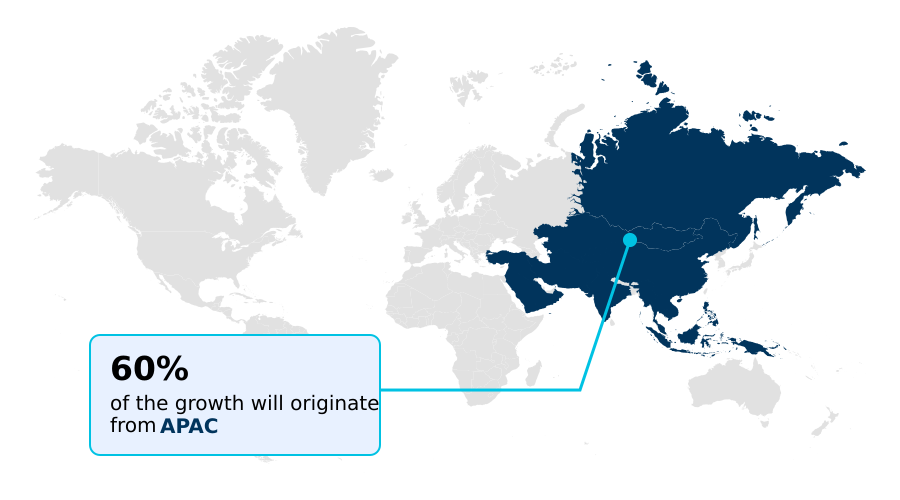
  • APAC dominated the market and accounted for a 59.8% growth during the forecast period.
  • By End-user - Automotive industry segment was valued at USD 1.45 billion in 2024
  • By Product - Selective pallets segment accounted for the largest market revenue share in 2024

Market Size & Forecast

  • Market Opportunities: USD 4.06 billion
  • Market Future Opportunities: USD 2.42 billion
  • CAGR from 2025 to 2030 : 6.2%

Market Summary

  • The Warehouse Racking Market continues to undergo rapid transformation, propelled by the relentless expansion of industrial supply chains and the pressing need for optimized facility management. In modern distribution centers, the integration of automated retrieval systems with heavy-duty steel configurations ensures rapid order processing.
  • For example, deploying narrow aisle configurations combined with robotic pickers has allowed regional grocery fulfillment operators to boost their cubic capacity by 40% compared to conventional floor-stacking methods. This continuous push for operational optimization acts as a primary market driver, compelling enterprises to prioritize vertical expansion over costly horizontal land acquisitions.
  • Conversely, operators face a critical challenge regarding the steep upfront capital expenditure and the unpredictability of raw steel pricing, which can significantly delay extensive infrastructure upgrades. Despite these financial hurdles, the necessity to meet accelerated delivery timelines requires resilient, high-capacity installations.
  • Consequently, the sector remains central to securing supply chain resilience, enabling facilities to handle increased throughput while maximizing their existing industrial footprints safely.

What will be the Size of the Warehouse Racking Market during the forecast period?
Get Key Insights on Market Forecast (PDF) Get Free Sample

How is the Warehouse Racking Market Segmented?

The warehouse racking industry research report provides comprehensive data (region-wise segment analysis), with forecasts and estimates in "USD million" for the period 2026-2030, as well as historical data from 2020-2024 for the following segments.

  • End-user
    • Automotive industry
    • Food and beverage industry
    • Retail industry
    • Others
  • Product
    • Selective pallets
    • Push back
    • Drive-in
    • Pallet flow
    • Others
  • Capacity
    • Medium duty
    • Heavy duty
    • Light duty
  • Geography
    • APAC
      • China
      • India
      • Japan
      • South Korea
      • Australia
      • Indonesia
    • North America
      • US
      • Canada
      • Mexico
    • Europe
      • Germany
      • UK
      • France
      • Italy
      • Spain
      • The Netherlands
    • Middle East and Africa
      • Saudi Arabia
      • UAE
      • South Africa
      • Israel
      • Turkey
    • South America
      • Brazil
      • Argentina
      • Colombia

By End-user Insights

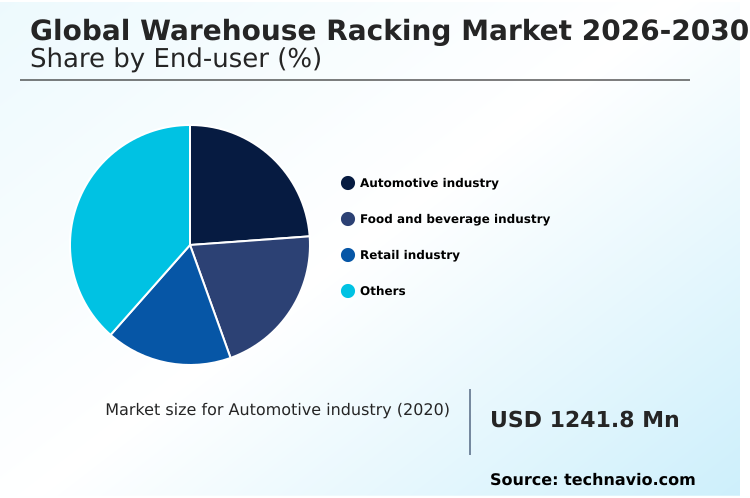
The automotive industry segment is estimated to witness significant growth during the forecast period.

The automotive industry requires precise structural steel uprights and robust selective pallet systems to manage an immense variety of components spanning small electronics to massive engine blocks.

Automotive assembly hubs utilize advanced automated storage retrieval technologies to accelerate component staging across just-in-time production schedules. As electric vehicle manufacturing accelerates, operations emphasize extreme storage density optimization to safely house heavy battery modules.

Organizations are retrofitting legacy spaces to support dynamic vertical density, enabling maximum cube utilization without footprint expansion. This structural modernization has yielded a 25% improvement in picking velocity for dense parts.

Additionally, enforcing strict inventory rotation protocols within specialized layouts has led to a 15% reduction in internal transit delays compared to traditional manual racking layouts.
Get Free Sample

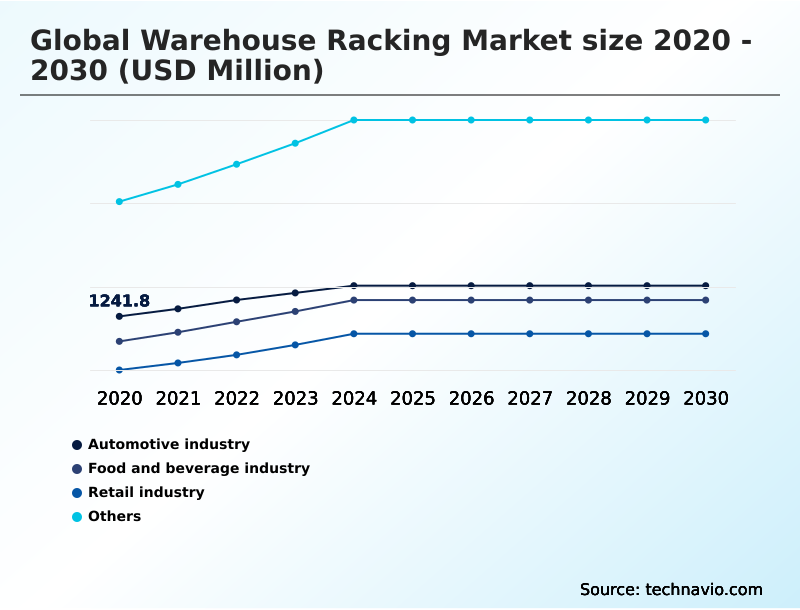
The Automotive industry segment was valued at USD 1.45 billion in 2024 and showed a gradual increase during the forecast period.
Get Free Sample

Regional Analysis

APAC is estimated to contribute 59.8% to the growth of the global market during the forecast period.Technavio’s analysts have elaborately explained the regional trends and drivers that shape the market during the forecast period.
See How Warehouse Racking Market Demand is Rising in APAC Get Free Sample

The industrial storage landscape demonstrates distinct regional variations driven by facility constraints and automation readiness. APAC exhibits aggressive infrastructure modernization, maintaining a 20% higher implementation rate for advanced very narrow aisle systems than South America.

Within APAC, severe land scarcity forces operators to deploy galvanized racking frames and high bay warehousing structures to maximize vertical capacity, achieving a 35% improvement in spatial volume utilization across mega-fulfillment centers.

Conversely, North America prioritizes rapid replenishment models to counter severe labor shortages. North American logistics hubs leverage intricate frameworks to achieve a 25% increase in order fulfillment velocity. These structural variations highlight how distinct regional pressures dictate procurement.

While APAC maximizes density, North America focuses on accelerating handling to dominate expedited consumer delivery timelines.

Market Dynamics

Our researchers analyzed the data with 2025 as the base year, along with the key drivers, trends, and challenges. A holistic analysis of drivers will help companies refine their marketing strategies to gain a competitive advantage.

  • As supply chain networks face escalating pressure to accelerate fulfillment cycles and maximize facility footprints, the deployment of advanced storage architectures has become paramount. Facilities operating in high-demand environments are increasingly adopting multi tier mezzanine storage systems to capitalize on vertical space without requiring expensive structural expansions.
  • This strategic shift allows distribution centers to double their picking surfaces, yielding a 45% greater inventory handling capacity compared to standard single-level setups. When managing vast quantities of uniform goods, organizations implement a very narrow aisle storage configuration to aggressively condense their floor layouts and streamline material flow.
  • Furthermore, the integration of automated pallet shuttle integration systems has revolutionized deep-lane storage, minimizing the need for manual forklift travel and significantly lowering the risk of operational accidents. To ensure these sophisticated frameworks remain secure under heavy, continuous loads, logistics managers are mandating structural health monitoring for industrial storage to proactively detect metal fatigue and prevent collapses.
  • In specialized sectors such as pharmaceutical and food distribution, the reliance on high bay cold chain storage racks remains critical to preserving thermal isolation while safeguarding perishable inventory. Ultimately, these targeted investments enable complex supply chains to maintain rigorous compliance standards and decisively outpace the constraints of limited commercial real estate.
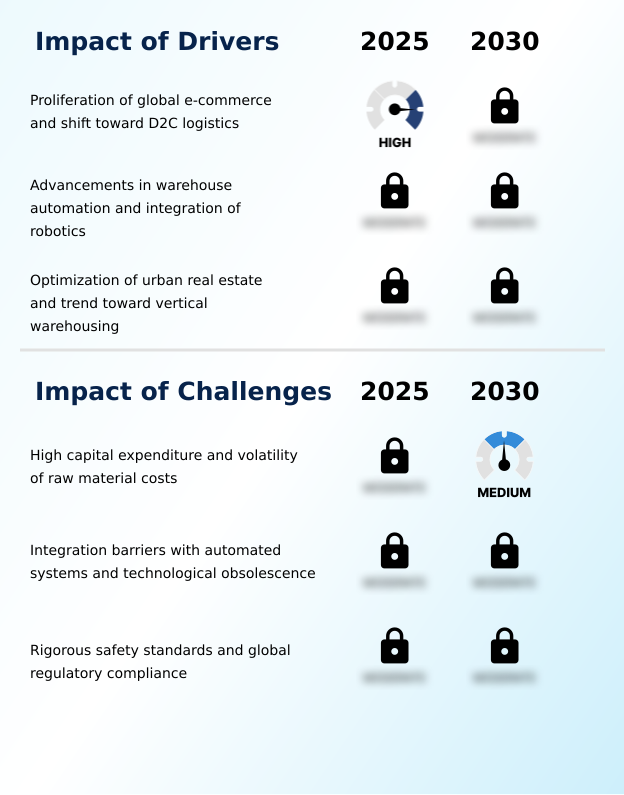
What are the key market drivers leading to the rise in the adoption of Warehouse Racking Industry?

  • The proliferation of worldwide e-commerce alongside a strategic shift toward direct-to-consumer logistics serves as the primary catalyst propelling market expansion.

  • The accelerated demand for flawless cross docking operations serves as a massive operational driver, compelling the overhaul of traditional storage facilities. Because contemporary retail networks require immediate inventory turnaround, managers are replacing static shelving with sophisticated intralogistics automation.
  • This structural modernization drastically minimizes the distance workers must travel to process inbound shipments. By implementing rigorous predictive structural analytics, modern distribution nodes have reduced unplanned maintenance downtime by 25% and lowered localized labor costs by 12%.
  • The shift toward adaptable hybrid storage environments and specialized carton flow lanes ensures businesses can meet stringent delivery mandates securely.
  • Ultimately, the urgent need to support rigorous temperature controlled distribution within expansive cold chain storage facilities forces extensive investments in adaptable, high-density handling technologies.

What are the market trends shaping the Warehouse Racking Industry?

  • The integration of sustainability and circular economy principles within storage infrastructure constitutes a primary upcoming market trend. This shift emphasizes eco-friendly materials and lifecycle optimization to minimize environmental impact across industrial facilities.

  • A definitive trend within modern distribution centers is the aggressive deployment of automated guided vehicles alongside specialized cantilever storage racks. Supply chain nearshoring initiatives require manufacturers to handle vast quantities of irregular industrial components, forcing an upgrade in heavy duty load capacities across fulfillment networks. This engineering shift allows facilities to safely accommodate autonomous robotics without compromising rack stability.
  • Consequently, integrating automated shuttle integration with dense pallet flow mechanisms has generated a 30% reduction in manual retrieval downtime. Furthermore, optimizing lane layouts to support high-velocity piece picking has boosted cubic volume efficiency by 18%. This technological convergence guarantees that organizations can sustain extreme loads securely, dramatically enhancing overall operational output and preserving maximum order accuracy across high-demand industrial hubs.

What challenges does the Warehouse Racking Industry face during its growth?

  • The requirement for substantial initial capital expenditure, coupled with the persistent volatility of raw material costs, represents a formidable constraint impeding industry growth.

  • The complexity of executing strict seismic resistant design compliance presents a formidable operational challenge across heavily congested, earthquake-prone fulfillment zones. Operators face intense pressure regarding structural safety, forcing them to condense extensive inventories into severely constrained vertical footprints using multi tier mezzanine setups.
  • This environment requires facilities to deploy highly adaptable structural health monitoring sensors alongside intricate gravity live storage, which dramatically elevates initial installation complexity. Consequently, the mandate to ensure absolute mechanical shock resistance alongside seamless material handling transit through dense push back channels has increased infrastructure installation costs by 22% and extended commissioning delays by 15% compared to standard deployments.
  • Navigating these intensive architectural requirements heavily impacts budget planning, ultimately constraining the rapid expansion capabilities of third-party logistics providers.

Exclusive Technavio Analysis on Customer Landscape

The warehouse racking market forecasting report includes the adoption lifecycle of the market, covering from the innovator’s stage to the laggard’s stage. It focuses on adoption rates in different regions based on penetration. Furthermore, the warehouse racking market report also includes key purchase criteria and drivers of price sensitivity to help companies evaluate and develop their market growth analysis strategies.
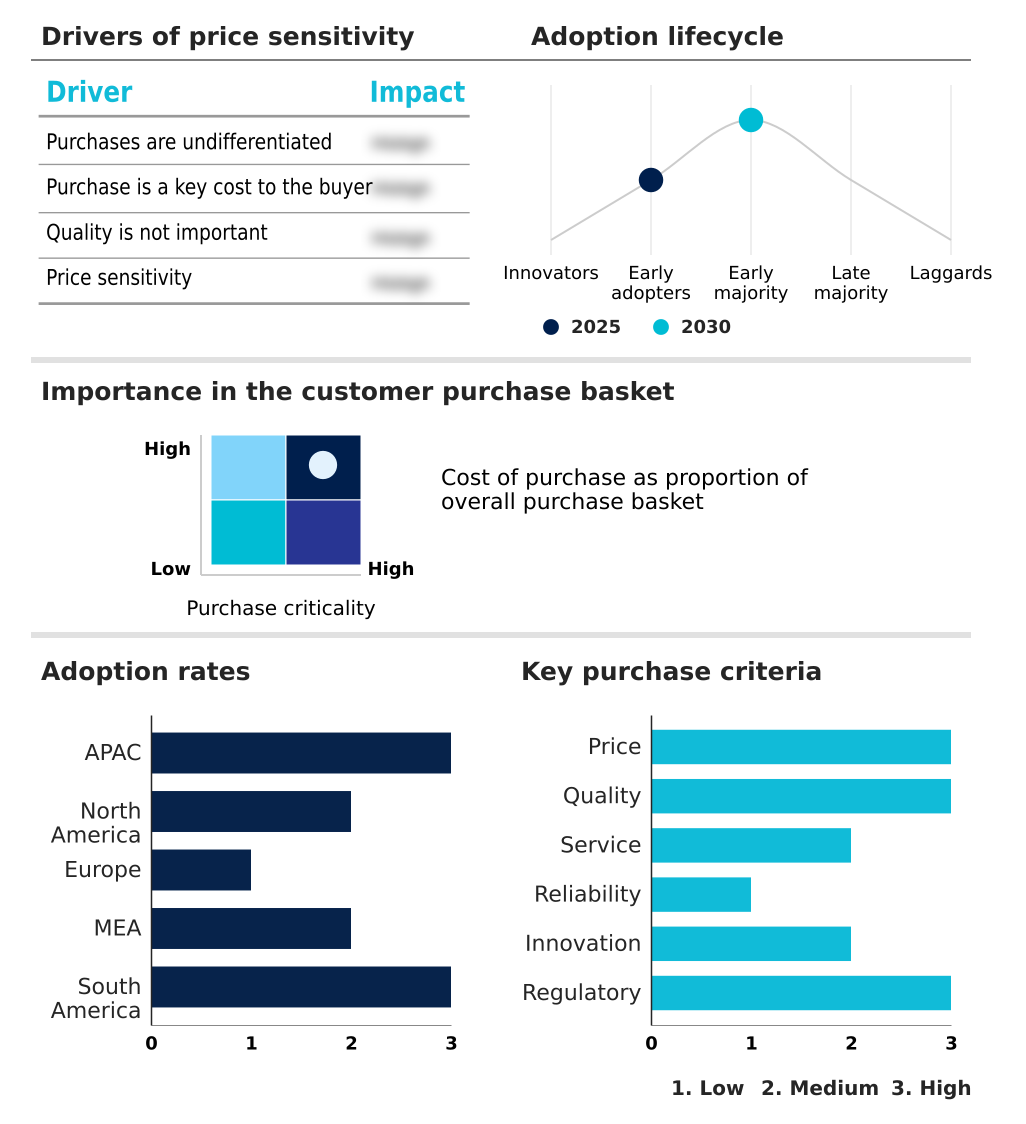
Customer Landscape of Warehouse Racking Industry

Competitive Landscape

Companies are implementing various strategies, such as strategic alliances, warehouse racking market forecast, partnerships, mergers and acquisitions, geographical expansion, and product/service launches, to enhance their presence in the industry.

Advance Storage Products - This provider delivers engineered storage solutions encompassing advanced selective, push-back, and drive-in pallet configurations to optimize vertical volume and enhance industrial intralogistics efficiency.

The industry research and growth report includes detailed analyses of the competitive landscape of the market and information about key companies, including:

  • Advance Storage Products
  • AR Racking SAU
  • Atox S.A.
  • BITO Lagertechnik Bittmann GmbH
  • Bulldog Rack Co
  • Frazier Industrial Co
  • Godrej and Boyce Manufacturing
  • Gonvarri Material Handling AS
  • Heartland Steel Products Inc.
  • Inform Racking
  • Jungheinrich Group
  • Macrack Australia Pty Ltd
  • Mecalux Group
  • Metalsistem S.p.A.
  • Montel Inc.
  • Nedcon B.V.
  • Ridg U Rak Inc.
  • Speedrack Products Group Ltd.
  • Sperrin Metal Storage Solutions
  • SSI Schafer IT Solutions GmbH

Qualitative and quantitative analysis of companies has been conducted to help clients understand the wider business environment as well as the strengths and weaknesses of key industry players. Data is qualitatively analyzed to categorize companies as pure play, category-focused, industry-focused, and diversified; it is quantitatively analyzed to categorize companies as dominant, leading, strong, tentative, and weak.

Recent Development and News in Warehouse racking market

  • In the Building Products industry, the adoption of strict green building certifications mandated a 30% reduction in embedded carbon for structural steel, directly impacting Warehouse Racking demand by accelerating the procurement of sustainable vertical uprights for modernized industrial facility upgrades.
  • The shift toward pre-fabricated modular construction materials accelerated facility build times by 40%, necessitating adaptable storage structures and highly scalable mezzanine layouts that integrate seamlessly with high-speed sorting technologies across new logistics centers.
  • Persistent supply chain localization initiatives increased regional raw steel production capacity by 15%, stabilizing material costs and driving robust demand for heavy-tier load configurations designed to maximize warehouse footprint utilization within localized distribution hubs.
  • Advancements in heavy-duty concrete floor engineering expanded point-load thresholds by 25%, enabling the safe installation of extreme vertical density structures, which directly boosted the deployment of high-bay warehousing frameworks across major fulfillment networks.

Dive into Technavio’s robust research methodology, blending expert interviews, extensive data synthesis, and validated models for unparalleled Warehouse Racking Market insights. See full methodology.

Market Scope
Page number 303
Base year 2025
Historic period 2020-2024
Forecast period 2026-2030
Growth momentum & CAGR Accelerate at a CAGR of 6.2%
Market growth 2026-2030 USD 2420.6 million
Market structure Fragmented
YoY growth 2025-2026(%) 6.0%
Key countries China, India, Japan, South Korea, Australia, Indonesia, US, Canada, Mexico, Germany, UK, France, Italy, Spain, The Netherlands, Saudi Arabia, UAE, South Africa, Israel, Turkey, Brazil, Argentina and Colombia
Competitive landscape Leading Companies, Market Positioning of Companies, Competitive Strategies, and Industry Risks

Request Free Sample

Research Analyst Overview

  • The continuous evolution of the Warehouse Racking sector reflects a fundamental shift in how global supply chains manage complex inventory under severe spatial constraints. Industrial developers are aggressively deploying high bay warehousing and structurally robust multi tier mezzanine layouts to maximize vertical capacity without acquiring new land.
  • This structural transition directly supports the implementation of intralogistics automation, enabling facilities to process higher order volumes with exceptional precision. For instance, the integration of automated guided vehicles alongside precision-engineered structural steel uprights has enabled distribution centers to achieve a 30% reduction in inbound processing time compared to legacy floor-stacking operations.
  • Furthermore, the adoption of specialized cold chain storage frames ensures strict compliance with pharmaceutical and perishable food distribution protocols. This emphasis on resilient infrastructure fundamentally alters executive budgeting, compelling boardroom leaders to prioritize long-term asset optimization over short-term capital savings.

What are the Key Data Covered in this Warehouse Racking Market Research and Growth Report?

  • What is the expected growth of the Warehouse Racking Market between 2026 and 2030?

    • USD 2.42 billion, at a CAGR of 6.2%

  • What segmentation does the market report cover?

    • The report is segmented by End-user (Automotive industry, Food and beverage industry, Retail industry, and Others), Product (Selective pallets, Push back, Drive-in, Pallet flow, and Others), Capacity (Medium duty, Heavy duty, and Light duty) and Geography (APAC, North America, Europe, Middle East and Africa, South America)

  • Which regions are analyzed in the report?

    • APAC, North America, Europe, Middle East and Africa and South America

  • What are the key growth drivers and market challenges?

    • Proliferation of global e-commerce and shift toward D2C logistics, High capital expenditure and volatility of raw material costs

  • Who are the major players in the Warehouse Racking Market?

    • Advance Storage Products, AR Racking SAU, Atox S.A., BITO Lagertechnik Bittmann GmbH, Bulldog Rack Co, Frazier Industrial Co, Godrej and Boyce Manufacturing, Gonvarri Material Handling AS, Heartland Steel Products Inc., Inform Racking, Jungheinrich Group, Macrack Australia Pty Ltd, Mecalux Group, Metalsistem S.p.A., Montel Inc., Nedcon B.V., Ridg U Rak Inc., Speedrack Products Group Ltd., Sperrin Metal Storage Solutions and SSI Schafer IT Solutions GmbH

Market Research Insights

  • The storage infrastructure landscape is evolving rapidly as operators abandon conventional layouts for advanced storage density optimization. By transitioning to high-density frameworks, distribution hubs have achieved a 35% improvement in spatial volume utilization, dramatically offsetting the rising costs of industrial real estate.
  • Furthermore, the integration of automated shuttles into deep-lane structures has yielded a 25% reduction in transit times, directly lowering daily operational overhead. Implementing rigorous inventory rotation protocols within these modernized systems guarantees a 15% decrease in perishable goods spoilage.
  • This continuous drive toward enhancing heavy duty load capacities ensures that logistics facilities maintain optimal throughput and robust compliance in an increasingly demanding supply chain environment.

We can help! Our analysts can customize this warehouse racking market research report to meet your requirements.

Get in touch

1. Executive Summary

1.1 Market overview

Executive Summary - Chart on Market Overview
Executive Summary - Data Table on Market Overview
Executive Summary - Chart on Global Market Characteristics
Executive Summary - Chart on Market by Geography
Executive Summary - Chart on Market Segmentation by End-user
Executive Summary - Chart on Market Segmentation by Product
Executive Summary - Chart on Market Segmentation by Capacity
Executive Summary - Chart on Incremental Growth
Executive Summary - Data Table on Incremental Growth
Executive Summary - Chart on Company Market Positioning

2. Technavio Analysis

2.1 Analysis of price sensitivity, lifecycle, customer purchase basket, adoption rates, and purchase criteria

2.2 Criticality of inputs and Factors of differentiation

Chart on Overview on criticality of inputs and factors of differentiation

2.3 Factors of disruption

Chart on Overview on factors of disruption

2.4 Impact of drivers and challenges

Chart on Impact of drivers and challenges in 2025 and 2030

3. Market Landscape

3.1 Market ecosystem

Chart on Parent Market
Data Table on - Parent Market

3.2 Market characteristics

Chart on Market characteristics analysis

3.3 Value chain analysis

Chart on Value chain analysis

4. Market Sizing

4.1 Market definition

Data Table on Offerings of companies included in the market definition

4.2 Market segment analysis

Market segments

4.3 Market size 2025

4.4 Market outlook: Forecast for 2025-2030

Chart on Global - Market size and forecast 2025-2030 ($ million)
Data Table on Global - Market size and forecast 2025-2030 ($ million)
Chart on Global Market: Year-over-year growth 2025-2030 (%)
Data Table on Global Market: Year-over-year growth 2025-2030 (%)

5. Historic Market Size

5.1 Global Warehouse Racking Market 2020 - 2024

Historic Market Size - Data Table on Global Warehouse Racking Market 2020 - 2024 ($ million)

5.2 End-user segment analysis 2020 - 2024

Historic Market Size - End-user Segment 2020 - 2024 ($ million)

5.3 Product segment analysis 2020 - 2024

Historic Market Size - Product Segment 2020 - 2024 ($ million)

5.4 Capacity segment analysis 2020 - 2024

Historic Market Size - Capacity Segment 2020 - 2024 ($ million)

5.5 Geography segment analysis 2020 - 2024

Historic Market Size - Geography Segment 2020 - 2024 ($ million)

5.6 Country segment analysis 2020 - 2024

Historic Market Size - Country Segment 2020 - 2024 ($ million)

6. Qualitative Analysis

6.1 Impact of AI on Global Warehouse Racking Market

6.2 Impact of Geopolitical Conflicts on Global Warehouse Racking Market

7. Five Forces Analysis

7.1 Five forces summary

Five forces analysis - Comparison between 2025 and 2030

7.2 Bargaining power of buyers

Bargaining power of buyers - Impact of key factors 2025 and 2030

7.3 Bargaining power of suppliers

Bargaining power of suppliers - Impact of key factors in 2025 and 2030

7.4 Threat of new entrants

Threat of new entrants - Impact of key factors in 2025 and 2030

7.5 Threat of substitutes

Threat of substitutes - Impact of key factors in 2025 and 2030

7.6 Threat of rivalry

Threat of rivalry - Impact of key factors in 2025 and 2030

7.7 Market condition

Chart on Market condition - Five forces 2025 and 2030

8. Market Segmentation by End-user

8.1 Market segments

Chart on End-user - Market share 2025-2030 (%)
Data Table on End-user - Market share 2025-2030 (%)

8.2 Comparison by End-user

Chart on Comparison by End-user
Data Table on Comparison by End-user

8.3 Automotive industry - Market size and forecast 2025-2030

Chart on Automotive industry - Market size and forecast 2025-2030 ($ million)
Data Table on Automotive industry - Market size and forecast 2025-2030 ($ million)
Chart on Automotive industry - Year-over-year growth 2025-2030 (%)
Data Table on Automotive industry - Year-over-year growth 2025-2030 (%)

8.4 Food and beverage industry - Market size and forecast 2025-2030

Chart on Food and beverage industry - Market size and forecast 2025-2030 ($ million)
Data Table on Food and beverage industry - Market size and forecast 2025-2030 ($ million)
Chart on Food and beverage industry - Year-over-year growth 2025-2030 (%)
Data Table on Food and beverage industry - Year-over-year growth 2025-2030 (%)

8.5 Retail industry - Market size and forecast 2025-2030

Chart on Retail industry - Market size and forecast 2025-2030 ($ million)
Data Table on Retail industry - Market size and forecast 2025-2030 ($ million)
Chart on Retail industry - Year-over-year growth 2025-2030 (%)
Data Table on Retail industry - Year-over-year growth 2025-2030 (%)

8.6 Others - Market size and forecast 2025-2030

Chart on Others - Market size and forecast 2025-2030 ($ million)
Data Table on Others - Market size and forecast 2025-2030 ($ million)
Chart on Others - Year-over-year growth 2025-2030 (%)
Data Table on Others - Year-over-year growth 2025-2030 (%)

8.7 Market opportunity by End-user

Market opportunity by End-user ($ million)
Data Table on Market opportunity by End-user ($ million)

9. Market Segmentation by Product

9.1 Market segments

Chart on Product - Market share 2025-2030 (%)
Data Table on Product - Market share 2025-2030 (%)

9.2 Comparison by Product

Chart on Comparison by Product
Data Table on Comparison by Product

9.3 Selective pallets - Market size and forecast 2025-2030

Chart on Selective pallets - Market size and forecast 2025-2030 ($ million)
Data Table on Selective pallets - Market size and forecast 2025-2030 ($ million)
Chart on Selective pallets - Year-over-year growth 2025-2030 (%)
Data Table on Selective pallets - Year-over-year growth 2025-2030 (%)

9.4 Push back - Market size and forecast 2025-2030

Chart on Push back - Market size and forecast 2025-2030 ($ million)
Data Table on Push back - Market size and forecast 2025-2030 ($ million)
Chart on Push back - Year-over-year growth 2025-2030 (%)
Data Table on Push back - Year-over-year growth 2025-2030 (%)

9.5 Drive-in - Market size and forecast 2025-2030

Chart on Drive-in - Market size and forecast 2025-2030 ($ million)
Data Table on Drive-in - Market size and forecast 2025-2030 ($ million)
Chart on Drive-in - Year-over-year growth 2025-2030 (%)
Data Table on Drive-in - Year-over-year growth 2025-2030 (%)

9.6 Pallet flow - Market size and forecast 2025-2030

Chart on Pallet flow - Market size and forecast 2025-2030 ($ million)
Data Table on Pallet flow - Market size and forecast 2025-2030 ($ million)
Chart on Pallet flow - Year-over-year growth 2025-2030 (%)
Data Table on Pallet flow - Year-over-year growth 2025-2030 (%)

9.7 Others - Market size and forecast 2025-2030

Chart on Others - Market size and forecast 2025-2030 ($ million)
Data Table on Others - Market size and forecast 2025-2030 ($ million)
Chart on Others - Year-over-year growth 2025-2030 (%)
Data Table on Others - Year-over-year growth 2025-2030 (%)

9.8 Market opportunity by Product

Market opportunity by Product ($ million)
Data Table on Market opportunity by Product ($ million)

10. Market Segmentation by Capacity

10.1 Market segments

Chart on Capacity - Market share 2025-2030 (%)
Data Table on Capacity - Market share 2025-2030 (%)

10.2 Comparison by Capacity

Chart on Comparison by Capacity
Data Table on Comparison by Capacity

10.3 Medium duty - Market size and forecast 2025-2030

Chart on Medium duty - Market size and forecast 2025-2030 ($ million)
Data Table on Medium duty - Market size and forecast 2025-2030 ($ million)
Chart on Medium duty - Year-over-year growth 2025-2030 (%)
Data Table on Medium duty - Year-over-year growth 2025-2030 (%)

10.4 Heavy duty - Market size and forecast 2025-2030

Chart on Heavy duty - Market size and forecast 2025-2030 ($ million)
Data Table on Heavy duty - Market size and forecast 2025-2030 ($ million)
Chart on Heavy duty - Year-over-year growth 2025-2030 (%)
Data Table on Heavy duty - Year-over-year growth 2025-2030 (%)

10.5 Light duty - Market size and forecast 2025-2030

Chart on Light duty - Market size and forecast 2025-2030 ($ million)
Data Table on Light duty - Market size and forecast 2025-2030 ($ million)
Chart on Light duty - Year-over-year growth 2025-2030 (%)
Data Table on Light duty - Year-over-year growth 2025-2030 (%)

10.6 Market opportunity by Capacity

Market opportunity by Capacity ($ million)
Data Table on Market opportunity by Capacity ($ million)

11. Customer Landscape

11.1 Customer landscape overview

Analysis of price sensitivity, lifecycle, customer purchase basket, adoption rates, and purchase criteria

12. Geographic Landscape

12.1 Geographic segmentation

Chart on Market share by geography 2025-2030 (%)
Data Table on Market share by geography 2025-2030 (%)

12.2 Geographic comparison

Chart on Geographic comparison
Data Table on Geographic comparison

12.3 APAC - Market size and forecast 2025-2030

Chart on APAC - Market size and forecast 2025-2030 ($ million)
Data Table on APAC - Market size and forecast 2025-2030 ($ million)
Chart on APAC - Year-over-year growth 2025-2030 (%)
Data Table on APAC - Year-over-year growth 2025-2030 (%)
Chart on Regional Comparison - APAC
Data Table on Regional Comparison - APAC

12.3.1 China - Market size and forecast 2025-2030

Chart on China - Market size and forecast 2025-2030 ($ million)
Data Table on China - Market size and forecast 2025-2030 ($ million)
Chart on China - Year-over-year growth 2025-2030 (%)
Data Table on China - Year-over-year growth 2025-2030 (%)

12.3.2 India - Market size and forecast 2025-2030

Chart on India - Market size and forecast 2025-2030 ($ million)
Data Table on India - Market size and forecast 2025-2030 ($ million)
Chart on India - Year-over-year growth 2025-2030 (%)
Data Table on India - Year-over-year growth 2025-2030 (%)

12.3.3 Japan - Market size and forecast 2025-2030

Chart on Japan - Market size and forecast 2025-2030 ($ million)
Data Table on Japan - Market size and forecast 2025-2030 ($ million)
Chart on Japan - Year-over-year growth 2025-2030 (%)
Data Table on Japan - Year-over-year growth 2025-2030 (%)

12.3.4 South Korea - Market size and forecast 2025-2030

Chart on South Korea - Market size and forecast 2025-2030 ($ million)
Data Table on South Korea - Market size and forecast 2025-2030 ($ million)
Chart on South Korea - Year-over-year growth 2025-2030 (%)
Data Table on South Korea - Year-over-year growth 2025-2030 (%)

12.3.5 Australia - Market size and forecast 2025-2030

Chart on Australia - Market size and forecast 2025-2030 ($ million)
Data Table on Australia - Market size and forecast 2025-2030 ($ million)
Chart on Australia - Year-over-year growth 2025-2030 (%)
Data Table on Australia - Year-over-year growth 2025-2030 (%)

12.3.6 Indonesia - Market size and forecast 2025-2030

Chart on Indonesia - Market size and forecast 2025-2030 ($ million)
Data Table on Indonesia - Market size and forecast 2025-2030 ($ million)
Chart on Indonesia - Year-over-year growth 2025-2030 (%)
Data Table on Indonesia - Year-over-year growth 2025-2030 (%)

12.4 North America - Market size and forecast 2025-2030

Chart on North America - Market size and forecast 2025-2030 ($ million)
Data Table on North America - Market size and forecast 2025-2030 ($ million)
Chart on North America - Year-over-year growth 2025-2030 (%)
Data Table on North America - Year-over-year growth 2025-2030 (%)
Chart on Regional Comparison - North America
Data Table on Regional Comparison - North America

12.4.1 US - Market size and forecast 2025-2030

Chart on US - Market size and forecast 2025-2030 ($ million)
Data Table on US - Market size and forecast 2025-2030 ($ million)
Chart on US - Year-over-year growth 2025-2030 (%)
Data Table on US - Year-over-year growth 2025-2030 (%)

12.4.2 Canada - Market size and forecast 2025-2030

Chart on Canada - Market size and forecast 2025-2030 ($ million)
Data Table on Canada - Market size and forecast 2025-2030 ($ million)
Chart on Canada - Year-over-year growth 2025-2030 (%)
Data Table on Canada - Year-over-year growth 2025-2030 (%)

12.4.3 Mexico - Market size and forecast 2025-2030

Chart on Mexico - Market size and forecast 2025-2030 ($ million)
Data Table on Mexico - Market size and forecast 2025-2030 ($ million)
Chart on Mexico - Year-over-year growth 2025-2030 (%)
Data Table on Mexico - Year-over-year growth 2025-2030 (%)

12.5 Europe - Market size and forecast 2025-2030

Chart on Europe - Market size and forecast 2025-2030 ($ million)
Data Table on Europe - Market size and forecast 2025-2030 ($ million)
Chart on Europe - Year-over-year growth 2025-2030 (%)
Data Table on Europe - Year-over-year growth 2025-2030 (%)
Chart on Regional Comparison - Europe
Data Table on Regional Comparison - Europe

12.5.1 Germany - Market size and forecast 2025-2030

Chart on Germany - Market size and forecast 2025-2030 ($ million)
Data Table on Germany - Market size and forecast 2025-2030 ($ million)
Chart on Germany - Year-over-year growth 2025-2030 (%)
Data Table on Germany - Year-over-year growth 2025-2030 (%)

12.5.2 UK - Market size and forecast 2025-2030

Chart on UK - Market size and forecast 2025-2030 ($ million)
Data Table on UK - Market size and forecast 2025-2030 ($ million)
Chart on UK - Year-over-year growth 2025-2030 (%)
Data Table on UK - Year-over-year growth 2025-2030 (%)

12.5.3 France - Market size and forecast 2025-2030

Chart on France - Market size and forecast 2025-2030 ($ million)
Data Table on France - Market size and forecast 2025-2030 ($ million)
Chart on France - Year-over-year growth 2025-2030 (%)
Data Table on France - Year-over-year growth 2025-2030 (%)

12.5.4 Italy - Market size and forecast 2025-2030

Chart on Italy - Market size and forecast 2025-2030 ($ million)
Data Table on Italy - Market size and forecast 2025-2030 ($ million)
Chart on Italy - Year-over-year growth 2025-2030 (%)
Data Table on Italy - Year-over-year growth 2025-2030 (%)

12.5.5 Spain - Market size and forecast 2025-2030

Chart on Spain - Market size and forecast 2025-2030 ($ million)
Data Table on Spain - Market size and forecast 2025-2030 ($ million)
Chart on Spain - Year-over-year growth 2025-2030 (%)
Data Table on Spain - Year-over-year growth 2025-2030 (%)

12.5.6 The Netherlands - Market size and forecast 2025-2030

Chart on The Netherlands - Market size and forecast 2025-2030 ($ million)
Data Table on The Netherlands - Market size and forecast 2025-2030 ($ million)
Chart on The Netherlands - Year-over-year growth 2025-2030 (%)
Data Table on The Netherlands - Year-over-year growth 2025-2030 (%)

12.6 Middle East and Africa - Market size and forecast 2025-2030

Chart on Middle East and Africa - Market size and forecast 2025-2030 ($ million)
Data Table on Middle East and Africa - Market size and forecast 2025-2030 ($ million)
Chart on Middle East and Africa - Year-over-year growth 2025-2030 (%)
Data Table on Middle East and Africa - Year-over-year growth 2025-2030 (%)
Chart on Regional Comparison - Middle East and Africa
Data Table on Regional Comparison - Middle East and Africa

12.6.1 Saudi Arabia - Market size and forecast 2025-2030

Chart on Saudi Arabia - Market size and forecast 2025-2030 ($ million)
Data Table on Saudi Arabia - Market size and forecast 2025-2030 ($ million)
Chart on Saudi Arabia - Year-over-year growth 2025-2030 (%)
Data Table on Saudi Arabia - Year-over-year growth 2025-2030 (%)

12.6.2 UAE - Market size and forecast 2025-2030

Chart on UAE - Market size and forecast 2025-2030 ($ million)
Data Table on UAE - Market size and forecast 2025-2030 ($ million)
Chart on UAE - Year-over-year growth 2025-2030 (%)
Data Table on UAE - Year-over-year growth 2025-2030 (%)

12.6.3 South Africa - Market size and forecast 2025-2030

Chart on South Africa - Market size and forecast 2025-2030 ($ million)
Data Table on South Africa - Market size and forecast 2025-2030 ($ million)
Chart on South Africa - Year-over-year growth 2025-2030 (%)
Data Table on South Africa - Year-over-year growth 2025-2030 (%)

12.6.4 Israel - Market size and forecast 2025-2030

Chart on Israel - Market size and forecast 2025-2030 ($ million)
Data Table on Israel - Market size and forecast 2025-2030 ($ million)
Chart on Israel - Year-over-year growth 2025-2030 (%)
Data Table on Israel - Year-over-year growth 2025-2030 (%)

12.6.5 Turkey - Market size and forecast 2025-2030

Chart on Turkey - Market size and forecast 2025-2030 ($ million)
Data Table on Turkey - Market size and forecast 2025-2030 ($ million)
Chart on Turkey - Year-over-year growth 2025-2030 (%)
Data Table on Turkey - Year-over-year growth 2025-2030 (%)

12.7 South America - Market size and forecast 2025-2030

Chart on South America - Market size and forecast 2025-2030 ($ million)
Data Table on South America - Market size and forecast 2025-2030 ($ million)
Chart on South America - Year-over-year growth 2025-2030 (%)
Data Table on South America - Year-over-year growth 2025-2030 (%)
Chart on Regional Comparison - South America
Data Table on Regional Comparison - South America

12.7.1 Brazil - Market size and forecast 2025-2030

Chart on Brazil - Market size and forecast 2025-2030 ($ million)
Data Table on Brazil - Market size and forecast 2025-2030 ($ million)
Chart on Brazil - Year-over-year growth 2025-2030 (%)
Data Table on Brazil - Year-over-year growth 2025-2030 (%)

12.7.2 Argentina - Market size and forecast 2025-2030

Chart on Argentina - Market size and forecast 2025-2030 ($ million)
Data Table on Argentina - Market size and forecast 2025-2030 ($ million)
Chart on Argentina - Year-over-year growth 2025-2030 (%)
Data Table on Argentina - Year-over-year growth 2025-2030 (%)

12.7.3 Colombia - Market size and forecast 2025-2030

Chart on Colombia - Market size and forecast 2025-2030 ($ million)
Data Table on Colombia - Market size and forecast 2025-2030 ($ million)
Chart on Colombia - Year-over-year growth 2025-2030 (%)
Data Table on Colombia - Year-over-year growth 2025-2030 (%)

12.8 Market opportunity by geography

Market opportunity by geography ($ million)
Data Tables on Market opportunity by geography ($ million)

13. Drivers, Challenges, and Opportunity

13.1 Market drivers

Proliferation of global e-commerce and shift toward D2C logistics
Advancements in warehouse automation and integration of robotics
Optimization of urban real estate and trend toward vertical warehousing

13.2 Market challenges

High capital expenditure and volatility of raw material costs
Integration barriers with automated systems and technological obsolescence
Rigorous safety standards and global regulatory compliance

13.3 Impact of drivers and challenges

Impact of drivers and challenges in 2025 and 2030

13.4 Market opportunities

Sustainability and circular economy in storage infrastructure
Integration of industrial IoT and smart racking solutions
Modularity and rise of agile storage architectures

14. Competitive Landscape

14.1 Overview

14.2

Overview on criticality of inputs and factors of differentiation

14.3 Landscape disruption

Overview on factors of disruption

14.4 Industry risks

Impact of key risks on business

15. Competitive Analysis

15.1 Companies profiled

Companies covered

15.2 Company ranking index

15.3 Market positioning of companies

Matrix on companies position and classification

15.4 Advance Storage Products

Advance Storage Products - Overview
Advance Storage Products - Product / Service
Advance Storage Products - Key offerings
SWOT

15.5 AR Racking SAU

AR Racking SAU - Overview
AR Racking SAU - Product / Service
AR Racking SAU - Key offerings
SWOT

15.6 Atox S.A.

Atox S.A. - Overview
Atox S.A. - Product / Service
Atox S.A. - Key offerings
SWOT

15.7 BITO Lagertechnik Bittmann GmbH

BITO Lagertechnik Bittmann GmbH - Overview
BITO Lagertechnik Bittmann GmbH - Product / Service
BITO Lagertechnik Bittmann GmbH - Key offerings
SWOT

15.8 Bulldog Rack Co

Bulldog Rack Co - Overview
Bulldog Rack Co - Product / Service
Bulldog Rack Co - Key offerings
SWOT

15.9 Frazier Industrial Co

Frazier Industrial Co - Overview
Frazier Industrial Co - Product / Service
Frazier Industrial Co - Key offerings
SWOT

15.10 Godrej and Boyce Manufacturing

Godrej and Boyce Manufacturing - Overview
Godrej and Boyce Manufacturing - Product / Service
Godrej and Boyce Manufacturing - Key offerings
SWOT

15.11 Gonvarri Material Handling AS

Gonvarri Material Handling AS - Overview
Gonvarri Material Handling AS - Product / Service
Gonvarri Material Handling AS - Key offerings
SWOT

15.12 Jungheinrich Group

Jungheinrich Group - Overview
Jungheinrich Group - Business segments
Jungheinrich Group - Key offerings
Jungheinrich Group - Segment focus
SWOT

15.13 Mecalux Group

Mecalux Group - Overview
Mecalux Group - Product / Service
Mecalux Group - Key offerings
SWOT

15.14 Metalsistem S.p.A.

Metalsistem S.p.A. - Overview
Metalsistem S.p.A. - Product / Service
Metalsistem S.p.A. - Key offerings
SWOT

15.15 Montel Inc.

Montel Inc. - Overview
Montel Inc. - Product / Service
Montel Inc. - Key offerings
SWOT

15.16 Nedcon B.V.

Nedcon B.V. - Overview
Nedcon B.V. - Product / Service
Nedcon B.V. - Key offerings
SWOT

15.17 Ridg U Rak Inc.

Ridg U Rak Inc. - Overview
Ridg U Rak Inc. - Product / Service
Ridg U Rak Inc. - Key offerings
SWOT

15.18 SSI Schafer IT Solutions GmbH

SSI Schafer IT Solutions GmbH - Overview
SSI Schafer IT Solutions GmbH - Product / Service
SSI Schafer IT Solutions GmbH - Key offerings
SWOT

16. Appendix

16.1 Scope of the report

Market definition
Objectives
Notes and caveats

16.2 Inclusions and exclusions checklist

Inclusions checklist
Exclusions checklist

16.3 Currency conversion rates for US$

16.4 Research methodology

16.5 Data procurement

Information sources

16.6 Data validation

16.7 Validation techniques employed for market sizing

16.8 Data synthesis

16.9 360 degree market analysis

16.10 List of abbreviations

Research Methodology

Technavio presents a detailed picture of the market by way of study, synthesis, and summation of data from multiple sources. The analysts have presented the various facets of the market with a particular focus on identifying the key industry influencers. The data thus presented is comprehensive, reliable, and the result of extensive research, both primary and secondary.

INFORMATION SOURCES

Primary sources

  • Manufacturers and suppliers
  • Channel partners
  • Industry experts
  • Strategic decision makers

Secondary sources

  • Industry journals and periodicals
  • Government data
  • Financial reports of key industry players
  • Historical data
  • Press releases

DATA ANALYSIS

Data Synthesis

  • Collation of data
  • Estimation of key figures
  • Analysis of derived insights

Data Validation

  • Triangulation with data models
  • Reference against proprietary databases
  • Corroboration with industry experts

REPORT WRITING

Qualitative

  • Market drivers
  • Market challenges
  • Market trends
  • Five forces analysis

Quantitative

  • Market size and forecast
  • Market segmentation
  • Geographical insights
  • Competitive landscape

Interested in this report?

Get your sample now to see our research methodology and insights!

Download Now

Frequently Asked Questions

Warehouse Racking market growth will increase by USD 2420.6 million during 2026-2030.

The Warehouse Racking market is expected to grow at a CAGR of 6.2% during 2026-2030.

Warehouse Racking market is segmented by End-user (Automotive industry, Food and beverage industry, Retail industry, Others) Product (Selective pallets, Push back, Drive-in, Pallet flow, Others) Capacity (Medium duty, Heavy duty, Light duty)

Advance Storage Products, AR Racking SAU, Atox S.A., BITO Lagertechnik Bittmann GmbH, Bulldog Rack Co, Frazier Industrial Co, Godrej and Boyce Manufacturing, Gonvarri Material Handling AS, Heartland Steel Products Inc., Inform Racking, Jungheinrich Group, Macrack Australia Pty Ltd, Mecalux Group, Metalsistem S.p.A., Montel Inc., Nedcon B.V., Ridg U Rak Inc., Speedrack Products Group Ltd., Sperrin Metal Storage Solutions, SSI Schafer IT Solutions GmbH are a few of the key vendors in the Warehouse Racking market.

APAC will register the highest growth rate of 59.8% among the other regions. Therefore, the Warehouse Racking market in APAC is expected to garner significant business opportunities for the vendors during the forecast period.

China, India, Japan, South Korea, Australia, Indonesia, US, Canada, Mexico, Germany, UK, France, Italy, Spain, The Netherlands, Saudi Arabia, UAE, South Africa, Israel, Turkey, Brazil, Argentina, Colombia

  • Proliferation of global e-commerce and shift toward D2C logistics is the driving factor this market.

The Warehouse Racking market vendors should focus on grabbing business opportunities from the End-user segment as it accounted for the largest market share in the base year.
RIA - Research AI Assistant
Ask RIA
