Water And Wastewater Treatment Chemicals Market Analysis, Size, and Forecast 2026-2030: APAC (China, India, and Japan), North America (US, Canada, and Mexico), Europe (Germany, UK, and France), South America (Brazil, Argentina, and Chile), Middle East and Africa (Saudi Arabia, UAE, and South Africa), and Rest of World (ROW)

Water And Wastewater Treatment Chemicals Market Analysis, Size, and Forecast 2026-2030:
APAC (China, India, and Japan), North America (US, Canada, and Mexico), Europe (Germany, UK, and France), South America (Brazil, Argentina, and Chile), Middle East and Africa (Saudi Arabia, UAE, and South Africa), and Rest of World (ROW)

Published: Oct 2026 319 Pages SKU: IRTNTR43392

Market Overview at a Glance

$24.46 B
Market Opportunity
6.9%
CAGR 2025 - 2030
47.9%
APAC Growth
$20.29 B
Coagulants and flocculants segment 2024

Water And Wastewater Treatment Chemicals Market Size 2026-2030

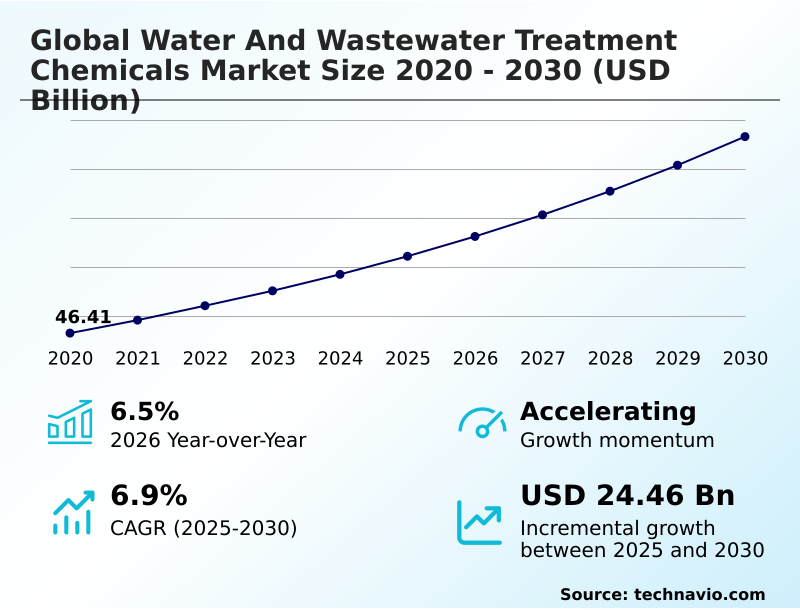
The water and wastewater treatment chemicals market size is valued to increase by USD 24.46 billion, at a CAGR of 6.9% from 2025 to 2030. Rapid urbanization and industrial effluent volume will drive the water and wastewater treatment chemicals market.

Major Market Trends & Insights

  • APAC dominated the market and accounted for a 47.9% growth during the forecast period.
  • By Type - Coagulants and flocculants segment was valued at USD 20.29 billion in 2024
  • By Application - Municipality segment accounted for the largest market revenue share in 2024

Market Size & Forecast

  • Market Opportunities: USD 40.19 billion
  • Market Future Opportunities: USD 24.46 billion
  • CAGR from 2025 to 2030 : 6.9%

Market Summary

  • The Water And Wastewater Treatment Chemicals Market demonstrates resilient expansion driven by stringent environmental compliance and decentralized water recycling mandates. Growing industrial reliance on closed-loop cooling and high-pressure boiler networks necessitates advanced chemical conditioning to prevent catastrophic equipment failure.
  • For example, implementing precision-dosed scale inhibitors in a thermal power generation facility optimized thermal heat transfer efficiency by 18%, significantly lowering annual maintenance expenditures. The relentless expansion of legal environmental accountability acts as a powerful driver, forcing industrial operators to adopt high-efficiency coagulants that neutralize complex organic pollutants prior to discharge.
  • Conversely, the market faces significant structural constraints due to escalating disposal tariffs and severe regulatory restrictions on metal-laden secondary sludge. Chemical formulators continuously refine biocide toxicity profiles and polymer charge densities to balance stringent raw water purification requirements with hazardous waste reduction targets.
  • As resource scarcity intensifies globally, operators prioritize integrated chemical regimens that enable direct liquid reuse and extend the lifecycle of delicate filtration infrastructure.

What will be the Size of the Water And Wastewater Treatment Chemicals Market during the forecast period?
Get Key Insights on Market Forecast (PDF) Get Free Sample

How is the Water And Wastewater Treatment Chemicals Market Segmented?

The water and wastewater treatment chemicals industry research report provides comprehensive data (region-wise segment analysis), with forecasts and estimates in "USD million" for the period 2026-2030, as well as historical data from 2020-2024 for the following segments.

  • Type
    • Coagulants and flocculants
    • Corrosion and scale inhibitors
    • Biocides and disinfectants
    • pH adjusters and softeners
    • Others
  • Application
    • Municipality
    • Power generation
    • Pulp and paper
    • Metal and mining
    • Others
  • Product type
    • Synthetic
    • Bio-based
  • Geography
    • APAC
      • China
      • India
      • Japan
      • South Korea
      • Australia
      • Indonesia
    • North America
      • US
      • Canada
      • Mexico
    • Europe
      • Germany
      • UK
      • France
      • Italy
      • Spain
      • The Netherlands
    • South America
      • Brazil
      • Argentina
      • Chile
    • Middle East and Africa
      • Saudi Arabia
      • UAE
      • South Africa
      • Turkey
      • Israel

By Type Insights

The coagulants and flocculants segment is estimated to witness significant growth during the forecast period.

The coagulants and flocculants segment dictates primary solid-liquid separation efficiencies across diverse water treatment networks. By leveraging polyacrylamide flocculants and heavy metal precipitants, facilities accelerate particulate aggregation during municipal raw water clarification.

This operational shift has improved overall sludge dewatering rates by 22% compared to traditional metallic salts. Expanding industrial effluent remediation practices compel operators to adopt high-performance formulations that reduce secondary sludge handling constraints.

Furthermore, integrated threshold scale inhibition strategies support continuous processing environments, enabling a 15% reduction in unplanned equipment downtime. As environmental discharge limits tighten, utility managers transition from reactive dosing to continuous chemical conditioning.

Advancements in targeted polymer architectures streamline cooling tower scale management while ensuring continuous compliance with stringent aquatic toxicity standards.
Get Free Sample

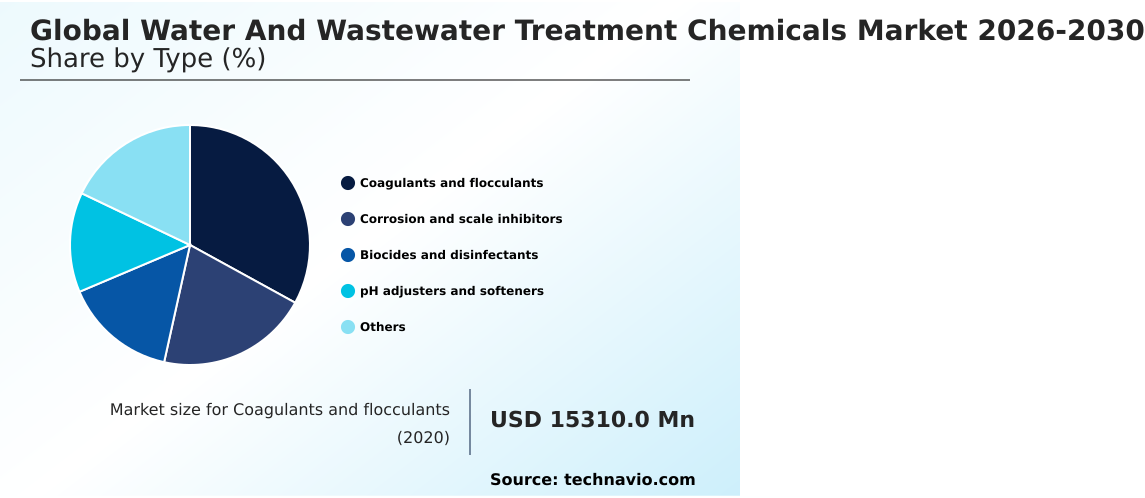
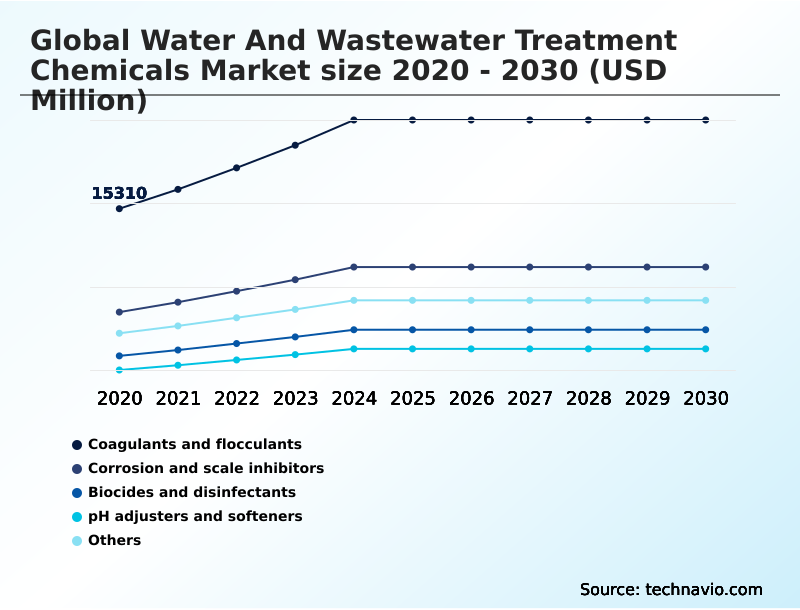
The Coagulants and flocculants segment was valued at USD 20.29 billion in 2024 and showed a gradual increase during the forecast period.
Get Free Sample

Regional Analysis

APAC is estimated to contribute 47.9% to the growth of the global market during the forecast period.Technavio’s analysts have elaborately explained the regional trends and drivers that shape the market during the forecast period.
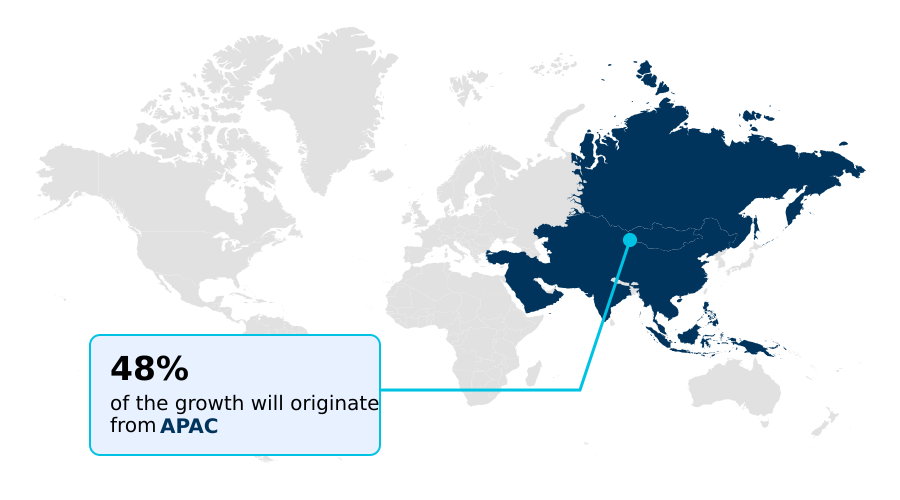
See How Water And Wastewater Treatment Chemicals Market Demand is Rising in APAC Get Free Sample

The geographic distribution of the Water And Wastewater Treatment Chemicals highlights distinct operational shifts between developed and emerging economies.

North America maintains a mature infrastructure where deploying specialized reverse osmosis maintenance chemicals has reduced facility downtime by 14% compared to legacy filtration methods.

Conversely, the APAC region exhibits a 25% faster adoption rate of basic coagulation reagents, driven by rapid industrialization and vast municipal sanitation expansions.

As environmental oversight tightens in Europe, facilities increasingly implement bio-derived polymer coagulants and non-oxidizing biocide formulations to process complex effluent streams without generating toxic byproducts.

To support direct water recycling, industrial plants integrate multi-stage chemical purification systems that protect high-recovery filtration membranes from severe scaling.

Furthermore, the proactive application of ion-exchange resin conditioners across Asian microelectronics hubs ensures continuous manufacturing throughput, reflecting localized strategies that optimize operational expenditures while adhering to strict regional water conservation mandates.

Market Dynamics

Our researchers analyzed the data with 2025 as the base year, along with the key drivers, trends, and challenges. A holistic analysis of drivers will help companies refine their marketing strategies to gain a competitive advantage.

  • The continuous evolution of the Water And Wastewater Treatment Chemicals is marked by a strategic pivot toward precision chemistry and digital infrastructure integration. Industrial facility managers recognize that outdated manual chemical buffering frequently leads to costly equipment fouling and environmental compliance violations. To mitigate these risks, operators are rapidly integrating real-time automated chemical dosing systems into their core utility circuits.
  • This technological upgrade allows for instantaneous dosage adjustments based on incoming contaminant loads, effectively reducing total chemical consumption by up to 20% compared to static feed methods. As freshwater availability constraints intensify, heavy industries are mandated to maximize internal water recycling rates.
  • This regulatory pressure accelerates the deployment of zero liquid discharge compliance chemicals, which are vital for processing highly concentrated saline effluents without causing premature thermal degradation. Furthermore, protecting delicate filtration infrastructure requires the continuous application of advanced membrane scale inhibitor formulations that prevent mineral precipitation in high-recovery loops.
  • Simultaneously, the industry is witnessing a structural shift toward bio-derived sludge dewatering polymer chemistry, allowing municipal utilities to significantly lower the toxicity footprint of secondary sludge disposal. In specialized high-tech manufacturing sectors, the demand for ultra-pure water semiconductor fabrication reagents continues to surge, as parts-per-trillion purity thresholds become absolute prerequisites for operational success.
  • Through continuous formulation refinement, chemical suppliers are transforming into comprehensive fluid management partners that optimize end-user supply chains and streamline sustainable water operations.
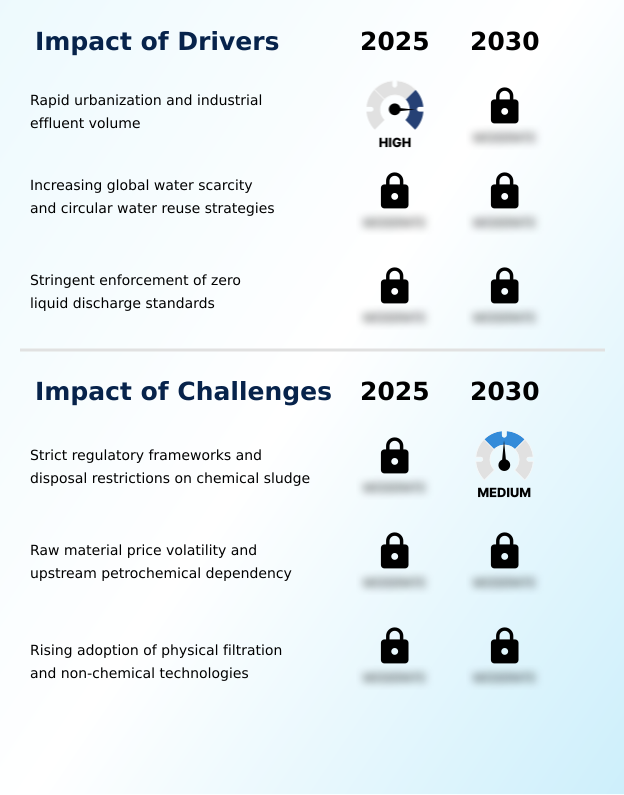
What are the key market drivers leading to the rise in the adoption of Water And Wastewater Treatment Chemicals Industry?

  • Rapid urbanization and escalating industrial effluent volumes are acting as the primary catalysts driving market expansion.

  • Worsening global freshwater scarcity serves as a formidable catalyst propelling innovation within the Water And Wastewater Treatment Chemicals. As environmental agencies systematically lower permissible limits for persistent organic pollutants, industrial end-users are compelled to implement comprehensive closed-loop water recirculation systems.
  • This structural shift drastically increases the concentration of dissolved solids, driving a 30% higher consumption rate of specialized organophosphate scale inhibitors to prevent high-salinity thermal degradation in cooling circuits.
  • To meet uncompromising parts-per-trillion purity thresholds in advanced manufacturing, operators rely heavily on high-molecular-weight flocculants that rapidly isolate suspended micro-contaminants.
  • By integrating these robust chemical mechanisms, industrial facilities successfully mitigate regulatory penalty risks while maximizing internal water reuse, securing uninterrupted production capabilities despite intensifying raw water procurement challenges.

What are the market trends shaping the Water And Wastewater Treatment Chemicals Industry?

  • The integration of artificial intelligence with real-time dosing architecture is emerging as a definitive trend in the market.

  • The rapid integration of precision-engineered synthetic organic polymers is fundamentally transforming clarification practices within the Water And Wastewater Treatment Chemicals. Historically, utility operators relied on conventional inorganic salts that inadvertently generated massive volumes of toxic secondary chemical sludge. Modern industrial facilities now deploy advanced polymeric architectures that achieve superior particulate aggregation while strictly adhering to rigorous residual monomer limits.
  • This chemical evolution allows heavy manufacturers to streamline high-pressure boiler feed operations, subsequently improving overall thermal efficiency by nearly 18%. Furthermore, the accelerated deployment of closed-loop recycling networks drives continuous demand for specialized reverse osmosis antiscalants that prevent catastrophic mineral fouling.
  • By simultaneously utilizing high-potency membrane cleaning reagents, plant engineers can extend the operational lifecycle of delicate filtration equipment and drastically reduce unplanned maintenance downtime across mission-critical utility circuits.

What challenges does the Water And Wastewater Treatment Chemicals Industry face during its growth?

  • Strict regulatory frameworks and severe disposal restrictions regarding chemical sludge represent the most critical operational challenges hindering market progression.

  • Escalating stringency in global environmental discharge permits represents a profound operational barrier within the Water And Wastewater Treatment Chemicals. Facilities face continuous pressure to completely neutralize micropollutants, which requires the complex integration of tertiary wastewater treatment systems and capital-intensive advanced oxidation processes.
  • Calibrating these sensitive biological and chemical stages is notoriously difficult; minor fluctuations in biological treatment nutrients can destabilize microbial colonies and halt purification operations. To mitigate these costly disruptions, facility managers must invest in sophisticated automated predictive dosing infrastructure. However, transitioning from manual buffering to sensor-driven automated chemical dosing increases upfront integration costs by up to 25%.
  • This financial and technical burden particularly strains middle-market industrial operators struggling to maintain compliance without compromising overall plant profitability.

Exclusive Technavio Analysis on Customer Landscape

The water and wastewater treatment chemicals market forecasting report includes the adoption lifecycle of the market, covering from the innovator’s stage to the laggard’s stage. It focuses on adoption rates in different regions based on penetration. Furthermore, the water and wastewater treatment chemicals market report also includes key purchase criteria and drivers of price sensitivity to help companies evaluate and develop their market growth analysis strategies.
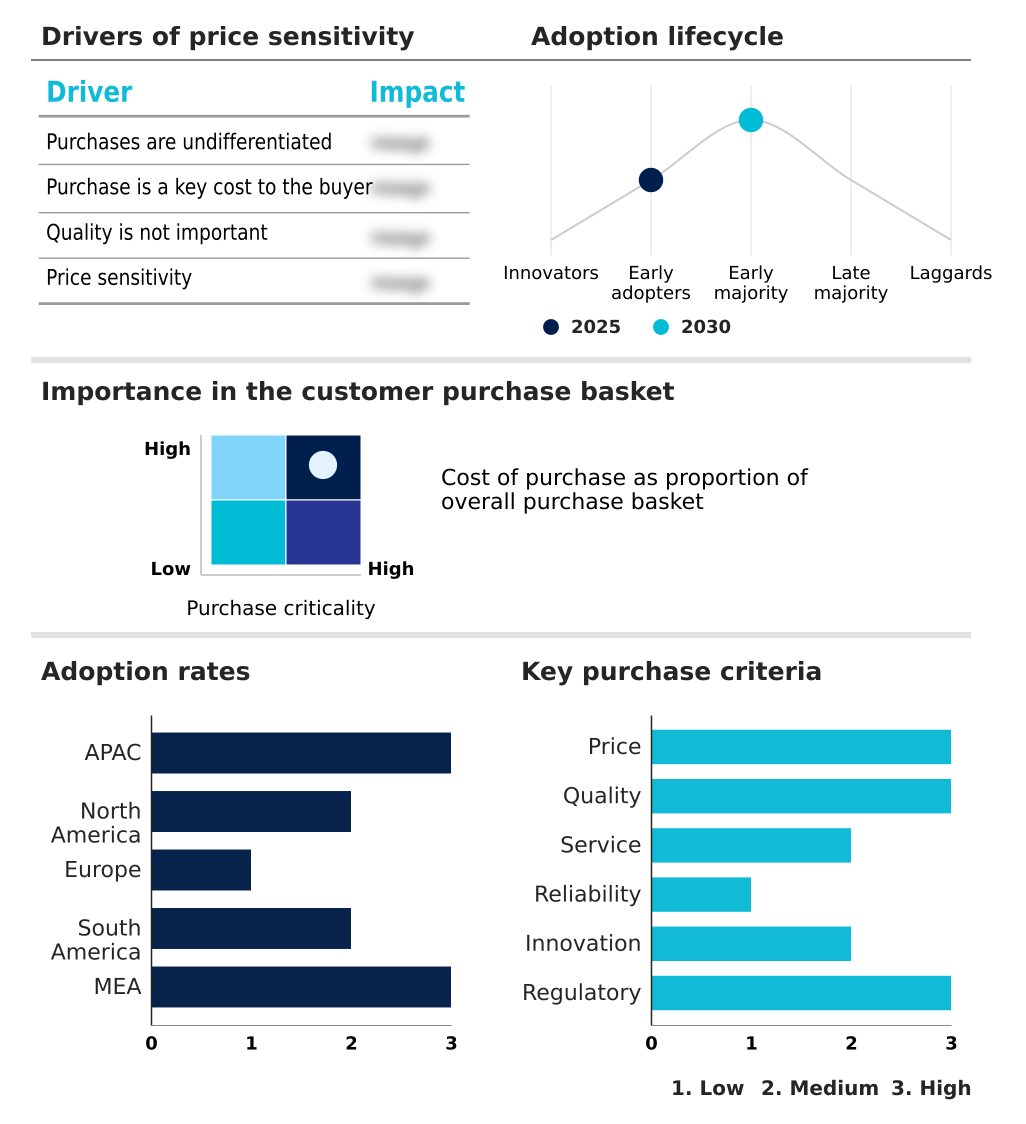
Customer Landscape of Water And Wastewater Treatment Chemicals Industry

Competitive Landscape

Companies are implementing various strategies, such as strategic alliances, water and wastewater treatment chemicals market forecast, partnerships, mergers and acquisitions, geographical expansion, and product/service launches, to enhance their presence in the industry.

Arkema Group - The vendor supplies high-performance specialty polymers, coagulant aids, and targeted scale inhibitors engineered to optimize solid-liquid separation and reduce operational fouling in advanced industrial and municipal treatment facilities.

The industry research and growth report includes detailed analyses of the competitive landscape of the market and information about key companies, including:

  • Arkema Group
  • BASF SE
  • Buckman Laboratories
  • Dow Chemical Co.
  • DuPont de Nemours Inc.
  • Ecolab Inc.
  • Evonik Industries AG
  • Feralco AB
  • GEO Specialty Chemicals Inc.
  • Hydrite Chemical Co.
  • Innospec Inc.
  • Italmatch Chemicals Spa
  • Kemira Oyj
  • Kurita Water Industries Ltd.
  • Lanxess AG
  • Nouryon Chemicals Holding B.V.
  • SNF Group
  • Solenis
  • SUEZ SA
  • The Mitsubishi Chemical Group
  • Thermax Ltd.
  • Veolia Environment SA

Qualitative and quantitative analysis of companies has been conducted to help clients understand the wider business environment as well as the strengths and weaknesses of key industry players. Data is qualitatively analyzed to categorize companies as pure play, category-focused, industry-focused, and diversified; it is quantitatively analyzed to categorize companies as dominant, leading, strong, tentative, and weak.

Recent Development and News in Water and wastewater treatment chemicals market

  • In the Commodity Chemicals industry, the shift toward sustainable, bio-derived feedstocks altered standard polymer synthesis, directly impacting Water And Wastewater Treatment Chemicals demand by accelerating the commercial availability of biodegradable coagulants.
  • The widespread adoption of closed-loop cooling technologies across high-density data centers concentrated heat-transfer fluid volumes, increasing the requirement for specialized non-corrosive additives within the Water And Wastewater Treatment Chemicals market.
  • Stricter mandates on heavy metal discharge limits from mining operations forced chemical processors to upgrade precipitation agents, boosting the consumption of advanced flocculants in the Water And Wastewater Treatment Chemicals sector by over 15%.
  • Supply chain constraints in chlor-alkali production restricted the output of conventional inorganic salts, prompting the Water And Wastewater Treatment Chemicals market to rapidly transition toward higher-efficiency synthetic organic polymers to maintain purification throughput.

Dive into Technavio’s robust research methodology, blending expert interviews, extensive data synthesis, and validated models for unparalleled Water And Wastewater Treatment Chemicals Market insights. See full methodology.

Market Scope
Page number 319
Base year 2025
Historic period 2020-2024
Forecast period 2026-2030
Growth momentum & CAGR Accelerate at a CAGR of 6.9%
Market growth 2026-2030 USD 24464.3 million
Market structure Fragmented
YoY growth 2025-2026(%) 6.5%
Key countries China, India, Japan, South Korea, Australia, Indonesia, US, Canada, Mexico, Germany, UK, France, Italy, Spain, The Netherlands, Brazil, Argentina, Chile, Saudi Arabia, UAE, South Africa, Turkey and Israel
Competitive landscape Leading Companies, Market Positioning of Companies, Competitive Strategies, and Industry Risks

Request Free Sample

Research Analyst Overview

  • The Water And Wastewater Treatment Chemicals is undergoing a rapid transition from basic commodity supply toward highly engineered, precision-driven fluid management solutions. Corporate boardroom decisions regarding environmental compliance and long-term asset protection now prioritize advanced chemical regimens over legacy treatments.
  • For instance, the proactive deployment of dissolved oxygen scavengers in thermal processing circuits has demonstrated a 28% improvement in mitigating microbially induced corrosion, drastically extending the lifecycle of capital-intensive heat exchangers. By refining fundamental coagulation dynamics, modern treatment facilities achieve superior solid-liquid separation without excessively burdening downstream disposal networks.
  • Industrial operators are increasingly implementing zero liquid discharge protocols to insulate their manufacturing supply chains from unpredictable freshwater shortages. To further optimize purification efficiency, utility managers are augmenting chemical regimens with ultraviolet disinfection systems and targeted biofilm formation control additives.
  • This sophisticated integration of physical and chemical mechanisms allows industrial end-users to drastically lower their operational toxicity footprints while maintaining optimal plant throughput and adhering strictly to tightening global discharge mandates.

What are the Key Data Covered in this Water And Wastewater Treatment Chemicals Market Research and Growth Report?

  • What is the expected growth of the Water And Wastewater Treatment Chemicals Market between 2026 and 2030?

    • USD 24.46 billion, at a CAGR of 6.9%

  • What segmentation does the market report cover?

    • The report is segmented by Type (Coagulants and flocculants, Corrosion and scale inhibitors, Biocides and disinfectants, pH adjusters and softeners, and Others), Application (Municipality, Power generation, Pulp and paper, Metal and mining, and Others), Product Type (Synthetic, and Bio-based) and Geography (APAC, North America, Europe, South America, Middle East and Africa)

  • Which regions are analyzed in the report?

    • APAC, North America, Europe, South America and Middle East and Africa

  • What are the key growth drivers and market challenges?

    • Rapid urbanization and industrial effluent volume, Strict regulatory frameworks and disposal restrictions on chemical sludge

  • Who are the major players in the Water And Wastewater Treatment Chemicals Market?

    • Arkema Group, BASF SE, Buckman Laboratories, Dow Chemical Co., DuPont de Nemours Inc., Ecolab Inc., Evonik Industries AG, Feralco AB, GEO Specialty Chemicals Inc., Hydrite Chemical Co., Innospec Inc., Italmatch Chemicals Spa, Kemira Oyj, Kurita Water Industries Ltd., Lanxess AG, Nouryon Chemicals Holding B.V., SNF Group, Solenis, SUEZ SA, The Mitsubishi Chemical Group, Thermax Ltd. and Veolia Environment SA

Market Research Insights

  • The Water And Wastewater Treatment Chemicals Market is fundamentally restructuring chemical procurement from a transactional supply model into a data-backed operational service. By deploying automated predictive dosing systems, utility boards have improved chemical utilization accuracy by 24%, effectively minimizing residual chemical waste.
  • Treating complex industrial effluents requires sophisticated microbial suppression techniques, which have proven to reduce reverse osmosis biofouling incidents by nearly 30% annually. The transition toward eco-friendly phosphorus-free blends empowers industrial facilities to achieve rigorous regulatory compliance while maintaining high throughput.
  • Integrating continuous quality monitoring networks ensures chemical dosages instantly adapt to transient pollution spikes, maximizing purification efficiency and reducing secondary sludge generation.

We can help! Our analysts can customize this water and wastewater treatment chemicals market research report to meet your requirements.

Get in touch

1. Executive Summary

1.1 Market overview

Executive Summary - Chart on Market Overview
Executive Summary - Data Table on Market Overview
Executive Summary - Chart on Global Market Characteristics
Executive Summary - Chart on Market by Geography
Executive Summary - Chart on Market Segmentation by Type
Executive Summary - Chart on Market Segmentation by Application
Executive Summary - Chart on Market Segmentation by Product Type
Executive Summary - Chart on Incremental Growth
Executive Summary - Data Table on Incremental Growth
Executive Summary - Chart on Company Market Positioning

2. Technavio Analysis

2.1 Analysis of price sensitivity, lifecycle, customer purchase basket, adoption rates, and purchase criteria

2.2 Criticality of inputs and Factors of differentiation

Chart on Overview on criticality of inputs and factors of differentiation

2.3 Factors of disruption

Chart on Overview on factors of disruption

2.4 Impact of drivers and challenges

Chart on Impact of drivers and challenges in 2025 and 2030

3. Market Landscape

3.1 Market ecosystem

Chart on Parent Market
Data Table on - Parent Market

3.2 Market characteristics

Chart on Market characteristics analysis

3.3 Value chain analysis

Chart on Value chain analysis

4. Market Sizing

4.1 Market definition

Data Table on Offerings of companies included in the market definition

4.2 Market segment analysis

Market segments

4.3 Market size 2025

4.4 Market outlook: Forecast for 2025-2030

Chart on Global - Market size and forecast 2025-2030 ($ million)
Data Table on Global - Market size and forecast 2025-2030 ($ million)
Chart on Global Market: Year-over-year growth 2025-2030 (%)
Data Table on Global Market: Year-over-year growth 2025-2030 (%)

5. Historic Market Size

5.1 Global Water And Wastewater Treatment Chemicals Market 2020 - 2024

Historic Market Size - Data Table on Global Water And Wastewater Treatment Chemicals Market 2020 - 2024 ($ million)

5.2 Type segment analysis 2020 - 2024

Historic Market Size - Type Segment 2020 - 2024 ($ million)

5.3 Application segment analysis 2020 - 2024

Historic Market Size - Application Segment 2020 - 2024 ($ million)

5.4 Product Type segment analysis 2020 - 2024

Historic Market Size - Product Type Segment 2020 - 2024 ($ million)

5.5 Geography segment analysis 2020 - 2024

Historic Market Size - Geography Segment 2020 - 2024 ($ million)

5.6 Country segment analysis 2020 - 2024

Historic Market Size - Country Segment 2020 - 2024 ($ million)

6. Qualitative Analysis

6.1 Impact of AI in Global Water and Wastewater Treatment Chemicals Market

6.2 Impact of Geopolitical Conflicts on Global Water and Wastewater Treatment Chemicals Market

7. Five Forces Analysis

7.1 Five forces summary

Five forces analysis - Comparison between 2025 and 2030

7.2 Bargaining power of buyers

Bargaining power of buyers - Impact of key factors 2025 and 2030

7.3 Bargaining power of suppliers

Bargaining power of suppliers - Impact of key factors in 2025 and 2030

7.4 Threat of new entrants

Threat of new entrants - Impact of key factors in 2025 and 2030

7.5 Threat of substitutes

Threat of substitutes - Impact of key factors in 2025 and 2030

7.6 Threat of rivalry

Threat of rivalry - Impact of key factors in 2025 and 2030

7.7 Market condition

Chart on Market condition - Five forces 2025 and 2030

8. Market Segmentation by Type

8.1 Market segments

Chart on Type - Market share 2025-2030 (%)
Data Table on Type - Market share 2025-2030 (%)

8.2 Comparison by Type

Chart on Comparison by Type
Data Table on Comparison by Type

8.3 Coagulants and flocculants - Market size and forecast 2025-2030

Chart on Coagulants and flocculants - Market size and forecast 2025-2030 ($ million)
Data Table on Coagulants and flocculants - Market size and forecast 2025-2030 ($ million)
Chart on Coagulants and flocculants - Year-over-year growth 2025-2030 (%)
Data Table on Coagulants and flocculants - Year-over-year growth 2025-2030 (%)

8.4 Corrosion and scale inhibitors - Market size and forecast 2025-2030

Chart on Corrosion and scale inhibitors - Market size and forecast 2025-2030 ($ million)
Data Table on Corrosion and scale inhibitors - Market size and forecast 2025-2030 ($ million)
Chart on Corrosion and scale inhibitors - Year-over-year growth 2025-2030 (%)
Data Table on Corrosion and scale inhibitors - Year-over-year growth 2025-2030 (%)

8.5 Biocides and disinfectants - Market size and forecast 2025-2030

Chart on Biocides and disinfectants - Market size and forecast 2025-2030 ($ million)
Data Table on Biocides and disinfectants - Market size and forecast 2025-2030 ($ million)
Chart on Biocides and disinfectants - Year-over-year growth 2025-2030 (%)
Data Table on Biocides and disinfectants - Year-over-year growth 2025-2030 (%)

8.6 pH adjusters and softeners - Market size and forecast 2025-2030

Chart on pH adjusters and softeners - Market size and forecast 2025-2030 ($ million)
Data Table on pH adjusters and softeners - Market size and forecast 2025-2030 ($ million)
Chart on pH adjusters and softeners - Year-over-year growth 2025-2030 (%)
Data Table on pH adjusters and softeners - Year-over-year growth 2025-2030 (%)

8.7 Others - Market size and forecast 2025-2030

Chart on Others - Market size and forecast 2025-2030 ($ million)
Data Table on Others - Market size and forecast 2025-2030 ($ million)
Chart on Others - Year-over-year growth 2025-2030 (%)
Data Table on Others - Year-over-year growth 2025-2030 (%)

8.8 Market opportunity by Type

Market opportunity by Type ($ million)
Data Table on Market opportunity by Type ($ million)

9. Market Segmentation by Application

9.1 Market segments

Chart on Application - Market share 2025-2030 (%)
Data Table on Application - Market share 2025-2030 (%)

9.2 Comparison by Application

Chart on Comparison by Application
Data Table on Comparison by Application

9.3 Municipality - Market size and forecast 2025-2030

Chart on Municipality - Market size and forecast 2025-2030 ($ million)
Data Table on Municipality - Market size and forecast 2025-2030 ($ million)
Chart on Municipality - Year-over-year growth 2025-2030 (%)
Data Table on Municipality - Year-over-year growth 2025-2030 (%)

9.4 Power generation - Market size and forecast 2025-2030

Chart on Power generation - Market size and forecast 2025-2030 ($ million)
Data Table on Power generation - Market size and forecast 2025-2030 ($ million)
Chart on Power generation - Year-over-year growth 2025-2030 (%)
Data Table on Power generation - Year-over-year growth 2025-2030 (%)

9.5 Pulp and paper - Market size and forecast 2025-2030

Chart on Pulp and paper - Market size and forecast 2025-2030 ($ million)
Data Table on Pulp and paper - Market size and forecast 2025-2030 ($ million)
Chart on Pulp and paper - Year-over-year growth 2025-2030 (%)
Data Table on Pulp and paper - Year-over-year growth 2025-2030 (%)

9.6 Metal and mining - Market size and forecast 2025-2030

Chart on Metal and mining - Market size and forecast 2025-2030 ($ million)
Data Table on Metal and mining - Market size and forecast 2025-2030 ($ million)
Chart on Metal and mining - Year-over-year growth 2025-2030 (%)
Data Table on Metal and mining - Year-over-year growth 2025-2030 (%)

9.7 Others - Market size and forecast 2025-2030

Chart on Others - Market size and forecast 2025-2030 ($ million)
Data Table on Others - Market size and forecast 2025-2030 ($ million)
Chart on Others - Year-over-year growth 2025-2030 (%)
Data Table on Others - Year-over-year growth 2025-2030 (%)

9.8 Market opportunity by Application

Market opportunity by Application ($ million)
Data Table on Market opportunity by Application ($ million)

10. Market Segmentation by Product Type

10.1 Market segments

Chart on Product Type - Market share 2025-2030 (%)
Data Table on Product Type - Market share 2025-2030 (%)

10.2 Comparison by Product Type

Chart on Comparison by Product Type
Data Table on Comparison by Product Type

10.3 Synthetic - Market size and forecast 2025-2030

Chart on Synthetic - Market size and forecast 2025-2030 ($ million)
Data Table on Synthetic - Market size and forecast 2025-2030 ($ million)
Chart on Synthetic - Year-over-year growth 2025-2030 (%)
Data Table on Synthetic - Year-over-year growth 2025-2030 (%)

10.4 Bio-based - Market size and forecast 2025-2030

Chart on Bio-based - Market size and forecast 2025-2030 ($ million)
Data Table on Bio-based - Market size and forecast 2025-2030 ($ million)
Chart on Bio-based - Year-over-year growth 2025-2030 (%)
Data Table on Bio-based - Year-over-year growth 2025-2030 (%)

10.5 Market opportunity by Product Type

Market opportunity by Product Type ($ million)
Data Table on Market opportunity by Product Type ($ million)

11. Customer Landscape

11.1 Customer landscape overview

Analysis of price sensitivity, lifecycle, customer purchase basket, adoption rates, and purchase criteria

12. Geographic Landscape

12.1 Geographic segmentation

Chart on Market share by geography 2025-2030 (%)
Data Table on Market share by geography 2025-2030 (%)

12.2 Geographic comparison

Chart on Geographic comparison
Data Table on Geographic comparison

12.3 APAC - Market size and forecast 2025-2030

Chart on APAC - Market size and forecast 2025-2030 ($ million)
Data Table on APAC - Market size and forecast 2025-2030 ($ million)
Chart on APAC - Year-over-year growth 2025-2030 (%)
Data Table on APAC - Year-over-year growth 2025-2030 (%)
Chart on Regional Comparison - APAC
Data Table on Regional Comparison - APAC

12.3.1 China - Market size and forecast 2025-2030

Chart on China - Market size and forecast 2025-2030 ($ million)
Data Table on China - Market size and forecast 2025-2030 ($ million)
Chart on China - Year-over-year growth 2025-2030 (%)
Data Table on China - Year-over-year growth 2025-2030 (%)

12.3.2 India - Market size and forecast 2025-2030

Chart on India - Market size and forecast 2025-2030 ($ million)
Data Table on India - Market size and forecast 2025-2030 ($ million)
Chart on India - Year-over-year growth 2025-2030 (%)
Data Table on India - Year-over-year growth 2025-2030 (%)

12.3.3 Japan - Market size and forecast 2025-2030

Chart on Japan - Market size and forecast 2025-2030 ($ million)
Data Table on Japan - Market size and forecast 2025-2030 ($ million)
Chart on Japan - Year-over-year growth 2025-2030 (%)
Data Table on Japan - Year-over-year growth 2025-2030 (%)

12.3.4 South Korea - Market size and forecast 2025-2030

Chart on South Korea - Market size and forecast 2025-2030 ($ million)
Data Table on South Korea - Market size and forecast 2025-2030 ($ million)
Chart on South Korea - Year-over-year growth 2025-2030 (%)
Data Table on South Korea - Year-over-year growth 2025-2030 (%)

12.3.5 Australia - Market size and forecast 2025-2030

Chart on Australia - Market size and forecast 2025-2030 ($ million)
Data Table on Australia - Market size and forecast 2025-2030 ($ million)
Chart on Australia - Year-over-year growth 2025-2030 (%)
Data Table on Australia - Year-over-year growth 2025-2030 (%)

12.3.6 Indonesia - Market size and forecast 2025-2030

Chart on Indonesia - Market size and forecast 2025-2030 ($ million)
Data Table on Indonesia - Market size and forecast 2025-2030 ($ million)
Chart on Indonesia - Year-over-year growth 2025-2030 (%)
Data Table on Indonesia - Year-over-year growth 2025-2030 (%)

12.4 North America - Market size and forecast 2025-2030

Chart on North America - Market size and forecast 2025-2030 ($ million)
Data Table on North America - Market size and forecast 2025-2030 ($ million)
Chart on North America - Year-over-year growth 2025-2030 (%)
Data Table on North America - Year-over-year growth 2025-2030 (%)
Chart on Regional Comparison - North America
Data Table on Regional Comparison - North America

12.4.1 US - Market size and forecast 2025-2030

Chart on US - Market size and forecast 2025-2030 ($ million)
Data Table on US - Market size and forecast 2025-2030 ($ million)
Chart on US - Year-over-year growth 2025-2030 (%)
Data Table on US - Year-over-year growth 2025-2030 (%)

12.4.2 Canada - Market size and forecast 2025-2030

Chart on Canada - Market size and forecast 2025-2030 ($ million)
Data Table on Canada - Market size and forecast 2025-2030 ($ million)
Chart on Canada - Year-over-year growth 2025-2030 (%)
Data Table on Canada - Year-over-year growth 2025-2030 (%)

12.4.3 Mexico - Market size and forecast 2025-2030

Chart on Mexico - Market size and forecast 2025-2030 ($ million)
Data Table on Mexico - Market size and forecast 2025-2030 ($ million)
Chart on Mexico - Year-over-year growth 2025-2030 (%)
Data Table on Mexico - Year-over-year growth 2025-2030 (%)

12.5 Europe - Market size and forecast 2025-2030

Chart on Europe - Market size and forecast 2025-2030 ($ million)
Data Table on Europe - Market size and forecast 2025-2030 ($ million)
Chart on Europe - Year-over-year growth 2025-2030 (%)
Data Table on Europe - Year-over-year growth 2025-2030 (%)
Chart on Regional Comparison - Europe
Data Table on Regional Comparison - Europe

12.5.1 Germany - Market size and forecast 2025-2030

Chart on Germany - Market size and forecast 2025-2030 ($ million)
Data Table on Germany - Market size and forecast 2025-2030 ($ million)
Chart on Germany - Year-over-year growth 2025-2030 (%)
Data Table on Germany - Year-over-year growth 2025-2030 (%)

12.5.2 UK - Market size and forecast 2025-2030

Chart on UK - Market size and forecast 2025-2030 ($ million)
Data Table on UK - Market size and forecast 2025-2030 ($ million)
Chart on UK - Year-over-year growth 2025-2030 (%)
Data Table on UK - Year-over-year growth 2025-2030 (%)

12.5.3 France - Market size and forecast 2025-2030

Chart on France - Market size and forecast 2025-2030 ($ million)
Data Table on France - Market size and forecast 2025-2030 ($ million)
Chart on France - Year-over-year growth 2025-2030 (%)
Data Table on France - Year-over-year growth 2025-2030 (%)

12.5.4 Italy - Market size and forecast 2025-2030

Chart on Italy - Market size and forecast 2025-2030 ($ million)
Data Table on Italy - Market size and forecast 2025-2030 ($ million)
Chart on Italy - Year-over-year growth 2025-2030 (%)
Data Table on Italy - Year-over-year growth 2025-2030 (%)

12.5.5 Spain - Market size and forecast 2025-2030

Chart on Spain - Market size and forecast 2025-2030 ($ million)
Data Table on Spain - Market size and forecast 2025-2030 ($ million)
Chart on Spain - Year-over-year growth 2025-2030 (%)
Data Table on Spain - Year-over-year growth 2025-2030 (%)

12.5.6 The Netherlands - Market size and forecast 2025-2030

Chart on The Netherlands - Market size and forecast 2025-2030 ($ million)
Data Table on The Netherlands - Market size and forecast 2025-2030 ($ million)
Chart on The Netherlands - Year-over-year growth 2025-2030 (%)
Data Table on The Netherlands - Year-over-year growth 2025-2030 (%)

12.6 South America - Market size and forecast 2025-2030

Chart on South America - Market size and forecast 2025-2030 ($ million)
Data Table on South America - Market size and forecast 2025-2030 ($ million)
Chart on South America - Year-over-year growth 2025-2030 (%)
Data Table on South America - Year-over-year growth 2025-2030 (%)
Chart on Regional Comparison - South America
Data Table on Regional Comparison - South America

12.6.1 Brazil - Market size and forecast 2025-2030

Chart on Brazil - Market size and forecast 2025-2030 ($ million)
Data Table on Brazil - Market size and forecast 2025-2030 ($ million)
Chart on Brazil - Year-over-year growth 2025-2030 (%)
Data Table on Brazil - Year-over-year growth 2025-2030 (%)

12.6.2 Argentina - Market size and forecast 2025-2030

Chart on Argentina - Market size and forecast 2025-2030 ($ million)
Data Table on Argentina - Market size and forecast 2025-2030 ($ million)
Chart on Argentina - Year-over-year growth 2025-2030 (%)
Data Table on Argentina - Year-over-year growth 2025-2030 (%)

12.6.3 Chile - Market size and forecast 2025-2030

Chart on Chile - Market size and forecast 2025-2030 ($ million)
Data Table on Chile - Market size and forecast 2025-2030 ($ million)
Chart on Chile - Year-over-year growth 2025-2030 (%)
Data Table on Chile - Year-over-year growth 2025-2030 (%)

12.7 Middle East and Africa - Market size and forecast 2025-2030

Chart on Middle East and Africa - Market size and forecast 2025-2030 ($ million)
Data Table on Middle East and Africa - Market size and forecast 2025-2030 ($ million)
Chart on Middle East and Africa - Year-over-year growth 2025-2030 (%)
Data Table on Middle East and Africa - Year-over-year growth 2025-2030 (%)
Chart on Regional Comparison - Middle East and Africa
Data Table on Regional Comparison - Middle East and Africa

12.7.1 Saudi Arabia - Market size and forecast 2025-2030

Chart on Saudi Arabia - Market size and forecast 2025-2030 ($ million)
Data Table on Saudi Arabia - Market size and forecast 2025-2030 ($ million)
Chart on Saudi Arabia - Year-over-year growth 2025-2030 (%)
Data Table on Saudi Arabia - Year-over-year growth 2025-2030 (%)

12.7.2 UAE - Market size and forecast 2025-2030

Chart on UAE - Market size and forecast 2025-2030 ($ million)
Data Table on UAE - Market size and forecast 2025-2030 ($ million)
Chart on UAE - Year-over-year growth 2025-2030 (%)
Data Table on UAE - Year-over-year growth 2025-2030 (%)

12.7.3 South Africa - Market size and forecast 2025-2030

Chart on South Africa - Market size and forecast 2025-2030 ($ million)
Data Table on South Africa - Market size and forecast 2025-2030 ($ million)
Chart on South Africa - Year-over-year growth 2025-2030 (%)
Data Table on South Africa - Year-over-year growth 2025-2030 (%)

12.7.4 Turkey - Market size and forecast 2025-2030

Chart on Turkey - Market size and forecast 2025-2030 ($ million)
Data Table on Turkey - Market size and forecast 2025-2030 ($ million)
Chart on Turkey - Year-over-year growth 2025-2030 (%)
Data Table on Turkey - Year-over-year growth 2025-2030 (%)

12.7.5 Israel - Market size and forecast 2025-2030

Chart on Israel - Market size and forecast 2025-2030 ($ million)
Data Table on Israel - Market size and forecast 2025-2030 ($ million)
Chart on Israel - Year-over-year growth 2025-2030 (%)
Data Table on Israel - Year-over-year growth 2025-2030 (%)

12.8 Market opportunity by geography

Market opportunity by geography ($ million)
Data Tables on Market opportunity by geography ($ million)

13. Drivers, Challenges, and Opportunity

13.1 Market drivers

Rapid urbanization and industrial effluent volume
Increasing global water scarcity and circular water reuse strategies
Stringent enforcement of zero liquid discharge standards

13.2 Market challenges

Strict regulatory frameworks and disposal restrictions on chemical sludge
Raw material price volatility and upstream petrochemical dependency
Rising adoption of physical filtration and non-chemical technologies

13.3 Impact of drivers and challenges

Impact of drivers and challenges in 2025 and 2030

13.4 Market opportunities

Integration of AI and real-time dosing architecture
Transition toward bio-derived chemistry and circular water solutions
Portfolio diversification into ultra-pure water and high-tech industrial applications

14. Competitive Landscape

14.1 Overview

14.2

Overview on criticality of inputs and factors of differentiation

14.3 Landscape disruption

Overview on factors of disruption

14.4 Industry risks

Impact of key risks on business

15. Competitive Analysis

15.1 Companies profiled

Companies covered

15.2 Company ranking index

15.3 Market positioning of companies

Matrix on companies position and classification

15.4 Arkema Group

Arkema Group - Overview
Arkema Group - Business segments
Arkema Group - Key news
Arkema Group - Key offerings
Arkema Group - Segment focus
SWOT

15.5 BASF SE

BASF SE - Overview
BASF SE - Business segments
BASF SE - Key news
BASF SE - Key offerings
BASF SE - Segment focus
SWOT

15.6 Dow Chemical Co.

Dow Chemical Co. - Overview
Dow Chemical Co. - Business segments
Dow Chemical Co. - Key news
Dow Chemical Co. - Key offerings
Dow Chemical Co. - Segment focus
SWOT

15.7 DuPont de Nemours Inc.

DuPont de Nemours Inc. - Overview
DuPont de Nemours Inc. - Business segments
DuPont de Nemours Inc. - Key news
DuPont de Nemours Inc. - Key offerings
DuPont de Nemours Inc. - Segment focus
SWOT

15.8 Ecolab Inc.

Ecolab Inc. - Overview
Ecolab Inc. - Business segments
Ecolab Inc. - Key news
Ecolab Inc. - Key offerings
Ecolab Inc. - Segment focus
SWOT

15.9 Evonik Industries AG

Evonik Industries AG - Overview
Evonik Industries AG - Business segments
Evonik Industries AG - Key news
Evonik Industries AG - Key offerings
Evonik Industries AG - Segment focus
SWOT

15.10 Innospec Inc.

Innospec Inc. - Overview
Innospec Inc. - Business segments
Innospec Inc. - Key offerings
Innospec Inc. - Segment focus
SWOT

15.11 Kemira Oyj

Kemira Oyj - Overview
Kemira Oyj - Business segments
Kemira Oyj - Key offerings
Kemira Oyj - Segment focus
SWOT

15.12 Kurita Water Industries Ltd.

Kurita Water Industries Ltd. - Overview
Kurita Water Industries Ltd. - Business segments
Kurita Water Industries Ltd. - Key offerings
Kurita Water Industries Ltd. - Segment focus
SWOT

15.13 Lanxess AG

Lanxess AG - Overview
Lanxess AG - Business segments
Lanxess AG - Key offerings
Lanxess AG - Segment focus
SWOT

15.14 Nouryon Chemicals Holding B.V.

Nouryon Chemicals Holding B.V. - Overview
Nouryon Chemicals Holding B.V. - Product / Service
Nouryon Chemicals Holding B.V. - Key offerings
SWOT

15.15 SUEZ SA

SUEZ SA - Overview
SUEZ SA - Product / Service
SUEZ SA - Key offerings
SWOT

15.16 The Mitsubishi Chemical Group

The Mitsubishi Chemical Group - Overview
The Mitsubishi Chemical Group - Business segments
The Mitsubishi Chemical Group - Key news
The Mitsubishi Chemical Group - Key offerings
The Mitsubishi Chemical Group - Segment focus
SWOT

15.17 Thermax Ltd.

Thermax Ltd. - Overview
Thermax Ltd. - Business segments
Thermax Ltd. - Key offerings
Thermax Ltd. - Segment focus
SWOT

15.18 Veolia Environment SA

Veolia Environment SA - Overview
Veolia Environment SA - Business segments
Veolia Environment SA - Key news
Veolia Environment SA - Key offerings
Veolia Environment SA - Segment focus
SWOT

16. Appendix

16.1 Scope of the report

Market definition
Objectives
Notes and caveats

16.2 Inclusions and exclusions checklist

Inclusions checklist
Exclusions checklist

16.3 Currency conversion rates for US$

16.4 Research methodology

16.5 Data procurement

Information sources

16.6 Data validation

16.7 Validation techniques employed for market sizing

16.8 Data synthesis

16.9 360 degree market analysis

16.10 List of abbreviations

Research Methodology

Technavio presents a detailed picture of the market by way of study, synthesis, and summation of data from multiple sources. The analysts have presented the various facets of the market with a particular focus on identifying the key industry influencers. The data thus presented is comprehensive, reliable, and the result of extensive research, both primary and secondary.

INFORMATION SOURCES

Primary sources

  • Manufacturers and suppliers
  • Channel partners
  • Industry experts
  • Strategic decision makers

Secondary sources

  • Industry journals and periodicals
  • Government data
  • Financial reports of key industry players
  • Historical data
  • Press releases

DATA ANALYSIS

Data Synthesis

  • Collation of data
  • Estimation of key figures
  • Analysis of derived insights

Data Validation

  • Triangulation with data models
  • Reference against proprietary databases
  • Corroboration with industry experts

REPORT WRITING

Qualitative

  • Market drivers
  • Market challenges
  • Market trends
  • Five forces analysis

Quantitative

  • Market size and forecast
  • Market segmentation
  • Geographical insights
  • Competitive landscape

Interested in this report?

Get your sample now to see our research methodology and insights!

Download Now

Frequently Asked Questions

Water And Wastewater Treatment Chemicals market growth will increase by USD 24464.3 million during 2026-2030.

The Water And Wastewater Treatment Chemicals market is expected to grow at a CAGR of 6.9% during 2026-2030.

Water And Wastewater Treatment Chemicals market is segmented by Type (Coagulants and flocculants, Corrosion and scale inhibitors, Biocides and disinfectants, pH adjusters and softeners, Others) Application (Municipality, Power generation, Pulp and paper, Metal and mining, Others) Product type (Synthetic, Bio-based)

Arkema Group, BASF SE, Buckman Laboratories, Dow Chemical Co., DuPont de Nemours Inc., Ecolab Inc., Evonik Industries AG, Feralco AB, GEO Specialty Chemicals Inc., Hydrite Chemical Co., Innospec Inc., Italmatch Chemicals Spa, Kemira Oyj, Kurita Water Industries Ltd., Lanxess AG, Nouryon Chemicals Holding B.V., SNF Group, Solenis, SUEZ SA, The Mitsubishi Chemical Group, Thermax Ltd., Veolia Environment SA are a few of the key vendors in the Water And Wastewater Treatment Chemicals market.

APAC will register the highest growth rate of 47.9% among the other regions. Therefore, the Water And Wastewater Treatment Chemicals market in APAC is expected to garner significant business opportunities for the vendors during the forecast period.

China, India, Japan, South Korea, Australia, Indonesia, US, Canada, Mexico, Germany, UK, France, Italy, Spain, The Netherlands, Brazil, Argentina, Chile, Saudi Arabia, UAE, South Africa, Turkey, Israel

  • Rapid urbanization and industrial effluent volume is the driving factor this market.

The Water And Wastewater Treatment Chemicals market vendors should focus on grabbing business opportunities from the Type segment as it accounted for the largest market share in the base year.
RIA - Research AI Assistant
Ask RIA
