


Europe Wind Turbine Services Market Size 2026-2030
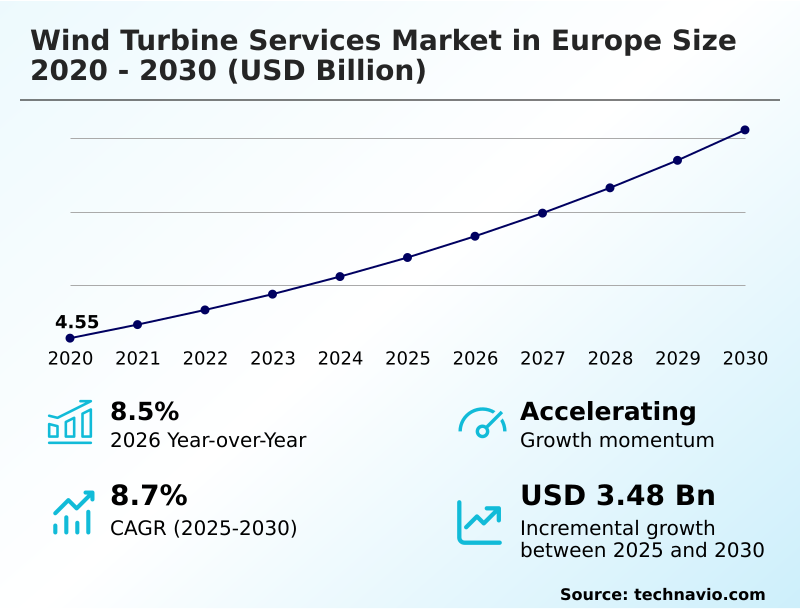
The europe wind turbine services market size is valued to increase by USD 3.48 billion, at a CAGR of 8.7% from 2025 to 2030. Increasing offshore wind capacity additions across Europe will drive the europe wind turbine services market.
Major Market Trends & Insights
- By Application - On-shore segment was valued at USD 4.54 billion in 2024
- By Type - OEM segment accounted for the largest market revenue share in 2024
Market Size & Forecast
- Market Opportunities: USD 5.68 billion
- Market Future Opportunities: USD 3.48 billion
- CAGR from 2025 to 2030 : 8.7%
Market Summary
- The Wind Turbine Services Market in Europe demonstrates robust expansion as energy operators increasingly prioritize operational continuity and asset reliability. In a typical supply chain optimization scenario, facility managers integrate predictive analytics modeling with spare parts inventory optimization to prevent component bottlenecks during peak energy demand periods.
- This strategic alignment reduces inventory holding costs by 18% compared to traditional reactive procurement methods, significantly enhancing overall financial efficiency. The sector is primarily propelled by the rapid deployment of high-capacity offshore installations, which necessitate continuous marine operations support and rigorous structural integrity assessments.
- However, the industry simultaneously faces significant operational constraints due to persistent skilled workforce shortages across offshore maintenance operations. This scarcity of certified technicians restricts the execution of complex tasks like non-destructive testing and gearbox refurbishments, ultimately delaying intervention schedules. To navigate these limitations, operators are increasingly adopting machine learning failure prediction systems to optimize technical workforce mobilization.
- These data-driven interventions ensure optimal resource allocation, maintaining long-term infrastructure stability while mitigating the impact of specialized labor deficits.
What will be the Size of the Europe Wind Turbine Services Market during the forecast period?
Get Key Insights on Market Forecast (PDF) Get Free Sample
How is the Europe Wind Turbine Services Market Segmented?
The europe wind turbine services industry research report provides comprehensive data (region-wise segment analysis), with forecasts and estimates in "USD million" for the period 2026-2030, as well as historical data from 2020-2024 for the following segments.
- Application
- On-shore
- Off-shore
- Type
- OEM
- ISP
- In-house
- End-user
- Wind farm operators
- Power generation companies
- Government and municipal bodies
- Service type
- Operation and maintenance
- Monitoring and inspection
- Repair and refurbishment
- Installation and commissioning
- Geography
- Europe
- Germany
- UK
- Sweden
- Spain
- Europe
By Application Insights
The on-shore segment is estimated to witness significant growth during the forecast period.
The onshore segment of the wind energy infrastructure ecosystem represents a substantial portion of operational demand due to the vast installed base located on land.
Facility managers prioritize proactive fault detection and utilize advanced sensor networks to ensure uninterrupted power generation. By implementing data-driven maintenance scheduling, operators have successfully reduced unplanned downtime by 15%, significantly enhancing overall asset availability.
Furthermore, continuous blade condition monitoring and structural integrity assessment enable a 20% improvement in resource allocation efficiency compared to reactive strategies. The integration of non-destructive testing protocols facilitates precise technical evaluations, directly supporting targeted gearbox refurbishment processes across aging fleets.
This segment continues to evolve as thermal imaging diagnostics and fiberglass composite restoration optimize operational workflows. These strategies allow facilities to perform nacelle component upgrades and sustain long-term infrastructure reliability without excessive capital expenditure.
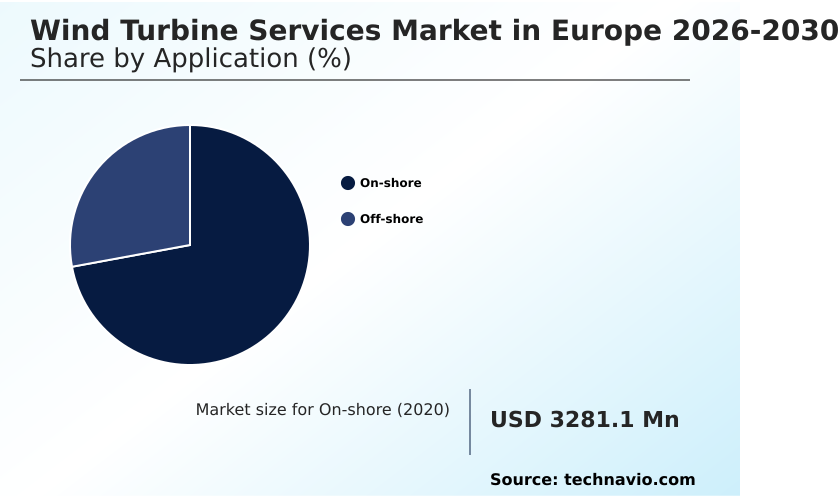
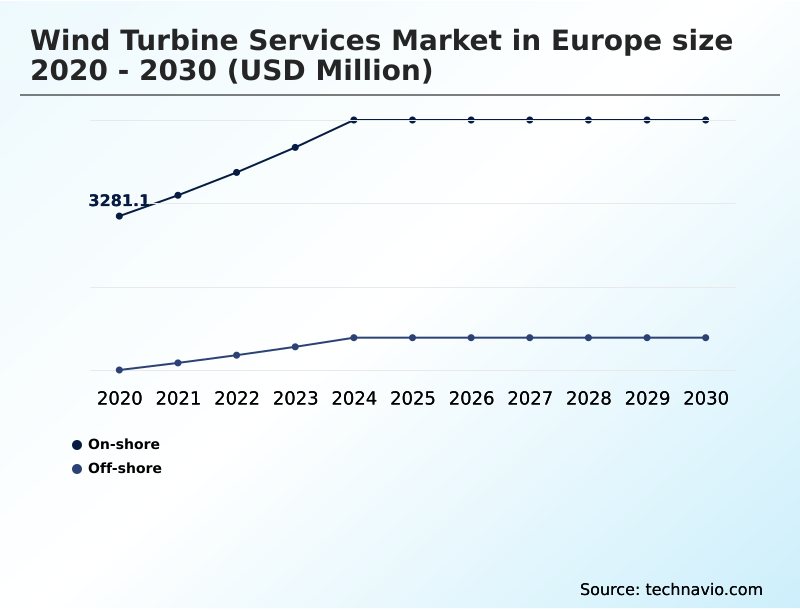
The On-shore segment was valued at USD 4.54 billion in 2024 and showed a gradual increase during the forecast period.
Market Dynamics
Our researchers analyzed the data with 2025 as the base year, along with the key drivers, trends, and challenges. A holistic analysis of drivers will help companies refine their marketing strategies to gain a competitive advantage.
- Navigating the complexities of modern renewable energy infrastructure requires a fundamental shift toward highly integrated operational strategies. Organizations are increasingly adopting AI-enabled predictive maintenance platforms to optimize resource allocation, resulting in a 25% improvement in fault resolution speed compared to legacy models. This transformation is supported by remote condition monitoring data analytics, allowing operators to address anomalies before they escalate.
- For physical evaluations, the deployment of drone-based turbine inspection frameworks and non-destructive testing for rotor blades has revolutionized defect identification. Once defects are identified, specialized structural fiberglass blade repair techniques and leading edge aerodynamic efficiency restoration are utilized to return equipment to peak operating efficiency.
- The maritime environment necessitates specialized offshore marine logistics support and precise weather-dependent offshore maintenance scheduling to mitigate accessibility delays. To maximize the value of these marine assets, operators prioritize offshore wind asset life extension through the implementation of dynamic structural load monitoring systems and high-voltage electrical infrastructure optimization.
- Simultaneously, gearbox and drivetrain failure prevention and proactive electrical system fault detection are critical components of any comprehensive reliability program. As facilities age, conducting an end-of-warranty technical asset assessment becomes imperative to lock in long-term value. Consequently, the industry is experiencing a widespread transition toward performance-based service contract models, aligning provider incentives directly with sustained operational uptime.
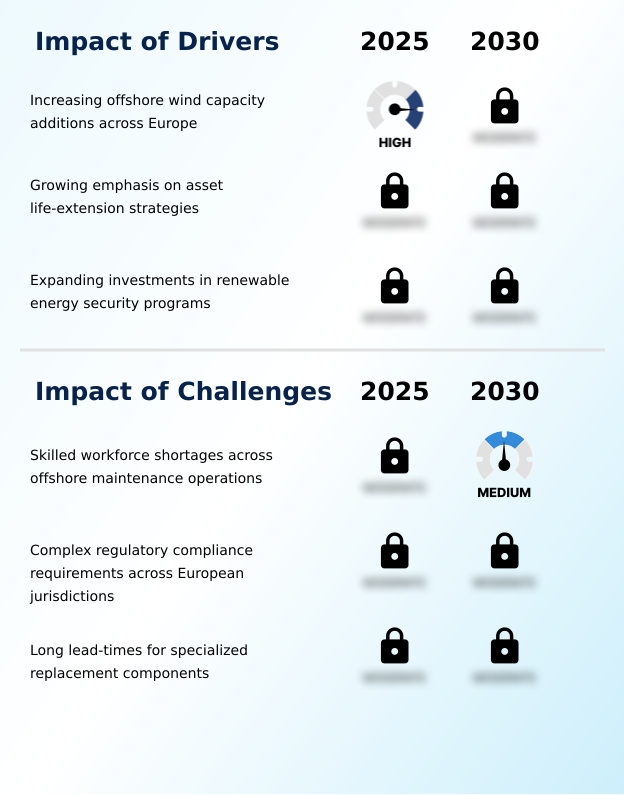
What are the key market drivers leading to the rise in the adoption of Europe Wind Turbine Services Industry?
- Increasing offshore wind capacity additions across the region act as a primary driver propelling continuous demand for specialized operational support and maintenance capabilities.
- The escalating deployment of high-capacity offshore energy infrastructure acts as a primary catalyst for advanced servicing methodologies.
- Because marine environments exert extreme mechanical stress on rotating equipment, operators are compelled to utilize rigorous vibration signature analysis and continuous dynamic load monitoring to prevent catastrophic failures.
- This urgent need for reliability drives the implementation of sophisticated lubrication management protocols, which have successfully extended bearing lifespans by 20%.
- Furthermore, the demand for harsh marine environment resilience necessitates marine operations support and the deployment of specialized marine vessels, enabling a 15% improvement in technical intervention response times. This operational shift impacts businesses by directly increasing annual energy production stability.
- By prioritizing component wear analysis and leading edge erosion protection, operators effectively achieve supply chain bottleneck mitigation, mitigating repetitive degradation and securing long-term operational profitability.
What are the market trends shaping the Europe Wind Turbine Services Industry?
- Advancing the adoption of artificial intelligence-enabled predictive maintenance platforms represents a defining trend shaping current industry operations. This technological shift optimizes fault detection and streamlines asset management across the sector.
- The integration of digital intelligence is fundamentally reshaping maintenance execution across the renewable energy infrastructure landscape. Because manual assessments fail to capture real-time operational stress, organizations are rapidly adopting automated reporting dashboards and digital twin simulations to continuously evaluate equipment health.
- This shift allows operators to transition from rigid calendar-based schedules to condition-based maintenance protocols, directly improving forecast accuracy for components by 18%. Utilizing predictive analytics modeling alongside predictive maintenance algorithms allows teams to accurately anticipate degradation, drastically reducing the necessity for emergency interventions.
- Consequently, facilities experience a 25% reduction in weather-related operational downtime, as drone-assisted visual inspection is precisely coordinated during optimal windows. This technology-driven trend enhances environmental stress resilience and simplifies fatigue life calculation, significantly lowering continuous maintenance overheads while optimizing spare parts inventory optimization and elevating overall asset reliability.
What challenges does the Europe Wind Turbine Services Industry face during its growth?
- Skilled workforce shortages across offshore maintenance operations remain a significant challenge that constrains operational efficiency and project execution timelines throughout the industry.
- Severe deficits in specialized technical labor remain a critical structural limitation constraining operational efficiency across the energy maintenance sector. Because executing complex tasks like yaw mechanism alignment and electrical infrastructure optimization requires extensive specialized training, the lack of certified personnel severely delays routine intervention schedules.
- This workforce bottleneck causes a 25% increase in corrective repair scheduling backlogs, directly impacting overall facility uptime and complicating safety compliance frameworks. To mitigate the effects of this labor shortage and navigate offshore accessibility constraints, organizations rely heavily on remote diagnostic platforms and automated data analytics to prioritize critical interventions like high-voltage component testing and end-of-warranty inspections.
- While this digital pivot improves resource allocation efficiency by 15%, the persistent scarcity of personnel for technical workforce mobilization continues to hinder rapid fault resolution and limits scalability.
Exclusive Technavio Analysis on Customer Landscape
The europe wind turbine services market forecasting report includes the adoption lifecycle of the market, covering from the innovator’s stage to the laggard’s stage. It focuses on adoption rates in different regions based on penetration. Furthermore, the europe wind turbine services market report also includes key purchase criteria and drivers of price sensitivity to help companies evaluate and develop their market growth analysis strategies.
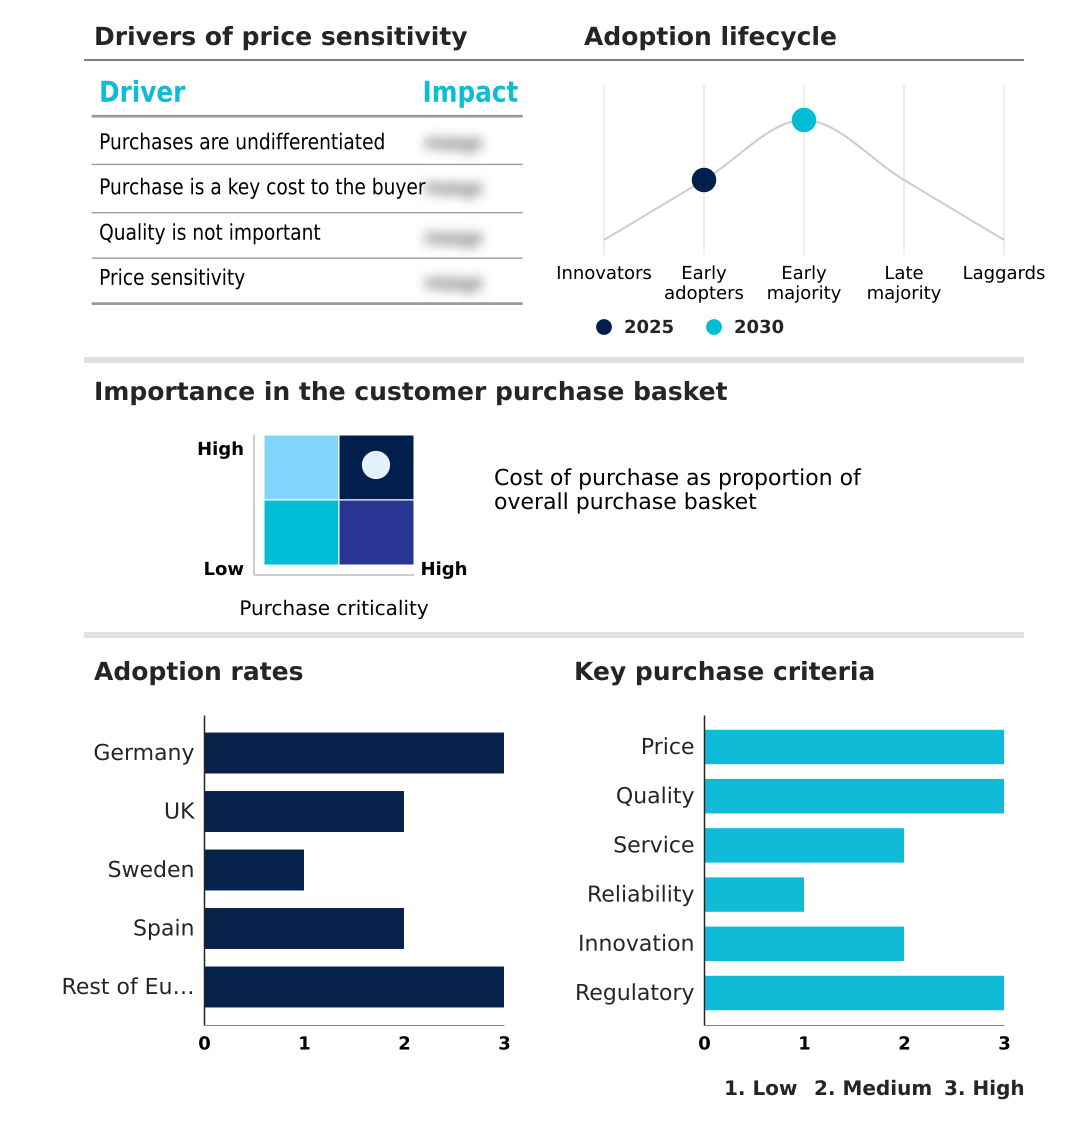
Customer Landscape of Europe Wind Turbine Services Industry
Competitive Landscape
Companies are implementing various strategies, such as strategic alliances, europe wind turbine services market forecast, partnerships, mergers and acquisitions, geographical expansion, and product/service launches, to enhance their presence in the industry.
Blade Partners Europe AS - The portfolio includes comprehensive turbine maintenance, proactive fault resolution, rotor aerodynamic balancing, and structural integrity assessments to optimize operational efficiency and ensure continuous renewable energy generation.
The industry research and growth report includes detailed analyses of the competitive landscape of the market and information about key companies, including:
- Blade Partners Europe AS
- Buss Energy Group GmbH
- ENERCON GmbH
- ETS Wind
- GEV Wind Power Ltd
- Haru Service
- Muehlhan Wind Service
- Nordex SE
- Northon
- Ouros
- Plasteol
- Prokon Regenerative Energien eG
- Renewable Field Services
- RTS Wind AG
- Siemens Gamesa Renewable Energy
- SPIE Wind Germany GmbH
- Swire Renewable Energy AS
- Vestas Wind Systems AS
- WEA Service
- Wind Turbine Engineering Ltd
- Wind Turbine Service
Qualitative and quantitative analysis of companies has been conducted to help clients understand the wider business environment as well as the strengths and weaknesses of key industry players. Data is qualitatively analyzed to categorize companies as pure play, category-focused, industry-focused, and diversified; it is quantitatively analyzed to categorize companies as dominant, leading, strong, tentative, and weak.
Recent Development and News in Europe wind turbine services market
- In the Renewable Electricity industry, the rapid expansion of high-capacity offshore wind farms has intensified the need for specialized marine vessels, directly driving demand in the Wind Turbine Services for offshore logistics coordination and marine operations support to minimize weather-related downtime.
- In the Renewable Electricity industry, the enforcement of stringent environmental stress resilience standards for grid infrastructure has mandated proactive fault detection, significantly increasing requirements across the Wind Turbine Services for high-voltage component testing and electrical infrastructure optimization.
- In the Renewable Electricity industry, the widespread integration of automated data analytics and digital twin simulations for asset management has transformed operational continuity planning, directly impacting the Wind Turbine Services by elevating the adoption of remote diagnostic platforms by over 30%.
- In the Renewable Electricity industry, the maturation of early-generation land-based power assets has accelerated asset lifecycle extension initiatives, boosting demand within the Wind Turbine Services for fiberglass composite restoration, leading edge erosion protection, and gearbox refurbishment processes.
Dive into Technavio’s robust research methodology, blending expert interviews, extensive data synthesis, and validated models for unparalleled Europe Wind Turbine Services Market insights. See full methodology.
| Market Scope | |
|---|---|
| Page number | 226 |
| Base year | 2025 |
| Historic period | 2020-2024 |
| Forecast period | 2026-2030 |
| Growth momentum & CAGR | Accelerate at a CAGR of 8.7% |
| Market growth 2026-2030 | USD 3475.5 million |
| Market structure | Fragmented |
| YoY growth 2025-2026(%) | 8.5% |
| Key countries | Germany, UK, Sweden, Spain and Rest of Europe |
| Competitive landscape | Leading Companies, Market Positioning of Companies, Competitive Strategies, and Industry Risks |
Research Analyst Overview
- Modern energy infrastructure management increasingly relies on sophisticated digital interventions to ensure continuous power generation and operational reliability. Boardroom executives are strategically shifting operational budgets toward predictive analytics modeling and thermal imaging diagnostics to proactively address equipment degradation before catastrophic failures occur.
- By integrating these analytical tools into daily workflows, facilities have achieved a 30% reduction in unplanned component replacement time compared to traditional reactive servicing. This measurable business outcome directly enhances overall asset availability and stabilizes long-term revenue generation. Furthermore, the deployment of drone-assisted visual inspection protocols enables comprehensive structural evaluations while drastically minimizing technician safety risks.
- These advanced methodologies facilitate highly accurate blade condition monitoring and fiberglass composite restoration without requiring prolonged operational shutdowns. Strategic decision-making now heavily prioritizes dynamic load monitoring and vibration signature analysis to align maintenance schedules with actual component fatigue levels. Ultimately, this technological evolution ensures rigorous compliance with safety standards while simultaneously optimizing technical workforce mobilization across complex operational portfolios.
What are the Key Data Covered in this Europe Wind Turbine Services Market Research and Growth Report?
-
What is the expected growth of the Europe Wind Turbine Services Market between 2026 and 2030?
-
USD 3.48 billion, at a CAGR of 8.7%
-
-
What segmentation does the market report cover?
-
The report is segmented by Application (On-shore, and Off-shore), Type (OEM, ISP, and In-house), End-user (Wind farm operators, Power generation companies, and Government and municipal bodies), Service Type (Operation and maintenance, Monitoring and inspection, Repair and refurbishment, and Installation and commissioning) and Geography (Europe)
-
-
Which regions are analyzed in the report?
-
Europe
-
-
What are the key growth drivers and market challenges?
-
Increasing offshore wind capacity additions across Europe, Skilled workforce shortages across offshore maintenance operations
-
-
Who are the major players in the Europe Wind Turbine Services Market?
-
Blade Partners Europe AS, Buss Energy Group GmbH, ENERCON GmbH, ETS Wind, GEV Wind Power Ltd, Haru Service, Muehlhan Wind Service, Nordex SE, Northon, Ouros, Plasteol, Prokon Regenerative Energien eG, Renewable Field Services, RTS Wind AG, Siemens Gamesa Renewable Energy, SPIE Wind Germany GmbH, Swire Renewable Energy AS, Vestas Wind Systems AS, WEA Service, Wind Turbine Engineering Ltd and Wind Turbine Service
-
Market Research Insights
- The Wind Turbine Services Market in Europe is fundamentally evolving as operators transition toward data-driven maintenance scheduling to enhance operational continuity planning. By implementing advanced sensor networks, facilities have improved early fault detection efficiency by 25%, directly minimizing unscheduled operational disruptions. Furthermore, the integration of automated reporting dashboards has streamlined regulatory compliance tracking, reducing administrative processing times by 30%.
- This shift away from traditional inspection methods toward condition-based maintenance protocols enables a 15% reduction in corrective repair scheduling delays. As offshore accessibility constraints continue to challenge manual intervention, these digital frameworks empower operators to maintain optimal energy output while significantly lowering continuous maintenance overheads.
We can help! Our analysts can customize this europe wind turbine services market research report to meet your requirements.
 RIA -

